R E S E A R C H
Open Access
A scalable and memory-efficient
algorithm for
de novo
transcriptome assembly
of non-model organisms
Sing-Hoi Sze
1,2*, Meaghan L. Pimsler
3, Jeffery K. Tomberlin
3, Corbin D. Jones
4and Aaron M. Tarone
3FromFifth IEEE International Conference on Computational Advances in Bio and Medical Sciences (ICCABS 2015) Miami, FL, USA. 15–17 October 2015
Abstract
Background: With increased availability ofde novoassembly algorithms, it is feasible to study entire transcriptomes of non-model organisms. While algorithms are available that are specifically designed for performing transcriptome assembly from high-throughput sequencing data, they are very memory-intensive, limiting their applications to small data sets with few libraries.
Results: We develop a transcriptome assembly algorithm that recovers alternatively spliced isoforms and expression levels while utilizing as many RNA-Seq libraries as possible that contain hundreds of gigabases of data. New
techniques are developed so that computations can be performed on a computing cluster with moderate amount of physical memory.
Conclusions: Our strategy minimizes memory consumption while simultaneously obtaining comparable or improved accuracy over existing algorithms. It provides support for incremental updates of assemblies when new libraries become available.
Keywords: RNA-Seq, Transcriptome assembly, Alternative splicing, Gene expression
Background
As the advance of high-throughput sequencing makes it possible to sequence billions of bases in a single experi-ment, this shift in the availability of genomic data allows researchers to focus on biological questions in non-model organisms. With the increased availability of de novo assembly algorithms that are designed specifically for assembling millions of short reads [1–8], it becomes possible to study entire genomes or transcriptomes by investigating the assembled sequences.
To obtain a transcriptome, many RNA-Seq libraries are constructed under different experimental conditions or developmental stages, with each library corresponding to
*Correspondence: [email protected]
1Department of Computer Science and Engineering, Texas A&M University,
College Station, TX 77843, USA
2Department of Biochemistry & Biophysics, Texas A&M University, College
Station, TX 77843, USA
Full list of author information is available at the end of the article
one sequencing run of a biological sample. It is prefer-able to utilize as many libraries as possible to construct one single assembly for each species, as the large amount of data enables simultaneous expression analysis and an increase in coverage support of transcripts that may not be highly expressed under some conditions. In order to obtain the best transcriptomic profile for a given species, there is a need to integrate large amount of accumulated data together from disparate projects and create updated transcriptome assemblies as new data become available. This creates a significant challenge forde novoassembly algorithms, since computational resources are often lim-ited in individual labs while the computational time and memory requirement increase rapidly as the number of reads increases.
These computational challenges have motivated the development of algorithms that are specifically designed for performing transcriptome assembly. While algorithms such as Oases [9] and Trinity [8] aim to extract as
much information as possible, they are very memory-intensive, limiting their applications to small data sets with few libraries that biologists produce during experi-ments. Algorithms such as SOAPdenovo-Trans [10] and Trans-ABySS [11] have high memory requirements for large data sets.
To address these difficulties, our goal is to develop transcriptome assembly algorithms that recover alterna-tively spliced isoforms while utilizing as many RNA-Seq libraries as possible that contain hundreds of gigabases of data. We subdivide the computations into two stages, in which the first stage collects information from each library independently and in parallel, and the second stage merges these results together while minimizing needed computations. To reduce memory consumption so that computations can be performed on a computing cluster with moderate amount of physical memory, we develop new techniques to enumerate k-mer frequencies in the first stage. We impose appropriate cutoffs in the sec-ond stage in order to obtain comparable or improved accuracy over existing algorithms. This strategy supports incremental updates of assemblies when new libraries become available since only the second stage needs to be rerun.
We evaluate the performance of our algorithm by con-structing transcriptome assemblies using publicly avail-able libraries from model organisms, and comparing our assemblies to the ones obtained from SOAPdenovo-Trans, Trans-ABySS, Oases and Trinity. We evaluate our per-formance on non-model organisms both by obtaining publicly available libraries from the naked mole rat Het-erocephalus glaber and by constructing new RNA-Seq libraries for the blow flyChrysomya rufifacies.
Methods
De Bruijn graph
Given a set of reads and a parameterk, a de Bruijn graph is defined by taking eachk-mer that appears within the reads as a vertex. Twok-merss1s2· · ·sk ands2· · ·sksk+1
are connected by a directed edge if the (k + 1)-mer s1s2· · ·sksk+1appears in the reads and the(k−1)-suffix of
the firstk-mer is the same as the(k−1)-prefix of the sec-ondk-mer, wheres1andsk+1can be arbitrary letters. By
linking together the samek-mer that appears in different reads, the de Bruijn graph can be used to implicitly assem-ble these reads [12, 13]. Since the size of the de Bruijn graph depends on the number of distinct k-mers from the reads that is often much smaller than the total size of reads, this strategy is especially suitable for assembling high-throughput sequencing data [2, 3, 5–7].
Independent computation ofk-mer frequencies
While most existing short read assembly algorithms use hashing techniques [5, 8, 14] or suffix arrays [15] to
enumerate k-mer frequencies, the memory requirement per k-mer can be high with large multiplicative con-stants. While techniques such as sparse hashing (http:// code.google.com/p/google-sparsehash) or entropy-based compression [16] can be used to reduce the memory overhead per k-mer, there is a need to handle colli-sions and the memory requirement can still be high. Recently, two algorithms DSK [17] and KMC [18] were developed based on disk-based partitioning of the k -mer space, which allow the user to specify a memory consumption limit.
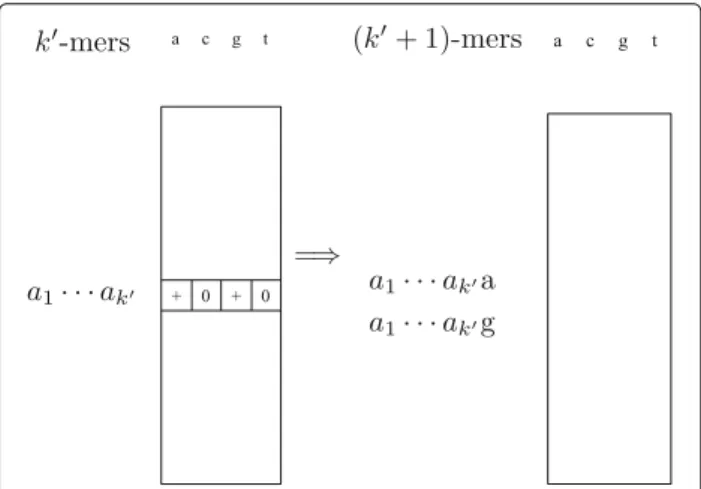
We consider the following iterative algorithm to enu-meratek-mer frequencies independently for each library (see Fig. 1). At the start of each iteration, we assume that a list of allk-mers that appear in the library in either the forward or the reverse complementary direction are given in sorted order for k < k. This list can be represented by encoding each nucleotide by two bits and using a 64-bit or 128-64-bit integer to encode eachk-mer. Suppose that there arensuchk-mers. We create an array of size 4nthat contains four slots for eachk-mer. We use it to count the number of each(k +1)-mer that appears in the library by using binary search to find the location of itsk-prefix within the array and updating one of the four slots that corresponds to its last nucleotide. At the end of the itera-tion, we remove slots with zero counts to obtain a list of all(k+1)-mers.
To make sure that each edge in the de Bruijn graph corresponds to a(k+1)-mer that appears in the library, we repeat this procedure until the frequencies of (k + 1)-mers are obtained and store all k-mer frequencies along with edge information. To reduce computational time, we start the process with a moderate value of k (between 10 to 15) by assuming that allk-mers appear
Fig. 1Illustration of the iterative algorithm to enumeratek-mer frequencies. For thek-mera1· · ·ak, its two frequency slots with zero
in the library. One advantage of this procedure is that the memory requirement perk-mer is low with a multi-plicative constant of four. When multiple assemblies with different values ofkare needed, frequencies with smaller values of k for one assembly can be used to obtain fre-quencies with larger values of k for another assembly. This significantly reduces the computational time over all values ofk.
Construction of de Bruijn graph
Given a list of allk-mer frequencies in sorted order for each library, we combine these lists by performing a merge sort and adding the corresponding frequencies for each k-mer. We exclude a k-mer from the de Bruijn graph if its frequency is less than a given k-mer coverage cutoff c. This strategy is different from the one employed by other short read assembly algorithms such as Velvet [5] or ABySS [6], which apply the cutoff after constructing the de Bruijn graph and removing redundant paths that are of less support. Since our results show that there is a need to increase the values ofkandcto obtain good performance as the size of the data set increases, our strategy keeps the size of the de Bruijn graph manageable. Edges in the de Bruijn graph are constructed by linking together adjacent k-mers through binary search. After the initial construc-tion of the de Bruijn graph, each linear path that contains a maximal succession of vertices with no branches is collapsed into a single node. While the entire merging process needs to be run sequentially for each given set-ting of k andc, different settings ofk andccan be run in parallel.
Construction of splicing graphs
To simplify the de Bruijn graph, we remove short tips that may correspond to sequencing errors by iteratively removing end nodes with sequence length less than 2k. We follow the strategy in [19] to obtain splicing graphs from the de Bruijn graph so that each splicing graph mostly represents alternatively spliced variants of only
one gene, with new strategies to handle paired-end reads. Note that this strategy is different from algorithms that construct a set of predicted transcripts from the de Bruijn graph [8–11].
In order to remove obvious SNPs that create branches in the graph, we search for split-then-merge branching structures in which all the branches from a node merge immediately into a single node and the sequences associ-ated with each branch are of the same length with very few mismatches. Successive split-then-merge structures are merged into a single node.
For each paired-end read, we identify the node u in the collapsed de Bruijn graph in which the last k-mer of the forward read resides and the node v in which the first k-mer of the reverse read resides, and increase the frequency count of the paired edge u → vby one. We repeat this procedure over all paired-end reads and retain all paired edges that have frequency counts above a given cutoff c2 that is proportional to the total
num-ber of bases in the data set. The resulting de Bruijn graph contains two types of edges, including normal edges and paired edges.
Our results show that there is always a big tangle in the de Bruijn graph that contains a large number of nodes within a single connected component, while most of the other tangles are much smaller. In order to address these tangles, we decompose each connected component into strongly connected components, in which each strongly connected component is either just a single edge or a maximal subgraph with each node reachable from all other nodes. The regions within a strongly connected component that are not just a single edge represent the complicated regions that always contain a cycle, while the other regions represent the simpler regions in which each connected region is likely to belong to the same gene. With the assumption that the reads are not strand-specific, it is also possible to have forward-backward tangles in which a connected component contains both a forward node and its corresponding backward node
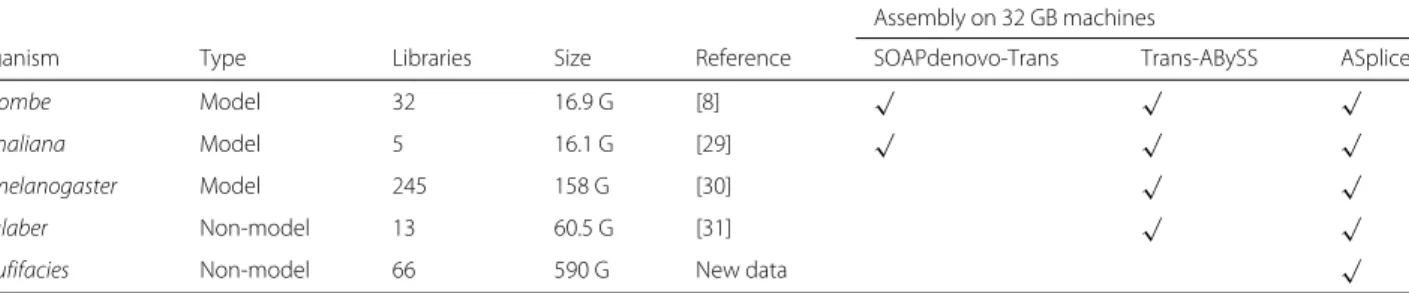
Table 1Data sets used in the evaluation of transcriptome assembly, with organism denoting the organism, type denoting whether the organism is model or non-model, libraries denoting the total number of libraries, size denoting the total number of bases in all the reads after quality trimming, reference denoting the publication that describes the libraries, and tick marks within assembly on 32 GB machines denoting the algorithms that can be used for assembly on machines with 32 GB physical memory
Assembly on 32 GB machines
Organism Type Libraries Size Reference SOAPdenovo-Trans Trans-ABySS ASplice
S. pombe Model 32 16.9 G [8] √ √ √
A. thaliana Model 5 16.1 G [29] √ √ √
D. melanogaster Model 245 158 G [30] √ √
H. glaber Non-model 13 60.5 G [31] √ √
in the reverse complementary direction. Both of these structures can be identified by using depth-first search with time complexity that is linear in the size of the graph.
We extract the strongly connected components that are not just a single edge and all the forward-backward tan-gles. We ignore the junction information within these subgraphs, and treat each node as an individual splic-ing graph that consists only of a ssplic-ingle node. We remove these nodes along with their adjacent edges, and extract each connected component in the remaining graph as a splicing graph that does not contain cycles. We remove the overlapping sequence fragments within the nodes
that arise according to the definition of a de Bruijn graph, and make the junction locations precise in obvi-ous cases when a node does not have multiple incom-ing edges and multiple outgoincom-ing edges at the same time. We retain one of the two possible orientations for each splicing graph. Only splicing graphs with length (in nucleotides) of the longest path of at least 100 are retained.
In order to study expression of nodes in a splicing graph, we incorporate thede novoexpression measure of number of reads per kilobase of node per million reads (RPKM) developed in [19]. This measure is similar to the num-ber of reads per kilobase of exon per million mapped
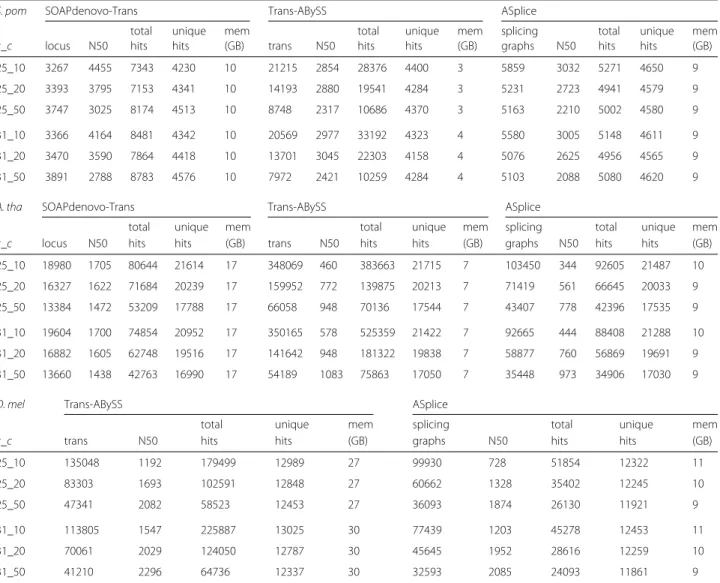
Table 2Comparisons of transcriptome assemblies of SOAPdenovo-Trans, Trans-ABySS and ASplice in model organisms over different values ofkandk-mer coverage cutoffc
S. pom SOAPdenovo-Trans Trans-ABySS ASplice
total unique mem total unique mem splicing total unique mem k_c locus N50 hits hits (GB) trans N50 hits hits (GB) graphs N50 hits hits (GB)
25_10 3267 4455 7343 4230 10 21215 2854 28376 4400 3 5859 3032 5271 4650 9
25_20 3393 3795 7153 4341 10 14193 2880 19541 4284 3 5231 2723 4941 4579 9
25_50 3747 3025 8174 4513 10 8748 2317 10686 4370 3 5163 2210 5002 4580 9
31_10 3366 4164 8481 4342 10 20569 2977 33192 4323 4 5580 3005 5148 4611 9
31_20 3470 3590 7864 4418 10 13701 3045 22303 4158 4 5076 2625 4956 4565 9
31_50 3891 2788 8783 4576 10 7972 2421 10259 4284 4 5103 2088 5080 4620 9
A. tha SOAPdenovo-Trans Trans-ABySS ASplice
total unique mem total unique mem splicing total unique mem k_c locus N50 hits hits (GB) trans N50 hits hits (GB) graphs N50 hits hits (GB)
25_10 18980 1705 80644 21614 17 348069 460 383663 21715 7 103450 344 92605 21487 10
25_20 16327 1622 71684 20239 17 159952 772 139875 20213 7 71419 561 66645 20033 9
25_50 13384 1472 53209 17788 17 66058 948 70136 17544 7 43407 778 42396 17535 9
31_10 19604 1700 74854 20952 17 350165 578 525359 21422 7 92665 444 88408 21288 10
31_20 16882 1605 62748 19516 17 141642 948 181322 19838 7 58877 760 56869 19691 9
31_50 13660 1438 42763 16990 17 54189 1083 75863 17050 7 35448 973 34906 17030 9
D. mel Trans-ABySS ASplice
total unique mem splicing total unique mem
k_c trans N50 hits hits (GB) graphs N50 hits hits (GB)
25_10 135048 1192 179499 12989 27 99930 728 51854 12322 11
25_20 83303 1693 102591 12848 27 60662 1328 35402 12245 10
25_50 47341 2082 58523 12453 27 36093 1874 26130 11921 9
31_10 113805 1547 225887 13025 30 77439 1203 45278 12453 11
31_20 70061 2029 124050 12787 30 45645 1952 28616 12259 10
31_50 41210 2296 64736 12337 30 32593 2085 24093 11861 9
The predicted units are locus for SOAPdenovo-Trans that is represented as a splicing graph containing nodes and edges, transcript (trans) for Trans-ABySS that is a linear concatenation of constituent nodes, and splicing graph for ASplice. For SOAPdenovo-Trans and ASplice, N50 denotes the N50 value of the length (in nucleotides) of the longest path in each splicing graph. For Trans-ABySS, N50 denotes the N50 value of the length of a predicted transcript, and only predicted transcripts of length at least 100 are retained. Total hits denotes the total number of hits from nucleotide BLAST search of nodes to the transcriptome of the same organism. Isoforms are considered to be the same gene. Only the top hit withE-value below 10−7is considered. Hits from nodes within the same predicted unit to the same gene are counted only once. Unique hits
reads used by [20] and [21], except that reads that appear in the assembly are used instead of mapped reads, and each node in a splicing graph is evaluated instead of each exon, with each read that contains ak-mer within a node contributing to that node. Within each node, a RPKM esti-mate is computed independently for each library. Alterna-tively, measures similar to transcripts per million (TPM) [22] can be used, which are more comparable across libraries.
In order to make the results directly applicable to down-stream analysis, we represent each assembly in an anno-tated FASTA format, in which each splicing graph is given as a collection of nodes, with connecting normal and paired edges and RPKM values for each library embed-ded within the name of each node. Since it is possible to have empty nodes that do not contain any nucleotide after adjustment of junction locations, RPKM values are
computed before junction adjustment to reflect the orig-inal coverage values across a branch. Such empty nodes correspond to additional isoforms that skip nodes (e.g., exons) within a branch.
Results and discussion
Model organisms
To compare the performance of our algorithm ASplice to other algorithms, we extracted reads from publicly available RNA-Seq libraries in model organisms Schizosaccharomyces pombe, Arabidopsis thaliana and Drosophila melanogaster (see Table 1). We trimmed each read by removing all positions including and after the first position that has a quality score of less than 15. We applied our algorithm to obtain a de Bruijn graph for a given k-mer length and a given k-mer cov-erage cutoff c. We compare the performance of our
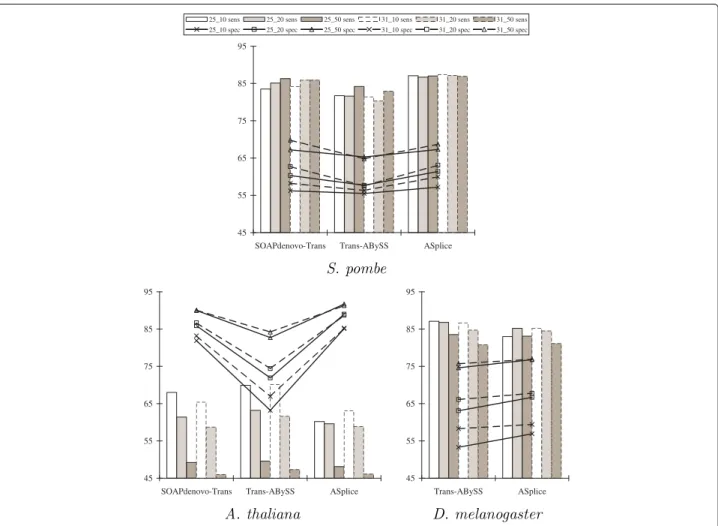
25_10 sens 25_20 sens 25_50 sens 31_10 sens 31_20 sens 31_50 sens
25_10 spec 25_20 spec 25_50 spec 31_10 spec 31_20 spec 31_50 spec
45 55 65 75 85 95
SOAPdenovo-Trans Trans-ABySS ASplice
45 55 65 75 85 95
SOAPdenovo-Trans Trans-ABySS ASplice
45 55 65 75 85 95
Trans-ABySS ASplice
algorithm ASplice to SOAPdenovo-Trans and Trans-ABySS on machines with 32 GB physical memory (except for D. melanogaster, in which there is not sufficient memory to run SOAPdenovo-Trans). Nucleotide BLAST search is applied to the transcriptome of the same organ-ism to evaluate the performance. Since each algorithm returns different structures, note that the results are not completely comparable.
Table 2 shows that while there were performance trade-offs among different values ofkand thek-mer coverage cutoffc, SOAPdenovo-Trans and Trans-ABySS generally recovered longer transcript structures and more genes in the transcriptome (except forS. pombe, in which ASplice recovered more genes).
Figure 2 shows that ASplice had higher specificity with respect to the percentage of predicted positions that are included in the top BLAST alignments. ASplice also often had comparable sensitivity with respect to the percent-age of nucleotide positions in the transcriptome that are recovered through the top BLAST alignments, especially for larger values of thek-mer coverage cutoffcwhen the assembly conditions are more stringent, and had higher sensitivity forS. pombe.
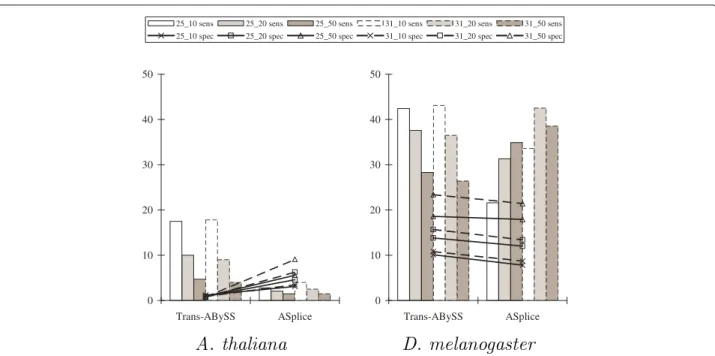
Figure 3 further shows that, with respect to alterna-tive splicing junctions that are derived from the splicing
graphs and annotated positions of the gene transcripts, ASplice was often more conservative, and could have higher sensitivity when the assembly conditions are more stringent (no comparisons were made to SOAPdenovo-Trans since its assemblies often contain many gap posi-tions around juncposi-tions, making comparisons difficult). The poor performance with respect to alternative splicing junctions inA. thalianais due to the relatively small size of the data set.
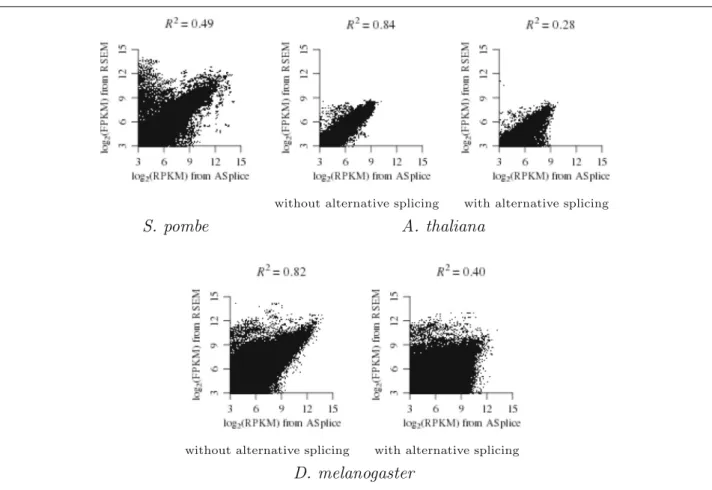
Figure 4 shows that our de novo expression estimates were highly correlated to the ones obtained from apply-ing RSEM [22] to map the reads in each library to the transcriptome of the same organism, with 0.49 ≤ R2 ≤
0.84 for gene transcripts without alternative splicing and 0.28 ≤ R2 ≤ 0.40 for gene transcripts with alternative
splicing, where R2 denotes the coefficient of
determina-tion that measures how well the data fit a regression line. The lowerR2in the latter case is probably due to higher assembly difficulties.
In terms of memory requirement, Table 2 shows that while SOAPdenovo-Trans and Trans-ABySS had large increases as the size of the data set increases (compare to Table 1), ASplice had a large fixed memory overhead for all data sets with small increases for larger data sets. Since each library can be further subdivided into multiple parts
25_10 sens 25_20 sens 25_50 sens 31_10 sens 31_20 sens 31_50 sens 25_10 spec 25_20 spec 25_50 spec 31_10 spec 31_20 spec 31_50 spec
0 10 20 30 40 50
Trans-ABySS ASplice
0 10 20 30 40 50
Trans-ABySS ASplice
Fig. 4Regression in log scale of thede novoRPKM values from the 25_10 assembly (withk=25 andk-mer coverage cutoffc=10) of ASplice against the FPKM values from RSEM over all libraries. The gene transcript that corresponds to each node from ASplice is identified through a bi-directional nucleotide BLAST alignment of length at least 100 to the transcriptome of the same organism. Nodes that have no correspondences are ignored. ForA. thalianaandD. melanogaster, regressions are performed separately on gene transcripts without alternative splicing and on gene transcripts with alternative splicing
to reduce memory requirement during the parallel stage of ASplice, the maximum memory consumption is obtained during the sequential stage, in which the main structure to store is the de Bruijn graph after thek-mer coverage cutoff cis applied.
Non-modelHeterocephalus glaber
We also assess the performance of our algorithm in the non-model naked mole rat Heterocephalus glaber (there is not sufficient memory to run SOAPdenovo-Trans on machines with 32 GB physical memory for this data set). Table 3 shows that large values of the k-mer coverage cutoff c were needed to obtain rea-sonable assemblies due to the large size of the data set (see also Table 1). Similar trends were observed as before when translated BLAST search to the rat Rattus norvegicus is applied, with ASplice recovering more genes when the assembly conditions are more stringent.
Non-modelChrysomya rufifacies
We applied our algorithm to assemble the transcriptome of the blow flyChrysomya rufifaciesfrom a set of RNA-Seq libraries that we have constructed, which includes the following developmental stages: embryos, first instar lar-vae, second instar larlar-vae, predator and non-predator third instar larvae, early pupae, mid pupae, late pupae, thely-genic and arrhenothely-genic adult females, and adult males. There are totally 66 libraries with 6.8 G reads and average read length 86 after quality trimming.
Table 3Comparisons of transcriptome assemblies of Trans-ABySS and ASplice in the naked mole ratH. glaberover different values ofk
andk-mer coverage cutoffc
H. gla Trans-ABySS ASplice
R. nor unique mem splicing R. nor unique mem
k_c trans N50 hits hits (GB) graphs N50 hits hits (GB)
25_50 97640 970 40391 13592 19 110379 533 35671 13056 9
25_100 62495 714 34433 11758 19 71037 445 30442 11558 9
25_200 37371 527 24940 9059 19 42666 359 21515 9371 9
31_50 91149 987 38346 13415 20 116375 457 38271 12900 9
31_100 59730 695 33864 11510 20 73734 381 31369 11356 9
31_200 35292 503 24404 8703 20 42180 320 21110 9084 9
Notations are the same as in Table 2 except that translated BLAST search (toR. norvegicus) is performed instead of nucleotide BLAST search
male-eye phenotype that is hypothesized to have evolved multiple times in concert with human civilization [26]. Genomic tools for this blow fly enable the study of the evolution of sex determination and co-evolution with humans.
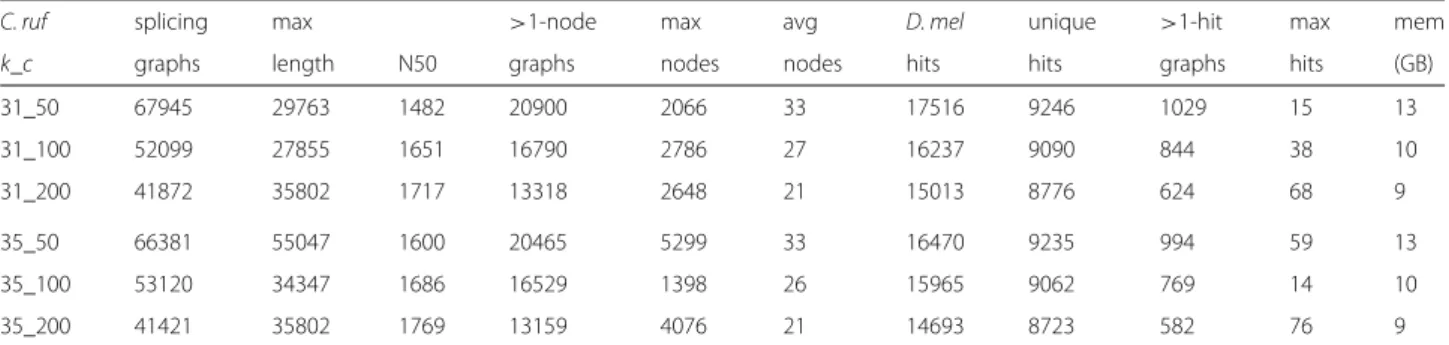
Since there is not sufficient memory to run either SOAPdenovo-Trans or Trans-ABySS on machines with 32 GB physical memory for this large data set with 590 G bases, we only run ASplice, which allows computations to be performed on a computing cluster due to its low mem-ory requirements. We considered larger values of kand further subdivided large libraries into multiple parts dur-ing the parallel stage. Table 4 shows that the assemblies were of high quality, with long splicing graphs, moder-ate amount of branches that may represent alternative splicing, and over 60% of theD. melanogastergenes recov-ered. The ratio of the total number of BLAST hits from different splicing graphs to the number of unique BLAST hits to different genes was between 1.5 to 2, indicating a small amount of sequence fragmentation of the same gene into different splicing graphs. There were only a small number of splicing graphs that have BLAST hits to more than one gene, and the maximum number of different
genes that have BLAST hits to a splicing graph was small, thus each splicing graph specifies the alternatively spliced variants of one gene in most cases.
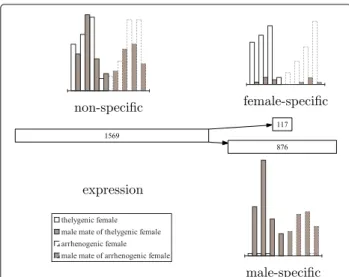
By comparing to the D. melanogaster homologs of assembled nodes (see Fig. 5), we found expected alter-native splicing in thedoublesexgene and consistent bias of expression within female-specific (upper right node of length 117) and male-specific (lower right node of length 876) segments and between thelygenic and arrhenogenic females (with generally higher expression within thely-genic females in the upper right node).
SmallDrosophila melanogasterlibraries
Since Oases and Trinity are very memory-intensive, we assess their performance by extracting reads from a small set of three D. melanogaster RNA-Seq libraries in [27] at the sequence read archive [28] that includes the following developmental stages: 2–16 hours embryos (SRR058885), third instar larvae (SRR059066), and mixed pupae (SRR042298). These libraries have 1.8 G bases after quality trimming, andkis fixed to 25.
Table 5 shows that Oases had the longest assemblies and recovered the largest number of genes. While ASplice had
Table 4Transcriptome assemblies of ASplice in the blow flyC. rufifaciesover different values ofkandk-mer coverage cutoffc
C. ruf splicing max >1-node max avg D. mel unique >1-hit max mem
k_c graphs length N50 graphs nodes nodes hits hits graphs hits (GB)
31_50 67945 29763 1482 20900 2066 33 17516 9246 1029 15 13
31_100 52099 27855 1651 16790 2786 27 16237 9090 844 38 10
31_200 41872 35802 1717 13318 2648 21 15013 8776 624 68 9
35_50 66381 55047 1600 20465 5299 33 16470 9235 994 59 13
35_100 53120 34347 1686 16529 1398 26 15965 9062 769 14 10
35_200 41421 35802 1769 13159 4076 21 14693 8723 582 76 9
Fig. 5A splicing graph in the 31_200 assembly (withk=31 and k-mer coverage cutoffc=200) of ASplice in the blow flyC. rufifacies that is related to thedoublesexgene inD. melanogaster. Each node is represented by a rectangle of width that is proportional to (and labeled by) the length of its sequence. The histogram adjacent to each node gives the RPKM values for each adult library, with each light bar and the dark bar to its right denoting an adult female and its mate (an adult male) respectively. The left half of each histogram (marked by solid bars) denotes thelygenic females and their mates, while the right half of each histogram (marked by dashed bars) denotes arrhenogenic females and their mates
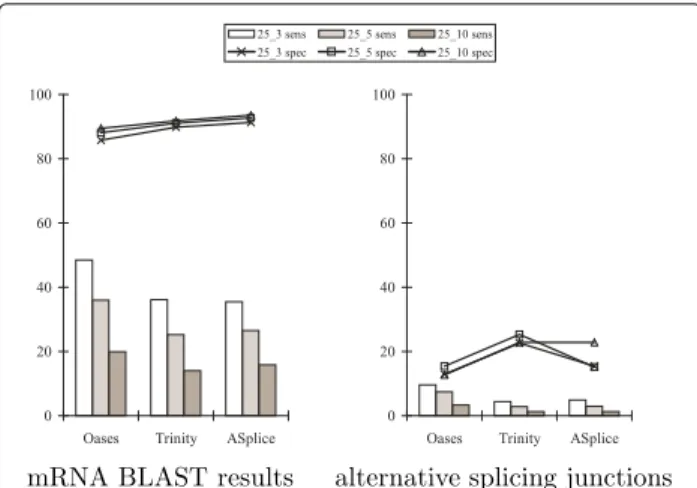
longer assemblies than Trinity, Trinity recovered more genes. Figure 6 shows that ASplice had slightly higher specificity at the expense of lower sensitivity with respect to recovered mRNA positions, and had higher speci-ficity with respect to alternative splicing junctions when the assembly conditions are more stringent. Sensitivity was low for all algorithms due to the small size of the data set. When compared to the results on the largeD. melanogaster data set, this shows that as many libraries as possible should be utilized to obtain a more complete transcriptome, justifying the use of our scalable algorithm when possible.
Conclusions
We have developed an algorithm forde novo transcrip-tome assembly of non-model organisms that utilizes a large amount of RNA-Seq libraries in order to obtain a transcriptome that is as complete as possible, while simul-taneously extracting alternative splicing information and expression levels in different libraries. When compared to existing algorithms, our algorithm is more conservative and generally has higher specificity at the expense of lower sensitivity, but is able to utilize larger amount of data to obtain more complete assemblies. As the size of the data set increases, larger values ofkand usually much larger values of thek-mer coverage cutoffcare needed to obtain reasonable assemblies.
Since large libraries can be further subdivided into mul-tiple parts during the parallel stage, our algorithm is scalable and the parallel stage can be run on different computing nodes. Since our k-mer counting technique requires iterating over every read and performing binary search repeatedly over increasing values of k, our algo-rithm is generally much more computationally intensive than existing algorithms, although our memory require-ment is much lower for large data sets. Our strat-egy is especially suitable when multiple assemblies with different values of k are desired, as our algorithm is based on processing iteratively larger values ofk. Incre-mental updates of assemblies are easy to perform, as it is only necessary to run the parallel stage on the new libraries before running the sequential stage on all libraries. Such a strategy is especially important to iteratively obtain more complete transcriptome assem-blies over time through collaboration across research communities.
For small to medium data sets, it takes a few hours to a few days to complete the parallel stage over all values ofk as long as the libraries are subdivided into small enough parts. The time to finish the sequential stage ranges from a few hours for a small data set to one to two days for a larger data set. For our largestC. rufifaciesdata set with 590 G bases, it takes a few days to finish the parallel stage over all values ofkwhen the libraries are subdivided into parts with about 10 G bases each, with each computing
Table 5Comparisons of transcriptome assemblies of Oases, Trinity and ASplice on a smallD. melanogasterdata set withk=25 and over different values ofk-mer coverage cutoffc
D. mel Oases Trinity ASplice
(small) total unique mem total unique mem splicing total unique mem
k_c locus N50 hits hits (GB) locus N50 hits hits (GB) graphs N50 hits hits (GB)
25_3 32277 748 46371 11311 26 50656 264 48079 9987 12 31949 305 30423 9560 9
25_5 21246 880 28366 9930 20 35797 254 34487 8412 12 20533 335 20061 8043 9
25_10 11509 842 15489 7075 18 20281 245 19759 5946 12 11243 338 11149 5722 9
Fig. 6Sensitivity and specificity comparisons of Oases, Trinity and ASplice with respect to mRNA BLAST results and alternative splicing junctions on a small set of libraries fromD. melanogasterwithk=25 and over different values ofk-mer coverage cutoffc(represented by k_c). Notations are the same as in Figs. 2 and 3
process consuming less than 14 GB memory. For each given setting ofkand thek-mer coverage cutoffc, it takes a few days to finish the sequential stage. With values ofc between 50 and 200 in our largestC. rufifaciesdata set, the memory consumption is less than 14 GB. Thus, our algorithm can assemble large data sets on a computing cluster with moderate resources.
Acknowledgements
We thank the reviewers for suggestions that significantly improve the paper. Sequencing was performed at the High-Throughput Sequencing Facility of the University of North Carolina at Chapel Hill and the Genomics and Bioinformatics Services at Texas A&M University. Computations were performed on the Whole Systems Genomics Initiative Cluster and the Brazos Cluster at Texas A&M University.
Funding
This work was supported in part by the National Institute of Justice [2012-DN-BX-K024]. AMT is supported by start-up funds from the College of Agriculture and Life Sciences at Texas A&M University and Texas AgriLife Research.C. rufifaciessequencing was funded by the Whole Systems Genomics Initiative Catalyst and Texas AgriLife Genomics Seed grants. Points of view in this document are those of the authors and do not necessarily represent the official position or policies of the U.S. Department of Justice. Publication costs for this work were funded by the Open Access to Knowledge (OAK) Fund at the Texas A&M University Libraries.
Availability of data and materials
A software program that implements our algorithm (ASplice) is available at http://faculty.cse.tamu.edu/shsze/asplice. The newly constructedChrysomya rufifaciesRNA-Seq libraries are available at the sequence read archive (SRP013354, SRP059603, SRP059612, SRP106565).
Authors’ contributions
S-HS and AMT designed the computational work. MLP, JKT and CDJ designed the molecular experiments. All authors read and approved the final manuscript.
Competing interests
The authors declare that they have no competing interests.
Consent for publication
Not applicable.
Ethics approval and consent to participate
Not applicable.
About this supplement
This article has been published as part of BMC Genomics Volume 18 Supplement 4, 2017: Selected articles from the Fifth IEEE International Conference on Computational Advances in Bio and Medical Sciences (ICCABS 2015): Genomics. The full contents of the supplement are available online at http:dx.doi.org/https:bmcgenomics.biomedcentral.com/articles/
supplements/volume-18-supplement-4.
Publisher’s Note
Springer Nature remains neutral with regard to jurisdictional claims in published maps and institutional affiliations.
Author details
1Department of Computer Science and Engineering, Texas A&M University,
College Station, TX 77843, USA.2Department of Biochemistry & Biophysics,
Texas A&M University, College Station, TX 77843, USA.3Department of
Entomology, Texas A&M University, College Station, TX 77843, USA.
4Department of Biology, University of North Carolina at Chapel Hill, Chapel Hill,
NC 27599, USA.
Published: 24 May 2017
References
1. Dohm JC, Lottaz C, Borodina T, Himmelbauer H. SHARCGS, a fast and highly accurate short-read assembly algorithm forde novogenomic sequencing. Genome Res. 2007;17:1697–706.
2. Butler J, MacCallum I, Kleber M, Shlyakhter IA, Belmonte MK, Lander ES, Nusbaum C, Jaffe DB. ALLPATHS:de novoassembly of whole-genome shotgun microreads. Genome Res. 2008;18:810–20.
3. Chaisson MJ, Pevzner PA. Short read fragment assembly of bacterial genomes. Genome Res. 2008;18:324–30.
4. Hernandez D, François P, Farinelli L, Østerås M, Schrenzel J.De novo
bacterial genome sequencing: millions of very short reads assembled on a desktop computer. Genome Res. 2008;18:802–9.
5. Zerbino DR, Birney E. Velvet: algorithms forde novoshort read assembly using de Bruijn graphs. Genome Res. 2008;18:821–9.
6. Birol I, Jackman SD, Nielsen CB, Qian JQ, Varhol R, Stazyk G, Morin RD, Zhao Y, Hirst M, Schein JE, Horsman DE, Connors JM, Gascoyne RD, Marra MA, Jones SJM.De novotranscriptome assembly with ABySS. Bioinformatics. 2009;25:2872–77.
7. Li R, Zhu H, Ruan J, Qian W, Fang X, Shi Z, Li Y, Li S, Shan G, Kristiansen K, Li S, Yang H, Wang J, Wang J.De novoassembly of human genomes with massively parallel short read sequencing. Genome Res. 2010;20:265–72. 8. Grabherr MG, Haas BJ, Yassour M, Levin JZ, Thompson DA, Amit I,
Adiconis X, Fan L, Raychowdhury R, Zeng Q, Chen Z, Mauceli E, Hacohen N, Gnirke A, Rhind N, di Palma F, Birren BW, Nusbaum C, Lindblad-Toh K, Friedman N, Regev A. Full-length transcriptome assembly from RNA-Seq data without a reference genome. Nat Biotechnol. 2011;29:644–52.
9. Schulz MH, Zerbino DR, Vingron M, Birney E. Oases: robustde novo
RNA-seq assembly across the dynamic range of expression levels. Bioinformatics. 2012;28:1086–92.
10. Xie Y, Wu G, Tang J, Luo R, Patterson J, Liu S, Huang W, He G, Gu S, Li S, Zhou X, Lam TW, Li Y, Xu X, Wong GK-S, Wang J.
SOAPdenovo-Trans:de novotranscriptome assembly with short RNA-Seq reads. Bioinformatics. 2014;30:1660–6.
11. Robertson G, Schein J, Chiu R, Corbett R, Field M, Jackman SD, Mungall K, Lee S, Okada HM, Qian JQ, Griffith M, Raymond A, Thiessen N, Cezard T, Butterfield YS, Newsome R, Chan SK, She R, Varhol R, Kamoh B, Prabhu AL, Tam A, Zhao Y, Moore RA, Hirst M, Marra MA, Jones SJM, Hoodless PA, Birol I.De novoassembly and analysis of RNA-seq data. Nat Methods. 2010;7:909–12.
12. Pevzner PA.l-tuple DNA sequencing: computer analysis. J Biomol Struct Dyn. 1989;7:63–73.
13. Idury RM, Waterman MS. A new algorithm for DNA sequence assembly. J Comput Biol. 1995;2:291–306.
15. Kurtz S, Narechania A, Stein JC, Ware D. A new method to compute K-mer frequencies and its application to annotate large repetitive plant genomes. BMC Genomics. 2008;9:517.
16. Conway TC, Bromage AJ. Succinct data structures for assembling large genomes. Bioinformatics. 2011;27:479–86.
17. Rizk G, Lavenier D, Chikhi R. DSK:k-mer counting with very low memory usage. Bioinformatics. 2013;29:652–3.
18. Deorowicz S, Debudaj-Grabysz A, Grabowski S. Disk-basedk-mer counting on a PC. BMC Bioinforma. 2013;14:160.
19. Sze SH, Tarone AM. A memory-efficient algorithm to obtain splicing graphs andde novoexpression estimates from de Bruijn graphs of RNA-Seq data. BMC Genomics. 2014;15(Suppl 5):6.
20. Mortazavi A, Williams BA, McCue K, Schaeffer L, Wold B. Mapping and quantifying mammalian transcriptomes by RNA-Seq. Nat Methods. 2008;5:621–8.
21. Trapnell C, Pachter L, Salzberg SL. TopHat: discovering splice junctions with RNA-Seq. Bioinformatics. 2009;25:1105–11.
22. Li B, Dewey CN. RSEM: accurate transcript quantification from RNA-Seq data with or without a reference genome. BMC Bioinforma. 2011;12:323. 23. Ullerich FH, Schöttke M. Karyotypes, constitutive heterochromatin, and
genomic DNA values in the blowfly generaChrysomya,Lucilia, and
Protophormia(Diptera: Calliphoridae). Genome. 2006;49:584–97. 24. Saccone G, Pane A, Polito LC. Sex determination in flies, fruitflies and
butterflies. Genetica. 2002;116:15–23.
25. Shearman DCA. The evolution of sex determination systems in dipteran insects other thanDrosophila. Genetica. 2002;116:25–43.
26. Wells JD, Singh MM, Suzuki K, Miura M, Kurahashi H. Male eye dimorphism and synanthropy inChrysomya pinguis(Walker) (Diptera: Calliphoridae). Jpn J Sanit Zool. 1994;45:299–302.
27. Daines B, Wang H, Wang L, Li Y, Han Y, Emmert D, Gelbart W, Wang X, Li W, Gibbs R, Chen R. TheDrosophila melanogastertranscriptome by paired-end RNA sequencing. Genome Res. 2011;21:315–24. 28. Sayers EW, Barrett T, Benson DA, Bolton E, Bryant SH, Canese K,
Chetvernin V, Church DM, DiCuccio M, Federhen S, Feolo M, Geer LY, Helmberg W, Kapustin Y, Landsman D, Lipman DJ, Lu Z, Madden TL, Madej T, Maglott DR, Marchler-Bauer A, Miller V, Mizrachi I, Ostell J, Panchenko A, Pruitt KD, Schuler GD, Sequeira E, Sherry ST, Shumway M, Sirotkin K, Slotta D, Souvorov A, Starchenko G, Tatusova TA, Wagner L, Wang Y, Wilbur WJ, Yaschenko E, Ye J. Database resources of the National Center for Biotechnology Information. Nucleic Acids Res. 2010;38:5–16. 29. Marquez Y, Brown JWS, Simpson C, Barta A, Kalyna M. Transcriptome survey reveals increased complexity of the alternative splicing landscape inArabidopsis. Genome Res. 2012;22:1184–95.
30. Graveley BR, Brooks AN, Carlson JW, Duff MO, Landolin JM, Yang L, Artieri CG, van Baren MJ, Boley N, Booth BW, Brown JB, Cherbas L, Davis CA, Dobin A, Li R, Lin W, Malone JH, Mattiuzzo NR, Miller D, Sturgill D, Tuch BB, Zaleski C, Zhang D, Blanchette M, Dudoit S, Eads B, Green RE, Hammonds A, Jiang L, Kapranov P, Langton L, Perrimon N, Sandler JE, Wan KH, Willingham A, Zhang Y, Zou Y, Andrews J, Bickel PJ, Brenner SE, Brent MR, Cherbas P, Gingeras TR, Hoskins RA, Kaufman TC, Oliver B, Celniker SE. The developmental transcriptome of
Drosophila melanogaster. Nature. 2011;471:473–9.
31. Kim EB, Fang X, Fushan AA, Huang Z, Lobanov AV, Han L, Marino SM, Sun X, Turanov AA, Yang P, Yim SH, Zhao X, Kasaikina MV, Stoletzki N, Peng C, Polak P, Xiong Z, Kiezun A, Zhu Y, Chen Y, Kryukov GV, Zhang Q, Peshkin L, Yang L, Bronson RT, Buffenstein R, Wang B, Han C, Li Q, Chen L, Zhao W, Sunyaev SR, Park TJ, Zhang G, Wang J, Gladyshev VN. Genome sequencing reveals insights into physiology and longevity of the naked mole rat. Nature. 2011;479:223–7.
• We accept pre-submission inquiries
• Our selector tool helps you to find the most relevant journal
• We provide round the clock customer support
• Convenient online submission
• Thorough peer review
• Inclusion in PubMed and all major indexing services
• Maximum visibility for your research
Submit your manuscript at www.biomedcentral.com/submit