97
Supply chain design considering cellular structure and
alternative processing routings
Majid Soolaki1, Jamal Arkat1*
1Department of Industrial Engineering, University of Kurdistan, Sanandaj,
Iran
[email protected], [email protected]
Abstract
Nowadays, in highly competitive global markets and constant pressure to reduce total costs, enterprises consider group technology and Supply Chain Management (SCM) accordingly and usually separately as the key elements for intra and inter facilities improvement. Simultaneous consideration of the elements of these two disciplines in an integrated design can result in higher efficiency and effectiveness. A three-echelon supply chain that has several markets, production sites, and suppliers is designed again in this paper as a Cellular Manufacturing System (CMS). Every product can be manufactured in the CMS through alternative process routings, in which machines are likely to fail. A linear integer programming model is presented here that seeks to minimize the intercellular movement, procurement, production, and machine breakdown costs. We present a number of illustrative examples to demonstrate the effectiveness of the integrated design. The proposed examples reveal that although the procurement and logistics costs increase slightly in the integrated design, the total cost is dropped considerably.
Keywords: Supply chain management, location allocation problem, cell formation problem, alternative process routings.
1-Introduction
In the present era of globalization and liberalization, businesses are in conflict with great challenges all over the world. Their objectives include remaining competition, increasing production, reducing costs, and growing economic. Globalization has confronted businesses of the twenty-first century posing challenges regarding customers who expect non-expensive products of high quality meeting their particular, unique, and quickly changing needs. The problem of designing supply chain networks (SCNs) has gained plenty of significance in recent years, as market globalization is introducing greater competitiveness every day. Planning, manufacturing, and purchasing traditionally played their own independent roles in the supply chain. The purposes of these organizations are not only different from but often even contrary to one another. On the one hand, there are marketing purposes of high customer services and maximum sales earning, and on the other hand, the production and distribution purposes have their own functions (Jain et al., 2007; Jain, 2006; Kisomi et al., 2016).
A manufacturing business can hardly continue to grow and succeed unless global competitiveness is increased and production ability is maximized. Group Technology (GT) has been emerged in the manufacturing environment for almost six decades (Wmmerlo and Hyer, 1989).
*Corresponding author
ISSN: 1735-8272, Copyright c 2018 JISE. All rights reserved
Journal of Industrial and Systems Engineering Vol. 11, No. 1, pp. 97- 112
98
An application of GT, a Cellular Manufacturing System (CMS) is a production system where part families include similar parts by definition, and different machines are assigned to machine cells. CMS and SCM have appeared as modern methods of achievement of high competiveness. CMSs help identify families of related parts and groups of different machines.
Thus, a somehow independent cell can be used for complete analysis of the part families that are assigned to a group of machines. A manufacturing institution in today’s worldwide marketing can be successful only if the manufacturing and other functions are optimized in a sensible cooperation with each other. The companies could then use an integrated method to benefit from this by addressing SC design and CMS design (Rasti-Barzoki and Hejazi, 2015; Schaller, 2008).
A novel mathematical model is developed here for incorporating CMSs into SC systems with an extensive coverage of raw material preparation, production and distribution features, by considering multiple suppliers, multiple production locations, multiple markets, and alternative process routings (APR).
Recent increases in global competition has caused demands for product mixes that are mid-volume and mid-variety more popular, and products’ life cycles have decreased. Meeting such needs requires job shops and flow lines to be more efficient and flexible than they are. The significance of meeting such production requirements accounts for the emergence of GT, which has obtained desirable results. The only way that firms can increase CMS benefits is to make strategic decisions on the basis of results obtained from models describing their structural and operational features accurately (Arkat et al., 2012; Ahkioon et al., 2009; Defersha and Chen, 2006; Balakrishnan and Cheng, 2005 ).
Many researchers in the field of CMSs have offer the mathematical models with only one process routing for each part, in which only one machine is also used for performing every operation or set of operations. Alternative process routings (APR) can greatly enhance the block diagonalization process (Mohammadi and Forghani, 2014). A non-linear binary integer programming model was presented by Kasilingam and Lashkari (1991) for machine and part grouping, while there are alternate routings at the same time. Bhide et al. (2005) used alternate process plans for development of a new cell formation model. A new 0-1 mathematical model was proposed by Jabal Ameli et al. (2008) for the CF problem on the basis of APR and machine reliability. Formulating a binary integer programming model, they solved the model with a mathematical programming model approach. Based on a similarity coefficient, an efficient tabu search (TS) algorithm was suggested by Chung et al. (2011) for solving the Jabal Ameli et al. (2008) model. They made significant progress in the run time. They reported that a problem that took about 3 hours to be solved by a mathematical approach was optimally solved in less than two seconds by their TS algorithm.
A manufacturing institution can be successful in today’s worldwide market only if manufacturing and other functions are optimized in a sensible cooperation with one another. This links purchasing, distribution, planning and manufacturing together in an institution’s overall manufacturing and SC operation. As a result, an institution often has a distributed structure, where manufacturing/supply units are dealt with at different locations and geographical sites. There are few studies that incorporate CMS into SC design. There are few studies that incorporate CMS into SC design. By reviewing the literature on the incorporation of CMS into SC, the integrated approaches are classified into two broad categories:
the integrated design for CMS into SC which forms cells in each production facility (e.g. Saxena and Jain, 2012)
the integrated design for CMS into SC choosing production facility locations and forming cells in the chosen locations (e.g. Schaller, 2008).
With regard to the identification of the requirements of CMS and SCM integration, Rao and Mohanty (2003) illustrated interrelationships of CMS and SC design issues through an example. They demonstrated that cell design can affect production facility location, raw material procurement, and finished goods distribution. They did not present a mathematical model, however. Schaller (2008) presented a new mathematical model with multiple production facilities and multiple markets to adopt an integrated method for addressing the problems of facility location, allocation of market demand to facilities, and cellular manufacturing system design within every facility. They took into account in their model the cost of establishing a production facility at site, production, machines, and product transportation from production facilities to markets. In order to present an integrated DCMS and SC
99
design model, Saxena and Jain (2012) considered multi-plant locations, multiple markets, multi-time periods, reconfiguration, and other such issues. They also solved their model utilizing both ordinary and hybrid artificial immune systems. Table 1 classifies studies mentioned in the literature based on integration of the CMS and SCM models.
Table 1. List of papers involving the integration of the CMS and SCM model
Author (s) Attributes
(1) (2) (3) (4) (5) (6) (7) (8) (9)
Rao and Mohanty (2003) * * * * *
Schaller (2008) * * * * *
Saxena and Jain (2012) * * * * *
Aalaei and Davoudpour (2016a) * * * * * *
Aalaei and Davoudpour (2016b) * * * * * *
Ourmodel * * * * * * * *
(1) Multiple processing routes (2) Mathematical model (3) Supplier Selection (4) Multiple production facilities (5) Multiple markets (6) Multi-time periods (7) Establishment of a production facility (8) Inbound logistic costs (9) Outbound logistic costs
As was mentioned, the inbound logistics cost of parts and raw materials are considerably affected by procurement of raw material from suppliers. In Rao and Mohanty’s (2003) words, there are trade-offs between three parameters: inbound logistics costs, part family formation for achievement of GT advantages, and competitive cell location for production cost reduction. In view of the previous works summarized above, it could be useful to incorporate the multi-supplier problems and procurement of raw materials in the integration of CMS and SCM. To make up for these gaps, the CMS, SCM and sourcing decisions for each production facility are integrated in the proposed model.
The structure of the rest of the paper is as follows. In Section 2, a review of literature is provided to identify CMS and its integration into SC design. In Section 3, we present our approach to modelling CMS into the SC system, and we provide the assumptions and notations of our model. Then, in Section 4, Section 4, computational results, parameters, and solutions generated by the mathematical model are given. Finally, the conclusions and directions for further research are provided in Section 5.
2-Mathematical model
The present paper proposes a novel mathematical model to solve the generalized CFP integrated into the SC network. The proposed model aims at minimizing intercellular movement, procurement costs, production costs, inbound logistics costs, outbound logistics costs, amortized fixed costs of establishing production facilities, amortized costs of machines, and machine breakdown costs. As far as we are aware, this research is the first to simultaneously consider all these design features. The model presented in this study is an extended version of two models. The first model was proposed by Jabal Ameli et al. (2008) and Chung et al. (2011), who formulated a binary integer programming model for the CFP accounting for APR and the issue of machine reliability. They used a mathematical programming method to solve the model. The second integrated model was proposed by Schaller (2008), the advantages of which include: (1) considering multiple plants/multiple markets, (2) considering the production network, and (3) considering the establishment cost in view of the locations that are assigned to cells. The proposed model includes one objective function with four terms: term 1 indicates the production and machine costs, term 2 indicates the procurement costs, term 3 denotes the distribution costs, and term 4 presents the establishment costs. Here, the proposed model is assumed to include seven objective terms: intercellular movement cost, machine breakdown cost, amortized cost of machines, production cost, raw material procurement for manufacturing, distribution costs and establishing production facilities. In developing the proposed model, the following assumptions and limitations were established:
In every process routing, the machine sequence is the same as the operation sequence of the part corresponding to it.
100
A set of machines that a given part passes are referred to as a process routing for the part.
The value of annual demand for every product in every market is given.
The processing time of every part type on every type of machine is given.
The cost of shipping products from production facilities to markets is given.
The cost of shipping raw materials from suppliers to production facilities is known.
The annual amortized fixed cost for the establishment of every production facility at each site is given.
The production cost of a product unit within a cell is regarded as a step function of the number of product types that are produced within that cell.
All demands must be satisfied during the planning horizon.
The sets, parameters and decision variables of the model are listed below:
Sets
= { 1, 2, … , } index set of markets
= { 1, 2, … , } index set of suppliers
= { 1, 2, … , } index set of facility locations
= { 1, 2, … , } index set of cells in each facility location
= {1, 2, … , } index set of parts
= { 1, 2, … , } index for routing of part
= { 1, 2, … , } index set of machines
= { 1, 2, … , } index set of cell sizes.
Parameters
Available time for a machine of type
Maximum number of cells that can be formed in the production facility Amortized fixed cost for establishment of production facility
Maximum number of machines in each cell Minimum number of machines in each cell Amortized cost of a machine of type
Unit cost of intercellular movement of part type Mean time between failures of a machine of type Cost of breakdown of a machine of type
Machine index for the th operation of part type along route
Number of operations in routing of part type ; the operations of part type along route are processed on a machine set of { , , … . , }
Demand of part type in market
Production cost of part type in a cell of size
Outbound logistics costs of part type from production facility to market Inbound logistics costs of part type from supplier of production facility Processing time of part type on a machine of type along route
Procurement cost of part type from supplier A great positive number
101
Decision variables
Binary variable, equals one if the demand of market for part type along route is assigned to cell of size in production facility ; equals zero otherwise
Binary variable, equals one if route is selected for part type ; machine of type 1 is located in cell of size , and machine of type 2 is not located in that cell; equals zero otherwise
Binary variable, equals one if part type along route is assigned to cell in production facility ; equals zero otherwise
Binary variable, equals one if cell in production facility is of size ; equals zero otherwise
Binary variable, equals one if the demand of production facility for production of part type is purchased from supplier ; equals zero otherwise
Binary variable, equals one if production facility is established; equals zero otherwise Binary variable, equals one if machine of type is assigned to cell of production facility
; equals zero otherwise.
Jabal Ameli et al. (2008) and Chung et al. (2011) have presented a mathematical method for calculation of machine breakdown cost. We use the following equation to calculate the total intercellular movement cost:
(1 − ( ) )
(1)
One can linearize the non-linear terms that appear in the objective function of the mathematical model with ′ = (1 − ),under the constraint sets below:
+ + 1 − − 2 ≤ ′ ∀ , , , , 1, 2 (2)
A frequent method of addressing machine reliability concern in the design phase of the manufacturing system is evaluating and measuring mean time between failures.
= ( ) (3)
The proposed model accommodates seven different terms in the objective function, which can be stated as in (1)–(7):
= + + + + + + (1-0)
=
( )( ) (1-1)
102
= (1-3)
= (1-4)
= ( + ) (1-5)
= (1-6)
= (1-7)
The objective function given by equation (1-0) is then minimized. The term (1-1) is a linearized form of equation (1). In this term, the cost of intercellular movement is calculated for all products in all production facilities. Also, the term (1-2) was proposed to calculate the machine failure in the previous section as equation (3). These two terms are also considered in the objective function in the articles of Jabal Ameli et al. (2008) and Chung et al. (2011).
Equations (1-3)-(1-7) represent the machine costs, production costs, raw material procurement costs, distribution costs and the total annual amortized fixed cost of establishment of production facilities. Based on the model assumptions, the aforementioned objective function is subject to the following constraints:
+ − + 1 ≤ ∀ , , , , 1, 2 (4)
= ∀ ,
(5)
≤ ∀ , , , (6)
≤ ∀ , , , (7)
≤ ∀ (8)
≤ 1 ∀ , (9)
103
≤ ∀ , , (11)
= 1 ∀ (12)
≤ ∀ , (13)
≤ + 1 − ∀ , , , (14)
+ − 1 ≤ ∀ , , , (15)
+ (1 − ) ≥ 1 ∀ , (16)
≤ ∀ , , , , 1, 2 (17)
≤ ∀ , , , , 1, 2 (18)
≤ 1 − ∀ , , , , 1, 2 (19)
1 − ≤ + 1 − ∀ , , , , 2 (20)
≤ ∀ , , , 1 (21)
≤ ∀ , , , 1 (22)
≤ ∀ , , , (23)
≤ ∀ , , 1 (24)
≤ ∀ , , , , 1, 2 (25)
≤ 1 ∀ (26)
104
It is ensured based on equation (4) that if all of the primary variables have unit values, so do the new variables corresponding to them. In equation (5), all cell sizes are established according to the number of products that are produced in the cells under question. Equation (6) allows a cell to produce the demand of a market for a part only if the set of products that are produced by the cell contains that part. Equation (7) illustrates the available time limitations of the production facilities for all production processes. Equation (8) does not allow a cell to be formed in the production facility unless the production facility is established. Equation (9) forces the sizes of the formed cells to be unique. Eq. (10) ensures that the demand of a market for each product is assigned to a production facility and a cell. Equations (11) and (12) let a level of production cost be used for a cell only if it has been formed at that level of cost. Equation (13) considers that raw material demand of the production facility is supplied by suppliers. Equation (14) and Equation (15) assign the maximum and minimum values of the cell size. Equation (16) does not allow a machine to be assigned to a cell in a production facility unless the production facility is established. It is ensured based on equations (17) to (26) that if a primary binary variable is set to zero, so will the new variables corresponding to it. Equation (27) provides the logical binary necessities for the decision variables.
3-Computational results
A few numerical examples are provided in this section to examine the performance of the proposed model. First, a basic problem is designed and called example 1, and then, the values of selected parameters of the problem are changed to generate other problems. Example 1 is solved using CPLEX 11 software on an Intel Core i5 2.50 GHz PC with 4 GB RAM. It is assumed in the above problem that there are two suppliers, two production facilities, and two markets. Four part types are included in Example 1, and GT and CM are supposed to be used for designing four machine types and cells. With a number of process plans, every part can be manufactured on different machines. Two different suppliers, one located at supplier 1 (Parts 1, 2, 3, and 4) and the other at supplier 2 (Parts 1, 2, 3, and 4), meet the raw material requirements for these four parts. Tables 2–5 contain the information concerning example 1. The random distributions that are specified in table 2 are used for generating the nominal data randomly. Table 3 contains the information related to the distance matrix between production facility locations and markets. Table 4 gives the information concerning the distance matrix between production facility locations and suppliers. Table 5 provides information of demands of markets for each part.
Table 2. The sources of nominal data random generation
Parameter Range
20000 35000
5
Uniform Distribution [50,80]×100 Uniform Distribution [10,80]
Table 3. Distance matrix between production facility locations and markets in example 1
Market 1 Market 2
Production facility 1 0 6
Production facility 2 6 0
Table 4. Distance matrix between production facility locations and suppliers in example 1
Supplier 1 Supplier 2
Production facility 1 4 5
105
Table 5. Demand of parts in markets in example 1
Market 1 Market 2
Part 1 70 90
Part 2 100 45
Part 3 50 80
Part 4 70 75
The data sets related to alternative part-routing, production sequence and production time incidence matrices are shown in table 6. Also, the information on machines breakdown for example 1 is shown in table 7.
Table 6. Alternative process routing and processing times in example 1
Part 1 Part 2 Part 3 Part 4
Routings → R1 R2 R3 R1 R2 R3 R1 R2 R1 R2
Machine 1 *1(1) 1(5) 1(3) 1(2) 1(4) 1(4) 1(2)
Machine 2 2(3) 2(3) 1(3) 2(2) 1(2) 2(3) 1(3)
Machine 3 2(3) 2(1) 2(1) 2(1)
Machine 4 2(4) 3(3) 2(3) 3(4) 3(2)
* Production sequence (Production time)
Table 7. Information on machines breakdown in example 1
Cost of breakdown MTBF (min)
Machine 1 900 5400
Machine 2 2000 3060
Machine 3 2000 4380
Machine 4 1600 3600
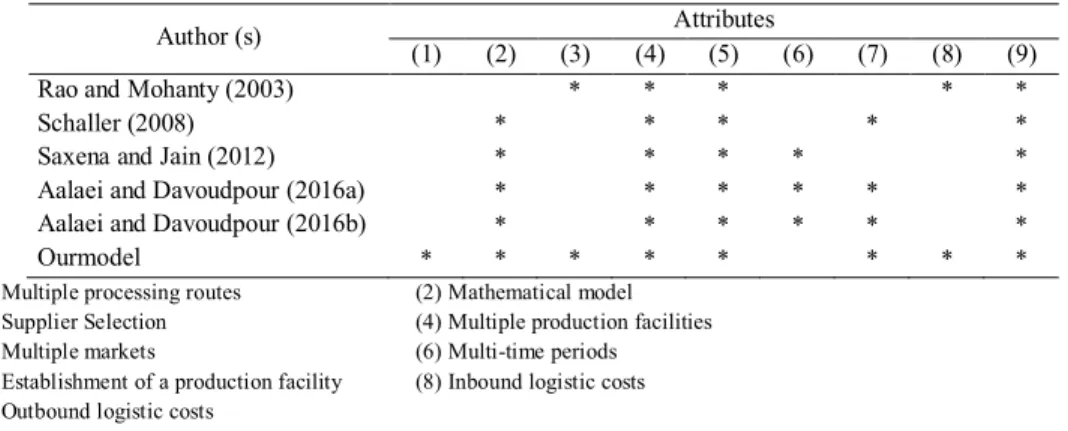
The initial values of the basic parameters of the problem (i.e. example 1) were presented. Table 8 gives the optimal solutions obtained from solving example 1 in the objective function. By considering all terms, the integrated objective function ∗should be minimized as given in equation (1-0) subject to constraints (1-1)-(1-7) and (4)-(27).
Table 8. The optimal objective function values of CPLEX for example 1
Cost terms Objective function
Intercellular movement costs = 800
Machine breakdown costs = 1 760.263
Machine costs = 23 800
Production costs = 5 000
Raw material procurement costs and inbound logistic costs = 38 970 Outbound logistic costs from production facilities to markets = 3 290 Amortized fixed cost of production facility establishment = 20 000
Total cost ∗= 93 620.263
In a simple cell formation in a given 0-1 machine-part incidence matrix, the matrix rows and columns are rearranged for creation of part families and machine cells. Usually, researchers try to simultaneously minimize intercellular movement and maximize machine utilization within a cell by determining a proper rearrangement. They can then observe blocks along the main matrix diagonal. Based on these results, the final machine-part matrix is plotted with the demands for each part in table 9.
106
Table 9. The optimum machine-part matrix for example 1
Part 1
Part 2
Part 3
Part 4
Cell 1 Machine 1 160
Cell 2 Machine 2 160 145 130 145
Machine 3 145 145
Machine 4 145 130 145
Detailed results of numerical example 1 are provided in order to better understand the final results. The assignment of machines, part-routing and parts to the production network is presented in figure 1.
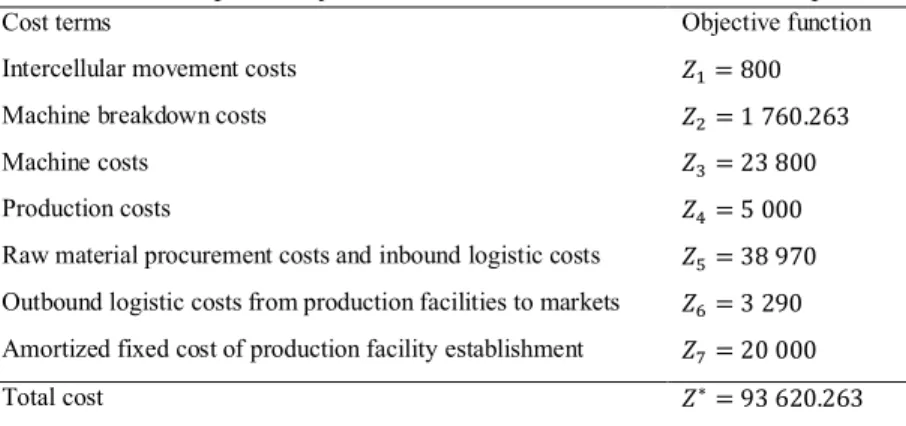
Fig. 1. Assignment of machines, part-routing and parts to production facilities and SC network Figure 1 displays the cells formed by the proposed model for example 1,which has two markets, two facility locations and two suppliers. The problem is composed of four products and four machine types. The figure contains information on the number of cells (cell 1 and cell 2) that are formed at each production location (production facility 2), process routing and the number of machines each cell contains from every machine type, the markets that each cell serves for every product, and the procurement of raw materials from suppliers. Traditionally, firms had to take into account their supply chain design, choose the number of production facilities as well as their location, and match production facilities to markets for products and to suppliers for raw materials (traditional approach). Rao and Mohanty (2003) hinted that “there is a need to analyze the trade-off between CMS design and SC design within the framework of mathematical programming.” However, they did not present any model in their paper. Raw material procurement from suppliers, on the other hand, has a considerable effect on the inbound logistics costs of parts and raw materials. Trade-offs exist between inbound logistics costs, part family formation for obtaining GT advantages and competitive cell location for production cost reduction. Insights can be gained into these trade-offs through Example 1. Therefore, it is tried to show the interrelation between selecting a manufacturing system design (process, product line, or cellular layout) and the production network design through the proposed model for example 1. The feasibility of the strategies listed below for specification of the cells and facility location decisions has been established:
Strategy A: design the cells separately from other components (procurement and distribution) of the SC (Production optimization).
Strategy B: design the cells considering procurement costs in isolation from other components (production and distribution) of the SC (Procurement optimization).
Strategy C: design the cells considering distribution costs in isolation from other components (procurement and production) of the SC (Logistics optimization).
Strategy D: locate the cells at facility locations that are obtained by GT considerations and also through the optimal solution in our proposed model; then integrate cell design with procurement and distribution (Total optimization).
In the production optimization (Strategy A), the intercellular movement costs, machine breakdown costs, machine costs, production costs and amortized fixed cost of production facility establishment are included in the objective function. In the procurement optimization (Strategy B), raw material procurement costs and inbound logistic costs are considered as the objective function. In the logistics optimization (Strategy C), outbound logistic costs are considered as the objective function. Table 10 provides optimal values of objective function for each of the four strategies.
107
Table 10. The optimal values of objective function in Strategies A, B, C and D for example 1
Cost terms Strategy A Strategy B Strategy C Strategy D Production 51360.263 52802.224 96847.643 51360.263
Procurement 37315 32240 40275 38970
Logistics 14160 14160 2860 3290
Total cost 102835.263 99202.224 139982.643 93620.263
Strategy A decreases the cost of produced parts. Strategy B, as a traditional approach, reduces procurement costs. However, the production cost and outbound logistic cost are still significant. Strategy C leads to reduction in logistics costs. Production efficiency of production facilities improves if cells are designed in isolation from the other SC design elements. This, in turn, reduces the cost of produced parts (i.e. Strategy A). Here, however, both work-in-process inventories on either end of the production network and possibly the logistics costs of finished goods distribution are increased by not integrating it with procurement and distribution. Cell design has to be integrated with procurement and logistics so that efficiency increases in the whole supply chain (i.e. Strategy D). Strategy D (the proposed approach of this study) locates the cells at facility locations obtained by GT considerations and through the optimal solution in the proposed model. Therefore, in view of the results in Table 11, Strategy D is capable of obtaining the optimal solutions in total cost, which demonstrates that the proposed approach is effective. The total cost of the optimal solution generated by Strategy D was $93 620.263, which was 5.49%, 18.17% and 12.80% less than those of the solutions generated by Strategies A ($102 835.263), B ($99 202.224) and C ($139 982.643), respectively.
To validate the quality of the proposed integrated approach, an appropriate test instance has been prepared. Numerical example 2 was designed by Bhide et al. (2005). Jabal Ameli et al. (2008) solved this example optimally. Example 2 consists of eight part types and nine machine types. Four different suppliers are utilized for meeting the raw material requirements for the eight parts. Here, it is assumed that there are six production facilities and six markets. Tables 11-14 provide the related information.
Table 11. APR and processing times for numerical example 2 (Bhide et al., 2005)
Parts Routings Machines
1 2 3 4 5 6 7 8 9
1
1 5 3 4 5
2 5 5 4
3 5 4 5
2
1 4 4 3 4
2 5 3 3
3 5 3 4
3 1 4 3 4 3
2 4 3 3 3
4 1 5 3 5 4
2 5 3 5 4 4
5 1 3 5 5
2 4 4 5 5
6 1 5 5 5
2 4 5 5
7
1 5 4 3 5
2 4 4 5
3 3 4 3 5
4 5 3 4 5
8 1 4 3
108
Table 12. Demand of parts in markets for example 2
Parts Markets
1 2 3 4 5 6
1 30 40 30 40 30 40
2 70 60 70 60 70 60
3 60 50 60 50 60 50
4 70 75 70 75 70 75
5 65 45 65 45 65 45
6 55 50 55 50 55 50
7 40 100 40 100 40 100
8 60 55 60 55 60 55
Table 13. Production cost of each part in cells with different sizes for example 2
Parts Size of cell
1 2 3 4 5 6 7 8
1 5 10 10 15 15 15 20 20
2 5 10 10 15 15 15 20 20
3 5 10 10 15 15 15 20 20
4 5 10 10 15 15 15 20 20
5 5 10 10 15 15 15 20 20
6 5 10 10 15 15 15 20 20
7 5 10 10 15 15 15 20 20
8 5 10 10 15 15 15 20 20
Table 14. The sources of random generation of the nominal data
Parameter Range
20000 35000
Uniform Distribution [50,80]×100 Uniform Distribution [10,80]
If i=m then = 1, otherwise equal uniform distribution [2,10] If i=s then = 1, otherwise equal uniform distribution [2,10]
Table 15 gives the optimal solutions obtained from solving each problem with one term in the objective function.
Table 15. The optimal objective function values of CPLEX for example 2
Cost term Objective function
Intercellular movement = 12 225
Machine breakdown = 15 818.607
Machine = 78 600
Production = 19 275
Raw material procurement and inbound logistic = 109 180 Outbound logistic from production facilities to markets = 13 745 Amortized fixed cost of establishing production facilities = 20 000
Total cost ∗= 268 843.607
109
Fig. 2. Assigning machines, part-routing and parts to production facilities and SC network for example 2
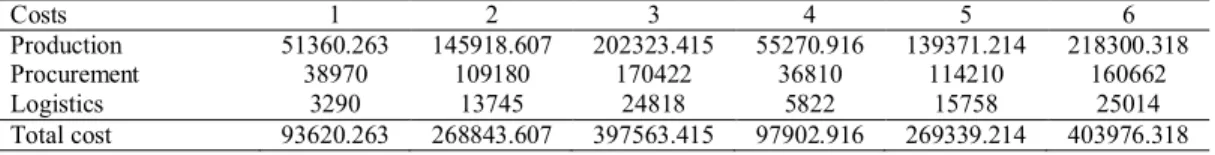
Based on the review of the literature, many researchers have sought to develop the models and solution procedures. They have, therefore, experimented in different ways to obtain a model behaviour and, consequently, non-optimal/near-optimal/optimal solutions. An integrated model of the CMS with SC design and solution procedures was developed by Shaller (2008) for getting non-optimal solutions. As seen in Figure 2 and Table 15, we present the non-optimal solutions of Example 2. Example 3 consists of ten part types and ten machine types. Five different suppliers are utilized for meeting the raw material requirements for the ten parts. Here, it is assumed that there are seven production facilities and seven markets. Numerical examples 4-6 in Table 16 are designed by varying the distance matrix between production facility locations and markets for numerical examples 1-3.
Table 16. The optimal solutions of the set of 6 numerical examples
Costs 1 2 3 4 5 6
Production 51360.263 145918.607 202323.415 55270.916 139371.214 218300.318
Procurement 38970 109180 170422 36810 114210 160662
Logistics 3290 13745 24818 5822 15758 25014
Total cost 93620.263 268843.607 397563.415 97902.916 269339.214 403976.318
Here, we developed a novel mathematical model for integrating cell formation into supply chain design, using alternate process plans. The proposed approach was used for solving six selected case studies. It has been demonstrated that a better understanding of the integrated method’s effects is obtained by the proposed model, as it takes into account the volume and sequence of production, and alternative process routings in the production network.
4-Conclusion
In this study, business enterprises that distribute the capacity of their products in a wide geographical range (in the form of several production facilities) to meet the demand of several markets were considered. Under such circumstances, such rebuilding enterprises can re-configure
110
their own manufacturing networks (including distributed facilities) for a specific production process or a product family. In addition, a number of facilities with potential for production is established in a number of candidate sites to meet market demands. In this research, a distributed cellular manufacturing system was used to produce products. This system is distributed throughout the supply chain network between manufacturers. In fact, a set of manufacturers is considered in the cellular manufacturing system as a production network, and cells in the production sites are formed in such a way that the costs of supplying raw materials from suppliers, production of products and distribution of finished products are minimized.
This paper presents a novel mathematical model for integrating CMS into a three-echelon SC network. A review of the literature showed that there has been no research incorporating multi-supplier problems and procurement of raw materials in the integration of the CMS into SCM. To make up for these gaps, the CMS, SCM and sourcing decisions for each production facility were integrated in the proposed model. The purpose of the model is to minimize procurement costs, production costs, inbound logistic costs, outbound logistic costs, intercellular movement costs, machine breakdown costs, amortized fixed costs of establishing production facilities and amortized costs of machines. A three-echelon SC network was taken into consideration here, on which the proposed integrated approach was applied for effective realization of the design, figure out the part-routing, numbers, location, and cell formation for the production network. The design also calculates the quantity of materials to be consumed in the production process, raw materials to be transported from suppliers to production facilities, and products to be produced for markets. Six numerical examples were used for illustration of the performance of the proposed model. Moreover, the originality of the paper is due to the following points:
Designing a model for integration of the CMS into SC design.
Considering the volume of production, sequence of production, and alternative process routings in the production network.
Considering the sourcing decisions for each production facility.
Determining the locations of production facilities at potential site locations.
Determining the trade-off between procurement and inbound logistic costs, outbound logistic costs form production facilities to markets and production costs.
The proposed model has the potential for incorporation of other features in future investigations. Here are a number of guidelines for future research:
Applying a metaheuristic approach (GA, SA, etc.) for solving the proposed model for real-sized problems.
Extending the proposed model for integration of dynamic cellular manufacturing systems into SC design.
Modelling the proposed approach by considering a multi-period problem while demand is stochastic.
Adding new cost terms in the objective function, such as the sales profits of products manufactured for an enterprise, and eliminating assumptions related to the complete satisfaction of each product's demand.
References
Aalaei, A., &Davoudpour, H. (2016a). Revised multi-choice goal programming for incorporated dynamic virtual cellular manufacturing into supply chain management: A case study,Engineering Applications of Artificial Intelligence, 47 (3–15), doi: 10.1016/j.engappai.2015.04.005.
Aalaei, A., & Davoudpour, H. (2016b). Two bounds for integrating the virtual dynamic ellular manufacturing problem into supply chain management, Journal of Industrial and Management Optimization, 12 (3), 907–930.
Ahkioon, S., Bulgak, A. A.,&Bektas, T. (2009). Integrated cellular manufacturing systems design with production planning and dynamic system reconfiguration, European Journal of Operational
111 Research, 192, 414-428.
Arkat, J.,Abdollahzadeh, H., & Ghahve,H. (2012). A new branch and bound algorithm for cell formation problem, Applied Mathematical Modelling, 36 (10), 5091–5100.
Balakrishnan, J.,&Cheng, C. H. (2005). Dynamic cellular manufacturing under multi-period planning horizons, Journal of Manufacturing Technology Management, 16, 516-530.
Bhide, P., Bhandwale, A., & Kesavadas, T. (2005). Cell formation using multiple process plans,
Journal of Intelligent Manufacturing, 16 (1), 53–65.
Chung, S.H., Wu, T.H., & Chang, C.C. (2011). An efficient tabu search algorithm to the cell formation problem with alternative routings and machine reliability considerations, Computers & Industrial Engineering 60, 7–15.
Defersha, F., &Chen, M. (2006). A comprehensive mathematical model for the design of cellular manufacturing systems, International Journal of Production Economics, 103, 767-783.
Jabal Ameli, M.S., Arkat, J., &Barzinpour, F. (2008). Modelling the effects of machine breakdowns in the generalized cell formation problem, International Journal of Advanced Manufacturing Technology, 39 (7), 838–850.
Jain, V., Wadhwa, S., &Deshmukh, S.G. (2007).Supplier selection using fuzzy association rules mining.International Journal of Production Research, 45 (6), 1323-1353.
Jain, V. (2006) Hybrid approaches to model supplier related issues in a dynamic supply chain, Ph.D.
Mechanical Engineering Department, Indian Institute of Technology Delhi, India.
Kasilingam, R.G., &Lashkari, R.S. (1991).Cell formation in the presence of alternate process plans in flexible manufacturing systems, Production Planning and Control, 2 (2), 135–141.
Kisomi,M.S., Solimanpur,&M.,Doniavi, A. (2016). An integrated supply chain configuration model and procurement management under uncertainty: A set-based robust optimization methodology,
Applied Mathematical Modelling, 40 (17–18), 7928–7947.
Mohammadi, M., & Forghani, K. (2014). A novel approach for considering layout problem in cellular manufacturing systems with alternative processing routings and subcontracting approach, Applied Mathematical Modelling, 28 (14), 3624–3640.
Rao, P., &Mohanty, R. (2003). Impact of cellular manufacturing on supply chain management: exploration of interrelationships between design issues, International Journal of Advanced Manufacturing Technology Management, 5 (5-6), 507–520.
Rasti-Barzoki,M.,&Hejazi, S.R. (2015). Pseudo-polynomial dynamic programming for an integrated due date assignment, resource allocation, production, and distribution scheduling model in suppl y chain scheduling, Applied Mathematical Modelling, 39 (12), 3280–3289.
Saxena, L.K., &Jain, P.K. (2012).An integrated model of dynamic cellular manufacturing and supply chain system design,International Journal of Advanced Manufacturing Technology, 62(1–4), 385– 404.
Schaller, J. (2008). Incorporating cellular manufacturing into supply chain design, International Journal of Production Research, 46 (17), doi: 10.1080/00207540701348761.
112
Wemmerlo, U.,&Hyer, N.L. (1989). Cellular manufacturing in the U.S. industry: A survey of users,