Sharif University of Technology
Scientia IranicaTransactions A: Civil Engineering http://scientiairanica.sharif.edu
Using genetic algorithms for long-term planning of
network of bridges
H. Alikhani and A. Alvanchi
Department of Civil Engineering, Sharif University of Technology, Tehran, Iran.
Received 26 November 2016; received in revised form 27 September 2017; accepted 2 December 2017
KEYWORDS Bridge maintenance; Maintenance planning;
Asset management; Budgeting;
Genetic algorithm.
Abstract. Bridge maintenance activities are often budgeted, scheduled, and conducted for networks of bridges with dierent ages, types, and conditions, which can make bridge network maintenance management challenging. In this study, we propose an improved maintenance planning model based on genetic algorithm for a network of bridges to bring a long-term perspective to the lifespan of bridges. To test the applicability and eciency of the model, it was applied to a network of 100 bridges in one of the south-western provinces of Iran. The results of the model implementation showed considerable potential for improvement over the currently adopted model for bridge maintenance planning. © 2019 Sharif University of Technology. All rights reserved.
1. Introduction
Over the course of its service time, infrastructure can be aected by gradual wearing down from normal use as well as deterioration caused by environmental con-ditions. An eective maintenance program is essential to keep infrastructure components up and run for the decades during which they are in use. The operation phase of the infrastructure life cycle is the most expen-sive stage and longer service requires ever-increasing maintenance. For example, as IAM (Institute of Asset Management) [1] indicates, operation and maintenance activities absorb around 60% of the total investment into infrastructure during its lifecycle.
Bridges are important pieces of infrastructure, and they can play a signicant role in a country's de-velopment. Proper functionality of bridges is essential for the ow of people and cargo traveling on roads *. Corresponding author. Tel.: +98 21 66164221;
Fax: +98 21 66014828
E-mail addresses: [email protected] (H. Alikhani); [email protected] (A. Alvanchi)
doi: 10.24200/sci.2017.4604
through natural and articial barriers, both inside and outside major centers. When bridges fail, so does the movement of people and goods. The collapse of Kan bridge in Tehran, Iran, closed the Fateh freeway, leaving thousands of travelers trapped for hours in the heavy trac [2]. Beyond merely disrupting trac ow, poorly maintained and damaged bridges are very dangerous. For example, the collapse of an aging bridge in Tonekabon, Mazandaran, Iran, caused ve vehicles to fall vertically o the bridge, resulting in one casualty and eighteen injuries [3].
Conducting proper maintenance activities on a bridge increases its level and period of service, de-lays the need for major maintenance activities and renovations, and reduces total cost spent for the life cycle of the bridge. But, organizations in charge of bridge maintenance (e.g., municipalities or regional Departments of Transportation) usually deal with net-works of bridges, rather than a single bridge at a time. While there are usually limited budgets available for maintaining a bridge network, it would be wise to spend the budget in an ecient manner so as to bring the highest possible value to the network in the long run. However, annually choosing a particular set of bridges among a network of bridges with dierent
sizes, levels of usage, and levels of service creates a combinatorially complex decision-making problem with an overwhelming number of choices. This complexity causes some bridges to be left without proper maintenance activities, which accelerates their deterioration rates and imposes a higher cost to the bridge maintaining organization for future major and critical maintenance activities. Furthermore, when an organization identies bridges in critical condition, a large portion of its maintenance budget is spent on them, leaving insucient funds for the rest of the bridge maintenance activities. This trend gradually increases the maintenance costs of the overall bridge network, while average level of service within the bridge network is reduced over time. For example, looking at the American Society for Civil Engineers (ASCE) report card for American infrastructure [4], the number of closed bridges increased from 2816 in 2007 to 3585 in 2012. To eliminate this critical condition by 2028, $20.5 billion USD is required to be spent annually on the USA's bridge network maintenance program; however, only $12.8 billion USD is actually being allocated.
Compared to the USA, bridge infrastructure in Iran is relatively new [5], but the issue currently faced in the USA will also occur in Iran if the country's bridge network is left without an eective Bridge Man-agement System (BMS). The necessity of deploying an ecient computer-based BMS is made clear when noting that the implementation and deployment cost of a computerized BMS, estimated to be several million U.S. dollars, is not even comparable to the cost impact of one bridge collapse, which can amount to tens of millions of U.S. dollars [5]. It is estimated that improper bridge maintenance management in the past ten years in Iran has cost more than 500 million dollars [5]. This will grow higher if an ecient BMS is not deployed for maintaining bridges in the country.
To address the need for an ecient BMS, in this study, we develop a bridge network maintenance planning model based on Genetic Algorithm (GA). Before developing the model, a complete literature review is conducted. Then, in response to inaccuracies in the existing bridge maintenance models, we propose an improved model. The proposed model is applicable to maintaining a range of bridge networks, with some customizations required for each case. To test the applicability of the model, it is then applied to a network of bridges in the province of Kohgiluyeh and Boyer Ahmad in southwestern Iran over a twenty-year span. The bridge network is managed by the Iran Road Maintenance and Transportation Organization (RMTO); the model has been customized based on the specic requirements of RMTO and implemented successfully for the case.
2. Literature review
In general, infrastructure planning models developed in the literature fall into two main categories: planning models based on analytical methods and planning mod-els based on meta-heuristic search techniques. Analyt-ical modeling methods are mainly used for prioritizing eective factors involved in infrastructure maintenance planning. Decision tree and Analytical Hierarchy Process (AHP) are the main tools used in this category of maintenance planning models. For example, Hicks et al. [6] used a decision tree-based method for selecting the appropriate preventive maintenance activities for dierent types of asphalt distress. For this method, they initially listed dierent asphalt distress types and then, evaluated the cost-eectiveness of the available maintenance activities based on the decision tree tech-nique. In another study, Al-Barqawy and Zayed [7] used the AHP technique to prioritize factors aecting the main conditions of water when assigning the main rehabilitation activities for water. Although analytical methods were useful for maintenance planning process, their application was mainly limited to setting decision rules and criteria rather than directly selecting proper maintenance choices among a range of possibilities.
Meta-heuristic search techniques, such as genetic algorithm, ant colony, and simulated annealing are widely used for a variety of decision-making problems, especially when problems are combinatorially com-plex [8]. Among the dierent meta-heuristic search techniques we found in the literature, the Genetic Algorithm (GA) is mostly applied to infrastructure maintenance planning [9-11]. For example, Albat-taineh [12] used GA in road maintenance planning, where he divided a road into dierent segments, and maintenance activities were applied to segments to improve their levels of service. The main outputs of this research eort were annual maintenance strategies to follow for dierent road segments in accordance with the limited maintenance budget set and expected level of service for road segments over the course of one year. In another study, Elhakeem and Hegazy [9] developed a maintenance planning model for schools in Toronto, Canada. The objective function of this GA based maintenance planning model was maximizing total condition or service level of school elements (e.g., tables, benches, and windows) with a limited annual budget over the course of ve years. The main outputs of this model were annual rehabilitation plans proposed for dierent school elements. In 2007, Elbehairy [13] developed a GA-based bridge network maintenance planning model with the objective function of maxi-mizing the conditions of bridge elements with a given budget for a planning period of ve years.
In all of the above-mentioned planning models, planning periods are relatively short when compared
with the service life of an infrastructure element, e.g., less than ve years. Furthermore, the studied models do not schedule multiple repairs for an ele-ment during the planning period, which makes them non-expandable to a long-term planning period when multiple repairs might be required. Additionally, in the bridge maintenance planning model developed by Elbehairy [13], there is no change in bridge deteriora-tion rates before and after repair; however, according to the research done by NDR [14], deterioration rates accelerate after maintenance activities are conducted on a bridge. Also, in the bridge network maintenance model developed by Elbehairy [13], when maintenance activities are scheduled for a bridge, regardless of the service conditions of dierent elements, all elements of the bridge are scheduled for the maintenance. But, since deterioration rates of dierent bridge elements might show dierent trends over time, the selection of the optimum choice may be complicated. In this study, we propose and develop a model that eliminates the above-mentioned limitations.
3. Bridge maintenance in Iran
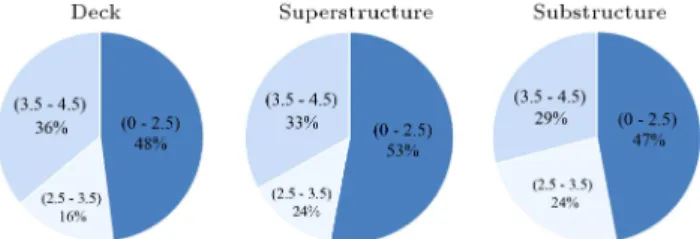
The Iran Road Maintenance and Transportation Orga-nization (RMTO), a department under the Ministry of Roads, Housing, and Urban Development, is the body in charge of the maintenance of highways. In 2013, a study was conducted by RMTO to develop an asset management system that would best support their bridge maintenance activities. Among dierent maintenance systems, a Bridge Maintenance System (BMS) developed by the COWI consulting group was selected by RMTO [5]. In this BMS, every bridge has three types of elements: deck, superstructure, and substructure. Bridge element conditions are de-termined independently and marked from 0, for the best condition, to 5, for the lowest usable condition. Condition marks above 5 show unacceptable and unsafe conditions.
There are 31 provinces in Iran, each of which con-tains an oce of RMTO. Bridge network maintenance and repair within every province is managed locally through the RMTO oce of the province. Currently, inspections are made every several years of the bridge networks within the dierent provinces, and bridge element conditions are scored. Maintenance and repair activities are then scheduled according to the bridge scores achieved from a simple ranking method. In this method, the conditions of bridges are ranked from the worst to the best; those with the worst conditions are prioritized for repair. However, simple ranking method does not necessarily maximize the benet-per-cost ratio of the bridges in the long run. In our discussions with RMTO experts, we found out that the main reason
RMTO did not run long-term maintenance planning was that they were not equipped with a proper tool. 4. Proposed planning model
The proposed model is built upon the previous models developed for infrastructure maintenance planning, while eliminating some of the existing limitations. Short planning horizon, considering only one single repair activity during the planning horizon, applying the same deterioration trends before and after repair, and limiting repair activities to an entire bridge are the main constraints in the past research eorts, which are addressed in the proposed model by incorporating the following improvements. First, the model is developed exibly enough to expand its planning horizon from several years to several decades. Second, limitations on the number of activities scheduled over the planning horizon are removed, which is quite essential to bring a long-term perspective to maintenance planning. Third, to increase accuracy of the model, two deterioration trends are used: (a) deterioration trend over the origi-nal setting of a bridge, where there is no maintenance activity applied to the bridge; and (b) deterioration trend for the bridge with maintenance activities applied to it. Fourth, to address the dierent deterioration trends of dierent bridge elements, the model is capable of scheduling maintenance activities in separate years. To run the model, bridge element specications, as the main model inputs, are rst collected for all bridges within the network. The data obtained are then organized in the form of initial GA chromosome and auxiliary matrices, which represent the initial maintenance plans and the bridge network's condition. Next, improvements are made to the maintenance plans through dierent GA model generations created by applying the two main GA model improvement tools of crossover and mutation operations. The evaluation function of the model, used for evaluating GA chro-mosomes or maintenance plans in each generation, is developed for maximizing the benet-per-cost ratio, in which benet is considered as improvement made to the bridge service condition and cost is the repair cost. The optimal maintenance plan found is the nal output of the model. A more detailed explanation of the dierent parts of the model follows.
4.1. Model chromosomes and matrices
In the proposed maintenance planning model, the bridge network conditions and planning decisions are stored and manipulated in the form of GA chromosome and auxiliary matrices. One GA chromosome and six dierent types of auxiliary matrices are used in the model:
1. Annual maintenance decision represented by chro-mosome X;
2. Type of bridges in the network represented by matrix E;
3. Annual condition marks of bridge elements stored in matrix Cnd;
4. Maintenance cost rates of bridge elements stored in matrix Cr;
5. Maintenance cost of elements in each year repre-sented in matrix C;
6. Sizes of bridge elements represented by matrix S;
7. Annual condition of each element stored in matrix Cnd.
More discussion of the specications of the model's chromosome and matrices follows.
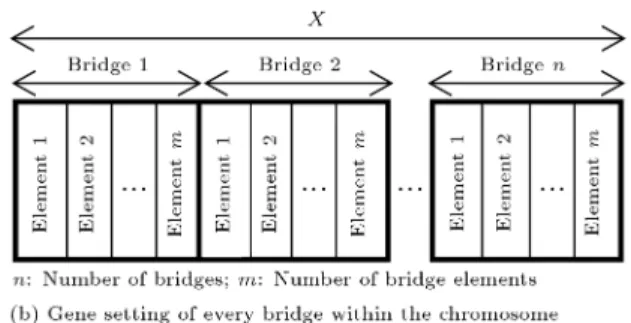
1. Chromosome XXX: Maintenance decisions, i.e., con-ducting or not concon-ducting maintenance activities on dierent bridge elements, for the entire planning horizon are stored in chromosome X. Every gene on this chromosome represents maintenance decision regarding one element of a bridge on the network for a specic period of time, i.e., the specied year in this research. Thus, with the number of n bridges on the bridge network, m types of bridge elements for every bridge, and the number of t years for planning horizon, the length of this chromosome comes to:
Length of chromosome X = n m t: (1) Gene values on this chromosome are either 0 (i.e., do not schedule maintenance activities) or 1 (i.e., schedule maintenance activities). To follow the prevalent trend of bridge maintenance activities scheduled in the country, we assume when a main-tenance decision is made for a bridge element, regardless of the bridge condition, its condition is improved to the best possible condition. For exam-ple, in RMTO, every time maintenance activities are conducted on a bridge element, regardless of its condition, the condition of the bridge element is improved to 1, which is the best possible one that can be achieved after maintenance activities are applied.
Figure 1 represents a schematic view of chro-mosome X in two parts: in Figure 1(a), a macro view of chromosome X shows how this chromo-some contains maintenance decision for the entire planning horizon; Figure 1(b) depicts the setting of genes in every bridge within the chromosome;
2. Matrix EEE: We need to properly capture dierent types of bridges in the network since dierent types of bridges have dierent deterioration rate trends and require dierent types of maintenance activities and costs. Types of dierent bridges on the network
Figure 1. Schematic view of chromosome X, which stores maintenance planning decisions over the planning horizon.
Figure 2. Schematic view of matrix E, which stores the types of bridges in network.
are stored in matrix E. Every bridge has one gene on chromosome E whose value presents its type in the network. For example, in RMTO, bridges are categorized in four dierent types including:
(a) Low-rise concrete slab and concrete beam bridges;
(b) High-rise concrete slab and concrete beam bridges;
(c) Concrete slab and steel beam bridges;
(d) Flat slab bridges. Each type of bridge is marked, respectively, from 1 to 4. With a total number of n bridges, matrix E comes with n elements, as shown in Figure 2. The elements of matrix E are specied at the beginning of the model imple-mentation and remain constant over the plan-ning horizon, since type of each bridge on the network remains the same over its service life.
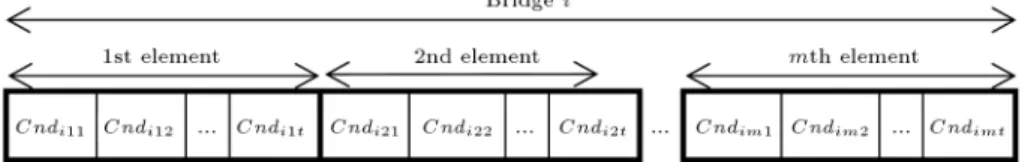
3. Matrix CndCndCnd: Elements of this matrix represent the annual condition marks of bridge elements considering the impacts of maintenance activities scheduled over time. It contains n m t number of elements, in which n represents the number of bridges, m represents the number of bridge elements, and t denotes the number of planning periods (e.g., number of years). The values of this matrix are updated based on initial condition,
Figure 3. Schematic view of matrix Cnd, which stores annual condition of the bridge network after maintenance activities are done.
maintenance decision, and deterioration rates. Fig-ure 3 represents a schematic view of this matrix.
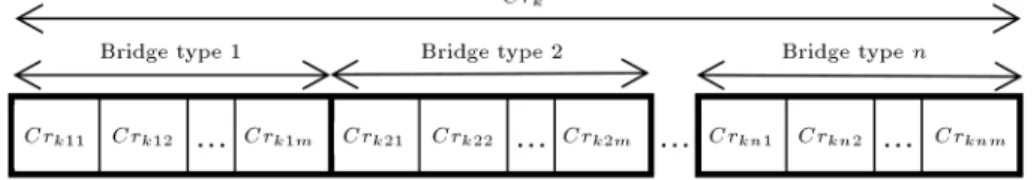
4. Matrix CrCrCr: Matrix Cr stores the maintenance cost rates of bridge elements. Every gene on this matrix represents the maintenance cost rate of an element of a specied bridge type, with the specied bridge condition to be improved to the best possible condition. Thus, if there are n types of bridges on the bridge network, every bridge has the number of m elements and there are k possible scenarios for maintenance activities to the best possible condition; the total number of elements of this matrix becomes n m k. For example, for the RMTO bridge network, there are four dierent types of bridges and each bridge has three dierent elements. There are also four dierent basic bridge maintenance activity scenarios, including improv-ing bridge element condition from 5 to 1, 4 to 1, 3 to 1, and 2 to 1. Therefore, the total length of matrix Cr becomes 48 for the RMTO bridge network. Values of this matrix stay constant over the course of planning horizon. Figure 4 represents a schematic view of this matrix.
It should be noted that in assigning mainte-nance cost rates in matrix Cr, only maintemainte-nance conditions with integer condition marks (e.g., 2, 3, 4, and 5) are accounted. But, bridge element main-tenance conditions are continuously deteriorating over time and their maintenance condition marks are not necessarily integer numbers (e.g., condition marks of 2.7 or 3.4). Thus, for calculating the maintenance cost rates of elements with in-between condition mark values, stored maintenance cost
rates in matrix Cr are used. Estimated cost rate values of a specied bridge network are collected from maintenance contractors or other experts fa-miliar with that specic bridge network. However, to minimize violations of the minimum acceptable level of bridge condition marks for a given plan-ning horizon, estimated maintenance cost rates for conditions below the minimum acceptable level are replaced by fabricated high cost rates, identied as penalties in the evaluation function. For example, in RMTO, the minimum acceptable bridge element condition is 4.5. Thus, to avoid encountering bridge element condition marks above 4.5 (i.e., worse service conditions than 4.5), fabricated high cost rates are assigned to any maintenance activities done for repairing bridge elements with condition marks above 4.5 regardless of the cost rate values estimated by experts. This high cost rate is linked to the increased risk of a bridge malfunction and the consequent accident costs as a result of the declined service condition;
5. Matrix SSS: Size of bridge elements in the bridge network is captured in matrix S. Every element of this matrix represents a bridge element size. The size of each element reported in this matrix should follow the size measure that the maintenance cost rate of the element is based on. For example, if the maintenance cost rate of a bridge deck (as a bridge element) is estimated based on a dollar-per-m2unit,
the reported size of this deck element should be given in m2. The value of matrix S is determined
at the beginning and it remains constant over the course of planning horizon. The length of matrix S
Figure 4. Schematic view of matrix Cr for storing maintenance cost rates.
is n m, in which n is the number of bridges and m denotes the number of elements.
6. Matrix IPIPIP : The importance factor of every bridge is stored in matrix IP . The importance factor is a unit-less number set between 0 and 1, which is decided based on dierent factors such as volume of trac ow on the bridge, its role in transporting people and commodities, and other social reasons. The value of 0 represents the lowest importance and the value of 1 is of the highest importance.
7. Matrix CCC: The maintenance cost of a bridge element is calculated based on its maintenance cost rate, its size, and the decision to conduct or not to conduct maintenance activities for a specic element in a specied year. The calculated costs of bridge elements over the course of the planning horizon are stored in matrix C. Similar to chromosome X, the total length of this matrix comes to nmt, where n represents the number of bridges on the bridge network, m represents types of bridge elements for every bridge, and t denotes the number of years for the planning horizon. When the value of a gene on the maintenance schedule decision chromosome (chromosome X) is equal to zero, there are no maintenance activities scheduled for that specic element in the specied year and, correspondingly, there is no maintenance cost spent for the related element on matrix C.
4.2. Deterioration method
Using historical data for predicting the deterioration of infrastructure facilities is a common practice in the
literature [14,15]. By using this approach, deterioration trends of dierent infrastructure elements with similar types and conditions can be recognized over the years of service, and annual deterioration rates can be calcu-lated based on these trends.
In the deterioration model of a bridge compo-nent, the annual degradation rate of the component is estimated based on its condition rate at the cur-rent year. The condition rate of the component for the next year is then calculated by subtracting the estimated degradation rate from the condition rate of the component at the current year. Deterioration models normally follow dierent trends if there have been any past maintenance activities conducted on them (e.g., [14]). In our proposed model, the calculated deterioration rates are used for updating the values of matrix Cnd and ultimately, for evaluating every maintenance decision represented by chromosome X. As presented by NDR [14], bridge elements show dierent deterioration trends before and after conduct-ing maintenance activities. These two deterioration trends are also adopted in the proposed model of this study. For more details on the prediction of bridge deterioration trends, please refer to [14,9].
4.3. Model implementation method
The model implementation follows the general steps of a typical GA model implementation [11]. With some modications made to the specic conditions of the problem, the model starts with the rst generation of chromosome X, representing an initial maintenance planning decision in the course of a planning horizon.
Budget violation = PT
t=1annual maintenance cost (t)P PTt=1annual budget(t) T
t=1annual budget (t)
: (5)
Box I
The population of chromosomes in the rst generation is created by randomly scheduling one set of mainte-nance activities for each bridge element on the network over the course of the planning horizon. However, the number and periods of maintenance schedules are updated during the creation of subsequent generations. To create the next generations, each chromosome is rst evaluated using the developed evaluation func-tion for the model (Secfunc-tion 4.4). The best ranked chromosomes are then selected and paired to undergo crossover and mutation operations and create new child-chromosomes. The best chromosomes from each generation together with their child-chromosomes form the next generation. This process continues and new generations with improved chromosomes are created. 4.4. Evaluation function
An evaluation (or objective) function is dened in the model for evaluating the dierent maintenance decisions. This evaluation function is basically a cost function and consists in three main components. In the rst component of the evaluation function, or the cost-to-benet component represented in Eq. (2), annual costs of bridge network maintenance (Eq. (3)) are divided by the annual improvements made to the condition marks of the bridge network, considering the importance factor of each bridge on the network: First component =
T
X
t=1
annual maintenance cost(t) Pn
i=1
Pm
j=1(Cndijt+ 1) IPi; (2)
Annual maintenance cost (t)=Xn
i=1 m
X
j=1
XtijCkejSij;
(3) Since we are interested in decisions with the lowest possible costs and highest possible improvement to net-work conditions, in this component, we are interested in maintenance decisions with minimized values. The second component of the evaluation function or service violation component, represented in Eq. (4), reects our need to minimize the number of violations signied by worse service condition levels (i.e., higher condition marks) than the Maximum Acceptable Condition mark (MAC):
Second component =
n
X
i=1 m
X
j=1 T
X
t=1
M1max(0; Cndijt MAC); (4)
Ideally, the value of this component should be zero; therefore, the magnifying factor of M1 is a large number used in this equation for penalizing decisions violating this constraint. Eq. (5), shown in Box I, and Eq. (6) form the third component of the evaluation function, or budget violation component, to consider the total maintenance cost violation based on the total available budget in the evaluation function:
Third component = 8
> < > :
If budget violation violation allowance; 0 If budget violation > violation allowance;
M2 budget violation (6)
where:
i Bridge number = 1; 2; :::; n; j Element number = 1; 2; :::; m; t Time period = 1; 2; :::; T ;
Cndijt Condition mark of element j of bridge
i in year t read from matrix Cnd; e = ei2 E Type of the ith bridge retrieved from
matrix E;
Xtij Maintenance decision for element
j of bridge i at year t read from chromosome X;
Cndijt The dierence between condition marks
before applying maintenance activities and after applying maintenance activities for element j of bridge i in year t. If there are no maintenance activities scheduled for an element in the year, its value becomes zero; Ckej Cost rate of element j on a bridge with
type e and corresponding maintenance condition mark of k read from matrix Cr;
Sij Size of element j of bridge i read from
matrix S;
IPi Importance factor of bridge i read from
M1 Magnifying factor (used in the second component);
MAC Maximum acceptable condition; M2 Magnifying factor (used in the third
component).
Again, here, the ideal value of this component is zero; the magnifying factor of M2 used in this formula is a large number penalizing decisions that exceed the budget violation allowance set for the bridge network. The percentage of budget violation allowance mainly returns to the bridge network manager's capacity to increase the total budget limit by making use of other nancial sources to improve the long-term condition of the network.
5. Case study
To assess the applicability of the proposed model, a case study is conducted for a bridge network of 100 bridges managed by RMTO in the province of Kohgiluyeh and Boyer Ahmad in southwestern Iran. In its BMS, RMTO categorizes these bridges into four main types:
1. Concrete slab and beam bridges less than 6 meters high (28 bridges);
2. Concrete slab and beam bridges higher than 6 meters (26 bridges);
3. Concrete slab and steel beam bridges (18 bridges);
4. Flat slab bridge (28 bridges). In this BMS, ev-ery bridge is further divided into three elements including deck, superstructure, and substructure. The proposed maintenance planning model of this network is implemented for a period of 20 years. 5.1. Model implementation
The model was implemented in Matlab software us-ing Matlab genetic algorithm toolbox. Modications, however, were made to the basic genetic algorithm toolbox to tailor the model to the proposed specic requirements.
5.2. Preparing model chromosome and matrices
With a total number of 100 bridges, three elements for each bridge, and a planning horizon of 20 years, the length of chromosome X reaches 6000 genes (Eq. (1)). To capture the dierent types of bridges on the network, matrix E was rst formed by assigning corresponding type numbers to each bridge on the network. The cost rates of maintenance activities were collected from maintenance experts working in RMTO, and matrix Cr was formed based on their inputs. To avoid receiving bridge elements with very poor
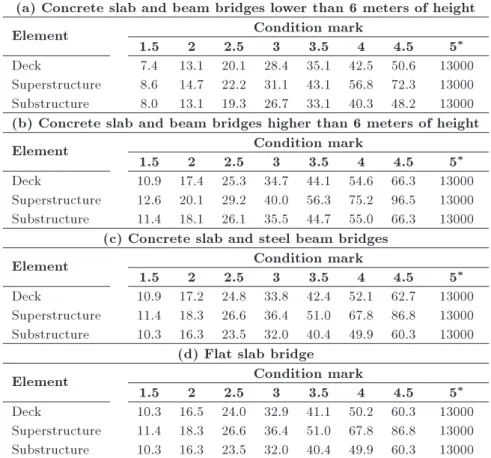
conditions, a high cost value was set for maintenance activities scheduled for elements with condition marks above 4.5. The values used in matrix Cr are presented in Table 1. The sizes of dierent bridge elements on the network, stored in matrix S, and initial condition marks of the bridge elements, stored in matrix Cnd, were obtained from RMTO's BMS database. Figure 5 represents the distribution of initial element condition marks within the network. Since the minimum ac-ceptable bridge condition for RMTO is 4.5, receiving a considerable number of bridge elements with condition marks above 3.5 arms that a signicant number of maintenance activities are required for the network in the next 20 years to avoid violations of the minimum acceptable condition level and a robust maintenance planning is essential for RMTO in the province. The importance factor of each bridge is determined based on the importance factor determined by RMTO for dierent bridges and stored in matrix IP (Table 2).
A total budget of $6.28 million was initially predicted in consultation with RMTO authorities and then, adjusted to $6.29 million based on the results achieved after running the model. (All costs presented in the case study are calculated based on the current currency of Iran (Rial) and then, converted from Iranian Rial to US Dollar with the exchange rate of 3500 (Rials per Dollar) reported by Central Bank of the Islamic Republic of Iran (CBI) on 15 Nov, 2015 accessible at: www.cbi.ir.) The budget violation allowance was set to 10% based on the input of RMTO authorities.
Deterioration rates of dierent elements are re-quired for calculating the annual maintenance condi-tions of dierent bridges on the network, maintained in matrix Cnd. But, unfortunately, RMTO has not supported independent research into predicting the deterioration rates of the bridges in its bridge networks. Therefore, we conducted a search for the available deterioration rates of bridge networks with similar dete-rioration factors. According to Huang et al. [16], bridge deterioration factors, identied in past studies, can be divided in four main groups including environmental (mainly weather) conditions, trac volume, bridge type, and physical specication of the bridge. Among
Figure 5. Distribution of bridge element condition mark ranges (in brackets) in Kohgiluyeh and Boyer Ahmad bridge network in 2016.
Table 1. Values of matrix Cr for cost rates of dierent elements of dierent bridge types with dierent condition marks (US$ per unit size of element).
(a) Concrete slab and beam bridges lower than 6 meters of height
Element Condition mark
1.5 2 2.5 3 3.5 4 4.5 5
Deck 7.4 13.1 20.1 28.4 35.1 42.5 50.6 13000 Superstructure 8.6 14.7 22.2 31.1 43.1 56.8 72.3 13000 Substructure 8.0 13.1 19.3 26.7 33.1 40.3 48.2 13000 (b) Concrete slab and beam bridges higher than 6 meters of height
Element Condition mark
1.5 2 2.5 3 3.5 4 4.5 5
Deck 10.9 17.4 25.3 34.7 44.1 54.6 66.3 13000 Superstructure 12.6 20.1 29.2 40.0 56.3 75.2 96.5 13000 Substructure 11.4 18.1 26.1 35.5 44.7 55.0 66.3 13000
(c) Concrete slab and steel beam bridges
Element Condition mark
1.5 2 2.5 3 3.5 4 4.5 5
Deck 10.9 17.2 24.8 33.8 42.4 52.1 62.7 13000 Superstructure 11.4 18.3 26.6 36.4 51.0 67.8 86.8 13000 Substructure 10.3 16.3 23.5 32.0 40.4 49.9 60.3 13000
(d) Flat slab bridge
Element Condition mark
1.5 2 2.5 3 3.5 4 4.5 5
Deck 10.3 16.5 24.0 32.9 41.1 50.2 60.3 13000 Superstructure 11.4 18.3 26.6 36.4 51.0 67.8 86.8 13000 Substructure 10.3 16.3 23.5 32.0 40.4 49.9 60.3 13000
* The cost of maintenance for condition mark 5 is a fake number for making penalty to avoid reaching a condition mark more than maximum acceptable condition.
Table 2. Values of matrix IP for importance factors of dierent bridges.
Bridge number 1 2 3 4 5 6 7 8 9 10 11 12 13 14 15 16 17 18 19 20 Importance factor 1.1 2 1 1.3 1.5 1.9 1.1 1.6 1 1.9 1.4 1.1 1.8 1.8 1.8 1.1 1.7 1.5 1.1 1.1 Bridge number 21 22 23 24 25 26 27 28 29 30 31 32 33 34 35 36 37 38 39 40 Importance factor 1.8 1.3 1.8 1.5 1 1.8 1.5 2 1.8 1.4 1.9 1.3 1.4 1.9 2 1.6 1.9 2 1.8 1 Bridge number 41 42 43 44 45 46 47 48 49 50 51 52 53 54 55 56 57 58 59 60 Importance factor 1.8 1.1 1.1 1.3 1.6 1.8 1.7 1.6 1.2 1.8 1.2 1.4 1.1 1.7 1.4 1.8 1.3 1.1 1.7 1.3 Bridge number 61 62 63 64 65 66 67 68 69 70 71 72 73 74 75 76 77 78 79 80 Importance factor 1.5 1.4 1.9 2 1 1.7 1.6 1.2 1.8 1.1 2 1.9 1.3 1.3 1.1 1.7 1 1.3 1 2 Bridge number 81 82 83 84 85 86 87 88 89 90 91 92 93 94 95 96 97 98 99 100 Importance factor 2 1 1 1.4 1.2 1.6 1.5 1.8 2 1.6 1 1.7 1.9 1.9 1.3 1.4 1.5 1.4 2 1.6
these four deterioration factors, weather conditions and trac volume are external factors dependent on the region of the bridge network; two other factors are internal ones linked to each specic bridge. Deteri-oration curves prepared by NDR [14] for Nebraska,
USA, are used in this research. Since the regions, i.e., Kohgiluyeh and Boyer Ahmad and Nebraska, have relatively close weather conditions and trac volumes, we do not expect much inaccuracy in the model. For example, as Table 3 presents, Yasuj, the capital of
Table 3. Weather conditions comparison between capitals of Kohgiluyeh and Boyer Ahmad, Yasuj [22], and
Nebraska, Lincoln [23].
Average high temperature (C) Yasuj 22.4
Lioncoln 17.3 Average low temperature (C) Yasuj 8.0
Lioncoln 4.4 Average annual precipitation (mm) Yasuj 865 Lioncoln 735
Kohgiluyeh and Boyer Ahmad province, on average is about 4C warmer in both average high and low
temperatures than Lincoln, the capital of Nebraska is. While the average annual precipitation is 865 mm in Yasuj, Lincoln has an average annual precipitation of 735 mm. Furthermore, based on population [17,18] and vehicles per capita [19,20] statistics, vehicle congestion in Kohgiluyeh and Boyer Ahmad is estimated at 9.3 vehicles/km2, while there are 10 vehicles/km2 in
Ne-braska.
5.3. GA model parameters
The optimum size of each generation's population, crossover operation, and mutation operation, as well as the number of iterations and values of magnifying fac-tors in the evaluation function are determined through trial and error. A population size of 300 is used for each generation. Crossover operation is executed on 40% of the genes in the main population, and the mutation operation is executed on 90% of them. In the crossover operation, roulette wheel selection technique is used for selecting parents, and the operation uses a combination of single-point and two-point techniques for creating ospring [21]. In the mutation, 0.1% of chromosome genes, i.e., 60 genes, participate in the operation. The number of iterations is 2000. The values of magnifying factors are 1010 for M1 (Eq. (4)) and 103for M2 (Eq.
(6)).
5.4. Model verication and validation
A series of validity tests are run to investigate useful-ness and reveal capabilities, limitations, and aws of the model for further renement. The model structure validation test was applied during development by presenting the model to RMTO experts and receiving their feedback. To test legitimacy of the model's be-havior, sensitivity analysis on several model parameters is conducted.
Dierent scenarios are dened to test the model. Two parameters are compared in these scenarios: total cost of maintenance and average condition mark for the whole network. All scenarios are applied to the case study:
- Scenario 1: In this case, parameters are set, as discussed in the case study, with a maximum
acceptable condition mark of 4.5 and a budget limit of $6.28 million. This scenario is the ideal form of maintenance scheduling resulting from the GA model. Every scenario is compared with Scenario 1;
- Scenario 2: As discussed, the current method of scheduling maintenance activities in RMTO is simple ranking. In this scenario, scheduling based on simple ranking is taken into account. However, the outputs of this scenario do not come from the GA model;
- Scenario 3: The organization may wish to generate a plan without budget limit. In this case, the model does not consider the third part of objective function in optimization process;
- Scenarios 4 and 5: In these scenarios, dierent MAC marks are considered. In Scenario 4, we set a maximum of 2.5, with 3.5 in Scenario 5.
Table 4 presents major outputs of the model for each of the scenarios. According to this table, the simple ranking method costs twice Scenario 1 does and produces an average condition mark that is slightly worse. In Scenario 3, the GA model gives a better average condition mark with a vastly higher cost, which is the expected result of lifting budget limitations. In Scenarios 4 and 5, as the MAC mark gets higher (indicating worse condition), total maintenance costs get lower.
5.5. Model results
The model was run for four hours to reach 2000 iterations; however, no signicant improvement was seen in the model after iteration 500. Figure 6 presents improvements in values of the evaluation function over dierent model iterations. One rapid improvement is achieved during the rst iteration, where the values of component 2 (Eq. (4)) and component 3 (Eq. (6)) of the evaluation function converge toward zero and the eects of magnifying factors become minimal; however, the value of component 1 (Eq. (2)) continues to improve during iterations. The evaluation function value of the nal plan equals $8000 over the course of 20 years, indicating only the value of component 1. The zero values achieved for the other two components show that there is no minimum acceptable service level. Minimum
Table 4. Outputs of the model for dierent scenarios. Scenario Cost
(million $)
Average condition mark
1 6.29 1.45
2 13.5 1.9
3 28.48 1.27
4 10.72 1.3
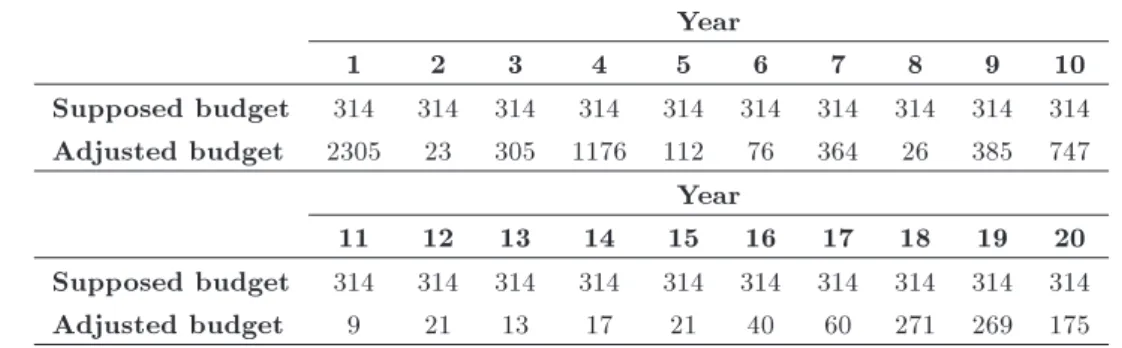
Table 5. Initial annual budget versus adjusted annual budget resulting from the model (thousand $). Year
1 2 3 4 5 6 7 8 9 10
Supposed budget 314 314 314 314 314 314 314 314 314 314 Adjusted budget 2305 23 305 1176 112 76 364 26 385 747
Year
11 12 13 14 15 16 17 18 19 20
Supposed budget 314 314 314 314 314 314 314 314 314 314
Adjusted budget 9 21 13 17 21 40 60 271 269 175
Figure 6. Evaluation function improvement over dierent iterations.
levels, beyond a condition mark of 4.5 and budget violations, over 10% allowance, do not occur in the best maintenance planning.
According to the results achieved for a period of 20 years, RMTO needs a total budget of $6.29 million, which is only 2% higher than the total initial budget actually set for the network. Table 5 represents the initial annual budget with the adjusted annual budget resulting from the model. The average condition mark of the dierent bridge elements during this period is 1.45, showing a signicant improvement compared to the current status of the bridge network, which has an average service condition of 2.42. Our calculations show that if RMTO follows a simple ranking method for scheduling maintenance activities for the next 20 years, the average service level will be 1.96, which is more than 0.5 marks worse than that proposed by the model.
6. Conclusion
Proper bridge maintenance plays an essential role in the durability of a bridge. The high cost of maintenance activities and limited budget available for a network of bridges, with dierent types of bridges and dierent service levels, make management of the network a challenging job, further complicated by a multitude of choices regarding long-term maintenance costs of the bridge network. To overcome this issue, in this study, we proposed a new bridge network planning model
using GA. This model addressed some limitations of the previously developed infrastructure maintenance planning models by expanding the planning horizon to longer terms, narrowing down the maintenance plan-ning assignments to the bridge element level, adding capacity for multiple maintenance job assignments for a single bridge element over the course of the planning horizon, and following dierent deterioration trends for bridge elements over the course of planning by making use of a set of GA chromosome and auxiliary matrices. The applicability of the proposed model was tested using a network of bridges in Kohgiluyeh and Boyer Ahmad province in southwestern Iran managed by RMTO (the bridge maintenance management body of Iran's Department of Transportation). The results of the model implementation showed an improvement in the average service level of the bridge network, with similar costs to those of the current maintenance planning approach adopted by RMTO. The proposed model was based on regular input data normally created by a BMS. For example, in RMTO case study, only available data in RMTO database was used; no additional data was collected for running the proposed model. The complexity involved in the proposed model was mostly handled by existing computer programs. However, training sessions were required for BMS planners and decision makers to be able to set up and run the developed computer program as part of their normal operations. Ultimately, the result of the model presented an updated prioritization for annual bridge maintenance activities undertaken by the maintenance team.
References
1. IAM (the Institute of Asset Management) \Asset management - an anatomy", The Institute of Asset Management, 1.1 (2012).
2. Ranjbaran, J. \Unforeseen photos of Kan bridge collapse", KhabarOnline News, News number 4547, (Dec. 24, 2012), (in Persian), Available: http://www.khabaronline.
3. Tabnak \One casualty on bridge collapse", Tab-nak News Agency, News number 123379, (Nov. 3, 2015), (in Persian), Available: http://ostanha. tab-nak.ir/fa/news/123379.
4. ASCE (American Society of Civil Engineers) \Report card for America's infrastructure", Report American Society of Civil Engineers, Available: http://www.infrastructurereportcard.org/bridges (2015).
5. Gholami, M., Sam, A.R.B.M., and Yatim, J.M. \Assessment of bridge management system in Iran", Procedia Engineering, 54, pp. 573-583 (2015).
6. Hicks, R.G., Dun, K., and Moulthrop, J.S. \Frame-work for selecting eective preventive maintenance treatments for exible pavement", Transportation Re-search, Record 1597, pp. 1-10 (1997).
7. Al-Barqawi, H. and Zayed, T. \Assessment model of water main conditions", Pipeline Division Specialty Conference, Chicago, USA (2006).
8. Goldberg, D. \Genetic algorithms in search, optimiza-tion, and machine learning", Addison-Wesley Long-man Publishing Co., Inc. Boston, MA, USA (1989).
9. Elhakeem, A. and Hegazy, T. \Building asset manage-ment with deciency tracking and integrated life cycle optimisation", Journal of Structure and Infrastructure Engineering, 8(8), pp. 729-738 (2012).
10. Rashedi, R. \Large-scale asset renewal optimization: GAs+ segmentation versus advanced mathematical tools", M.Sc. Thesis, University of Waterloo, Ontario, Canada (2011).
11. Rashedi, R. and Hegazy, T. \Capital renewal opti-mization for larscale infrastructure networks: ge-netic algorithms versus advanced mathematical tools", Structure and Infrastructure Engineering, 11(3), pp. 253-262 (2014).
12. Albattaineh, H. \Infrastructure intermediate-level modeling and optimization of budget allocation", Ph.D. Thesis, University Of Alberta, Alberta, Canada (2007).
13. Elbehairy, H. \Bridge management system with in-tegrated life cycle cost optimization", Ph.D. Thesis, University of Waterloo, Ontario, Canada (2007).
14. NDR (Nebraska Department of Roads), \Developing deterioration models for Nebraska bridges", Report Project number: SPR-P1(11) M302 (2011).
15. Morcous, G., Rivard, H., and Hanna, A.M. \Modeling bridge deterioration using case based reasoning", Jour-nal of Infrastructure Systems, 8(3), pp. 86-95 (2002).
16. Huang, R.Y., Mao, I.S., and Lee, H.K. \Exploring the deterioration factors of RC bridge decks: A rough set approach", Computer-Aided Civil and Infrastructure Engineering, 25(7), pp. 517-529 (2010).
17. SCI (Statistical Center of Iran) \The census result of 2016-2017", Statistical center of Iran, Available: https://www.amar.org.ir/Portals/0/census/
1395/results/tables/jamiat/kolli/1-koli-jamiat.xls (2017).
18. USCB (U.S. Census Bureau), Annual Estimates of the Resident Population for the United States, Regions, States, and Puerto Rico: April 1, 2010 to July 1, 2015. U.S. Census Bureau, Available: http://www.census.gov/popest/data/state/totals/ 2015/tables/NST-EST2015-01.csv (2015).
19. IPRCI (Islamic Parliament Research Center of the Islamic Republic of Iran), \Vehicle per capital of Iran", Khordadnews, newcode: 44790 (Mar. 4, 2014), Available: http://khordadnews.ir/fa/news/44790.
20. OHPI (Oce of Highway Policy Information) \State motor-vehicle registrations", Oce of Highway Policy Information, U.S. Department of Transportation Fed-eral Highway Administration, (January 2017), Avail-able: https://www.fhwa.dot.gov/policyinformation/ statistics/2015/mv1.cfm.
21. Razali, N.M. and Geraghty, J. \Genetic algorithm per-formance with dierent selection strategies in solving TSP", The World Congress on Engineering, 2, pp. 1134-1139 (2011).
22. IRIMO (Islamic Republic of Iran Meteorological Or-ganization), Access to historical climate data-Yasuj, Available: http://www.irimo.ir/, retrieved March 14 (2016).
23. UCD (US Climate Data), Report Climate Lincoln -Nebraska, Available: http://www.usclimatedata .com/, retrieved March 14 2016.
Biographies
Hamed Alikhani received BSc degree in Civil En-gineering from University of Tehran, Tehran, Iran, in 2012 and MSc degree in Construction Engineering and Management from Sharif University of Technology, Tehran, Iran, in 2014. His research interests are infras-tructure asset management, environmental assessment of infrastructures, and building information modeling. Amin Alvanchi has been an Assistant Professor in the Department of Civil Engineering, with specializa-tion in construcspecializa-tion engineering and management, at Sharif University of Technology, Tehran, Iran, since February 2013. He received his PhD in Construction Engineering and Management from the University of Alberta, Canada, in 2011. His area of research focuses on construction project management, building informa-tion modeling, construcinforma-tion operainforma-tion simulainforma-tion, and contract administration.
![Table 3. Weather conditions comparison between capitals of Kohgiluyeh and Boyer Ahmad, Yasuj [22], and](https://thumb-us.123doks.com/thumbv2/123dok_us/8367000.2222164/10.892.69.418.205.332/table-weather-conditions-comparison-capitals-kohgiluyeh-boyer-ahmad.webp)