Evaluation of cytochrome P450-derived
eicosanoid metabolites as a biomarker for
predicting cardiovascular outcomes in
patients with stable coronary artery disease
Nan Wang, PharmD Candidate
UNC Eshelman School of Pharmacy
Honor’s project paper
Advisor: Craig R. Lee, PharmD, PhD
Advisor: Craig Lee
Introduction
Coronary artery disease (CAD) is one of the leading causes of morbidity and
mortality worldwide, despite of significant advances in its management and treatment1.
Recent advancement in understanding the pathophysiology of CAD allows
identifications of potential novel therapeutic targets that may improve clinical outcomes, especially in the patients who are treatment refractory or still experience poor outcome despite of receiving standards of care. It is well accepted now that inflammation plays a key role in the formation and destabilization of atherosclerotic plaques, leading to CAD
clinical events such as myocardial infarction2.
In addition to their well-known role as xenobiotic metabolizing enzymes, cytochrome P450 (CYP) enzymes are also part of the arachidonic acid metabolism pathway, which produces metabolites that regulate numerous downstream cellular and physiologic processes. Most notably, the cytochrome P450 (CYP) epoxygenase
enzymes CYP2J and CYP2C catalyze the epoxidation of arachidonic acid to epoxyeicosatrienoic acids (EETs), which exhibit potent vasodilatory and
anti-inflammatory effects in preclinical models3. However, they are rapidly hydrolyzed to less
bioactive dihydroxyeicosatrienoic acids (DHETs) by soluble epoxide hydrolase (sEH). In
parallel, CYP4F and CYP4A 𝜔-hydroxylases generate 20-hydroxyeicosatetreanoic acid
(20-HETE), which is a potent vasoconstrictor and has pro-inflammatory effects4.
Increasing EET levels by inhibiting its hydrolysis and inhibition of 20-HETE biosynthesis have demonstrated cardioprotective effects beyond just maintaining vascular tone. Some suggested mechanisms include inhibiting endothelial activation and leukocyte adhesion via attenuation of nuclear factor-kappaB activation, inhibiting hemostasis, protecting against myocardial ischemia–reperfusion injury, and promoting endothelial
cell survival via modulation of multiple cell signaling pathways5.
An accumulating body of preclinical evidence has demonstrated the
cardiovascular protective effects of EETs5. Lower 14,15-EET:DHET ratios (higher sEH
metabolic function) and lower EET levels are associated with vascular dysfunction and
pro-inflammatory phenotypes predictive of poor prognosis6. Association between
functional polymorphisms in genes responsible for EET biosynthesis (CYP2C8, CYP2J2)
Advisor: Craig Lee variability suggests that the subset of CAD patients with low EET levels may be
predisposed to poor CV outcomes and may benefit from interventions that promote
biological effects of EETs3. Plasma 20-HETE levels were found to be associated with
endothelial dysfunction, which could be linked to poor CV outcomes6. Unfortunately,
due to the technical complexity of quantifying EET and 20-HETE levels, which are present at low concentrations in blood and tissue, these metabolites are not commonly quantified on traditional metabolomic or eicosanoid analytical platforms. As a
consequence, major gaps in knowledge surrounding the biological and therapeutic importance of CYP-derived eicosanoids in human CAD exist.
Before we can translate this information to clinical application, we need to fill the knowledge gap by establishing the direct association of metabolic function of the CYP epoxygenase/EET pathway and cardiovascular outcomes. The main objective of this study is to evaluate the relationship between the function of CYP-derived EETs
metabolic pathway and major cardiovascular outcomes in patients with stable CAD. This will provide insight into whether metabolites involved in the pathway can be used as biomarkers in predicting prognosis of CAD. In addition, it will offer insight into which subset of the patient population will most likely to respond and benefit from novel therapies in development that manipulate these pathways.
In patients with stable coronary artery disease (CAD), low-dose aspirin is indicated to suppress cyclooxygenase-mediated thromboxane (TxA2) biosynthesis in
platelets and reduce risk of major adverse cardiovascular events (MACE)7. However,
approximately 30% of TxA2 is produced by extraplatelet sources8, which may contribute
to CAD progression. Preclinical studies have demonstrated that in addition to its effects in platelet activation, TxA2 also has pro-inflammatory effects in the cardiovascular system that promote the development, growth and destabilization of atherosclerotic
plaques9. On the other hand, another regulator of platelet functions, prostacyclin (PGI2),
has potent vasodilatory and anti-inflammatory effects7. The clinical implications,
Advisor: Craig Lee
Methods
Study Population
This is retrospective observational study. A cohort of 139 adult patients with angiographically confirmed CAD (defined as ≥50% stenosis in one or more major coronary arteries), were identified in the University of North Carolina (UNC) Cardiac
Catheterization Laboratory from October 2007 to November 201010. Exclusion criteria
included pregnancy, atrial fibrillation, left-ventricular systolic dysfunction (ejection
fraction ≤35%), current use of long-acting nitrates or insulin, active autoimmune disease, history of severe aortic stenosis, history of solid organ transplant or dialysis, or history of cancer within the previous 5 years. Blood samples were collected from these patients at
a single morning research study visit 61 ± 33 days from their index cardiac
catheterization after fasting overnight and withholding morning medications. All patients were clinically stable and chest pain free at research visit, and were classified as stable CAD patients.
Quantification of plasma eicosanoid metabolite
All plasma levels of P450-derived eicosanoid metabolite concentrations were measured by liquid chromatography with tandem mass spectrometry (LC-MS/MS) in 106 consecutive CAD patients enrolled from 2007-2010 in a previous study, as
described6. The specific biomarkers evaluated were sum EETs (the bioactive mediator
in the CYP epoxygenase/EET pathway), 14,15-EET:DHET ratio (biomarker for sEH
function), and 20-HETE (biomarker of 𝜔-hydroxylase pathway function).
Quantification of urine TxA2 stable metabolite
Concentrations of urinary stable metabolites of TxA2 and PGI2, 11-dehydro-thromboxane B2 (TxA2-M) and 2,3-dinor-6-keto-prostaglandin F1 alpha (PGI2-M), were measured using ELISA kit (Cayman Chemical, Ann Arbor, MI, USA) according to
Advisor: Craig Lee
Definition of major adverse cardiovascular events (MACE)
The primary endpoint, major adverse cardiovascular events (MACE) is defined as a composite of death due to any cause, hospitalization for non-fatal ACS events (unstable angina, non-ST segment elevation myocardial infarction [NSTEMI], STEMI), and hospitalization for non-fatal ischemic stroke or TIA. Secondary endpoints are each individual components of the composite, and an expanded MACE-revasc definition, which includes hospitalization for a coronary revascularization procedure (PCI or CAGB) in addition to MACE. Time-to-event from index research visit to first occurrence of MACE or last follow-up were also measured in each patient.
The incidence of MACE were collected from electronic medical record at UNC health care system. If the patients did not come back to UNC for routine follow-up or emergent care, they were considered lost to follow-up and are excluded from analysis. By the end of this study, this patient population should have had 4-8 years of follow-up time.
Statistical analysis
Data are presented as mean ± standard deviation, median (interquartile range), or count (%) unless otherwise indicated. All analyses were performed using JMP Pro 12.0.1 (SAS Institute, Cary, NC).
Study population characteristics were described using descriptive statistics, and were compared across those with or without a MACE event using one-way ANOVA for continuous data and chi-squared test or Fisher’s exact test for categorical data as appropriate. Any variables that were not normally distributed were log-transformed. An association with p<0.05 is considered to be statistically significant. All analyses
conducted with MACE were also repeated with the exploratory outcome MACE-revasc. The primary analysis was comparing log-transformed baseline plasma CYP eicosanoid metabolite levels (sum EETs, sum EETs + DHETs, 14,15-EET/DHET ratio, 20-HETE) across patients with or without a future MACE event using one-way ANOVA, and using chi-square to compare frequency of future MACE when baseline plasma eicosanoid levels were grouped into tertiles.
Advisor: Craig Lee were not taking aspirin at baseline, which were expected to have highest urine TxA2-M level. To ensure these 3 patients were not driving the association between TxA2-M and MACE, analyses were repeated in the population taking aspirin at baseline (n=109).
Proportional hazard regression was used to evaluate the relationship between time to occurrence of first MACE (or MACE-revasc) and clinical factors, eicosanoid tertiles, and urine metabolite tertiles. Kaplan-Meier curves were generated using GraphPad Prism 6.0.
To adjust for potential confounders of any observed associations, multivariable adjusted analyses were conducted to account for any demographic and clinical factors that were independently associated with MACE.
Results
Study population
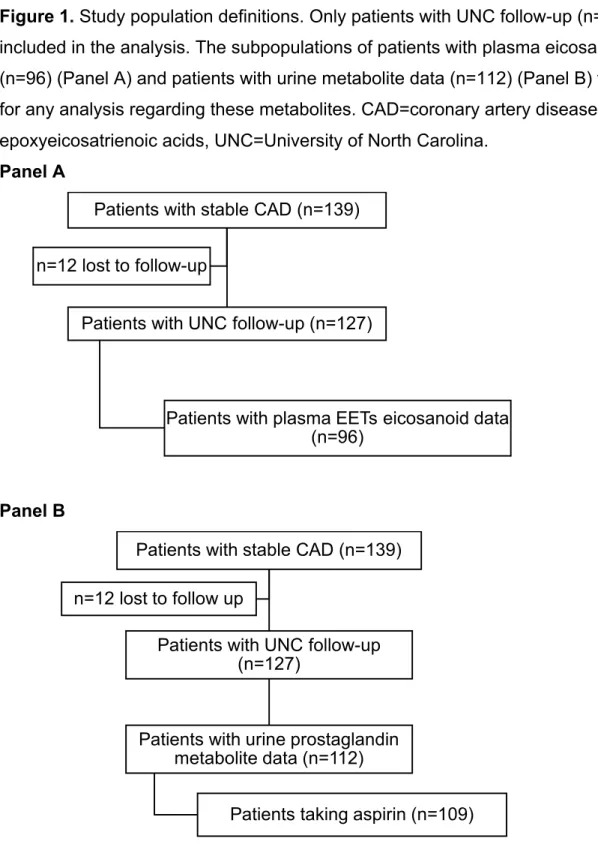
In the original study, 139 patients with stable CAD were enrolled, and 127 of them had follow-up visits after the initial research visit at UNC Health Care system, thus were included in the analysis. 96 of these patients had plasma eicosanoids quantified, and this population was used in all analysis with EETs eicosanoid metabolites. Urine TxA2-M and PGI2-M levels were quantified in 112 patients with available follow-up data (Figure 1).
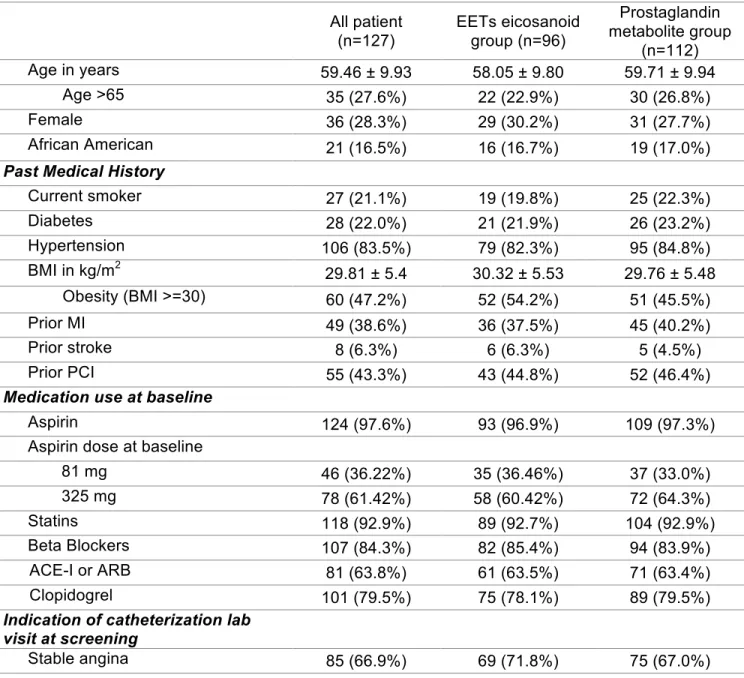
Baseline characteristics are similar in the overall population (n=127), population with EETs eicosanoid metabolites data (n=96), and population with urine prostaglandin metabolites data (n=112) (Table 1). In overall population, mean age is 59 years old, with 28.3% female and 16.5% African Americans. 22% of patients had diabetes, 38.6% had prior MI. On screening catheterization visit, 33.1% of patients had ACS, 65.4% had multivessel disease, and 61.4% had a coronary artery stent placed. At baseline, 97.6% of patients were taking aspirin (3 patients not taking), and most patients were on
guideline directed medical therapy for CAD.
MACE and MACE-revasc event rates
Advisor: Craig Lee population (n=127), MACE occurred in 28.3% of patients, and MACE-revasc occurred in 36.2% of patients. The most likely first MACE event was ACS (20.5%), and unstable angina was the most likely ACS event. Median follow-up time in this population was 5.64 years. Median time to first MACE or last follow-up was 4.75 years. In the patient populations where EETs eicosanoid data (n=96) and urine prostaglandin metabolite data (n=112) were available, event rates and time-to-event were similar to those in the overall population (Table 2).
Associations between clinical factors and outcomes (MACE and MACE-revasc) were summarized in Table 3. Multivessel disease was an independent predictor of both MACE and MACE-revasc. In addition, diabetes, aspirin use, HDL and triglyceride levels were also independently associated with MACE-revasc, but results from proportional hazard analysis were not statistically significant for these clinical factors.
Plasma eicosanoid metabolites and outcomes
In the population where plasma eicosanoid data were available (n=96), none of the CYP eicosanoid metabolite biomarkers analyses showed statistically significant association with either MACE or MACE-revasc (Table 4). As mentioned above, EETs are the bioactive metabolite of the pathway that had shown vasodilatory and
cardioprotective effects in previous preclinical studies. Sum EETs + DHETs is a
biomarker for the CYP enzyme functions of this pathway, while 14,15-EET/DHET ratio is a biomarker for sEH function. 20-HETE is a vasoconstrictor and has pro-inflammatory
effect. It was shown to be associated with vascular dysfunction in previous study6.
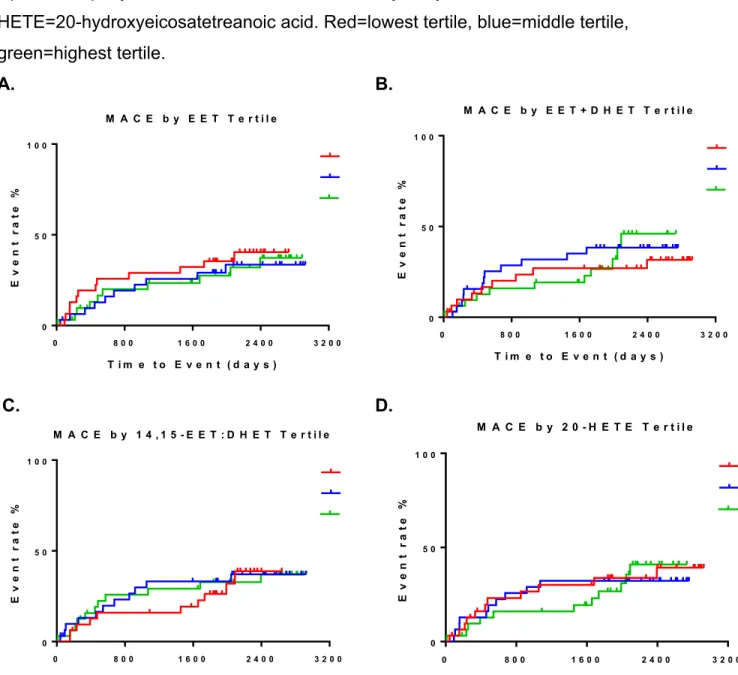
In addition, no statistically significant associations were observed with either MACE or MACE-revasc when patients were grouped in tertiles based on baseline eicosanoid biomarker levels. Proportional hazard analysis did not yield any statistically significant results between baseline tertiles and either outcomes as well (Table 5 and Figure 2).
Urine metabolites (TxA2 and PGI2) and outcomes
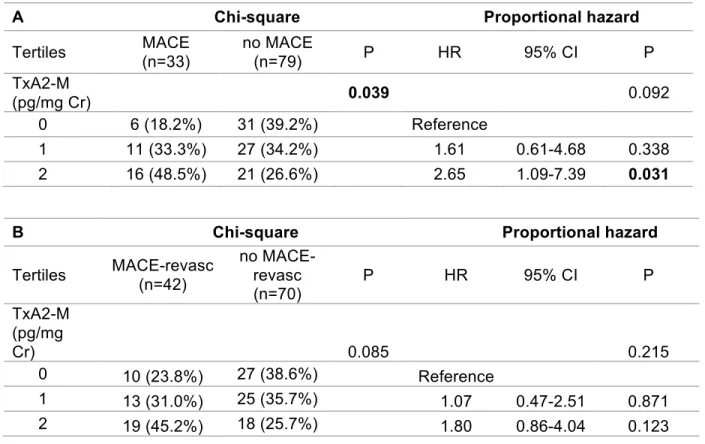
Advisor: Craig Lee without a future event; however, these differences were not statistically significant (p equal 0.098 and 0.064, respectively) (Table 6). When baseline TxA2-M levels were grouped into tertiles, a significantly higher rate of MACE was observed across the lowest (18%), middle (33%) and highest (48%) TxA2-M tertiles (p=0.039). Compared to the lowest TxA2-M tertile, the highest tertile was associated with a significantly higher risk of MACE (hazard ratio 2.65, 95%CI 1.09-7.39, p =0.031); the middle tertile, however, did not exhibit a significantly higher risk of MACE (hazard ratio 1.61, 95%CI 0.61-4.68, p=0.338) (Table 7A, Figure 3). The relationship between TxA2-M tertiles and MACE-revasc exhibits a similar trend, where MACE-revasc was observed more
frequently with higher TxA2-M tertiles, and higher baseline TxA2-M tertile was
associated with a higher risk for future MACE-revasc, although these results were not statistically significant (Table 7B, Figure 3).
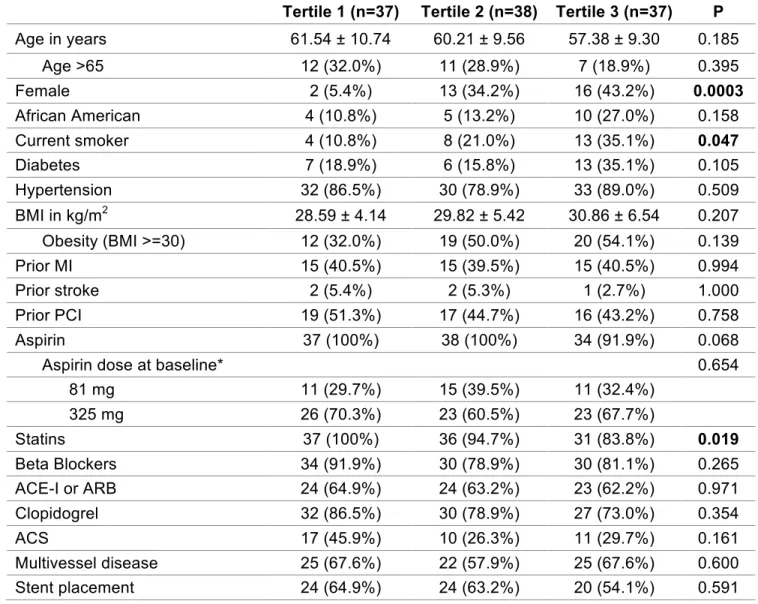
Since aspirin can lower TxA2 level, and is known to have cardioprotective effect, the use and dose of aspirin can potentially be confounding factors between the
observed association of TxA2-M tertile and MACE. As expected, the patients who were not taking aspirin at baseline (n=3) had the highest TxA2 level (median[IQR] 2382.76 [1614.63]), as compared to 37 patients on aspirin 81 mg (median[IQR] 838.98 [137.6]) and 72 patients on aspirin 325 mg (TxA2 median[IQR] 635.51 [539.7]). Median[IQR] of TxA2-M in healthy volunteers was 1990 pg/mgCr [1050]. Two of the three patients not taking aspirin had a MACE event, and all three had a MACE-revasc event. To confirm that the observed association between TxA2-M tertile and MACE was not solely driven by the use of aspirin, the above analyses were repeated with the three non-aspirin users excluded (n=109). The general trends persisted, however, the p value from chi-square and logistic regression analyses were above 0.05 (p=0.0662 and 0.0619 respectively). The association seen between highest TxA2-M tertile and MACE
continued to be statistically significant in proportional hazard analysis (HR [95%CI] 2.51 [1.01-7.10], p=0.048).
Advisor: Craig Lee dose, age, sex, and race. Therefore, these 6 covariates (diabetes, multivessel disease, aspirin dose, age>65, sex, race) were adjusted in a multivariable model to confirm the association between TxA2-M tertiles and MACE, in the whole TxA2-M population
(n=112) and population taking aspirin (n=109) (Table 9). The association between TxA2-M and TxA2-MACE persisted after adjusting for these covariates (Table 9).
Discussions
Inflammation has been well recognized as a key player in the pathogenesis of
CAD2. Metabolites of arachidonic acid metabolic pathways, catalyzed by CYP enzymes,
exhibit potent pro-inflammatory (EETs) or anti-inflammatory (20-HETE) effects3,4.
Metabolites of the prostaglandin metabolite pathway, TxA2 and PGI2, have also been shown to have pro-inflammatory and anti-inflammatory effects, respectively, in addition
to their roles in platelet regulation7,9. This study investigated the relationship between
these arachidonic acid derived metabolites with major cardiovascular outcomes in order to translate our understanding of these pathways into clinically relevant applications. The current study did not find an association between CYP-derived EET or 20-HETE levels with MACE. On the other hand, elevated TxA2-M levels appeared to be
associated with worse cardiovascular prognosis in patients with stable CAD, and this association was independent of aspirin use and dose at baseline. This suggests that extraplatelet sources of TxA2 may be an important driver of CAD progression and poor cardiovascular outcomes.
EETs are metabolites produced from arachidonic acids by CYP2J and CYP2C through epoxidation, and are subsequently rapidly hydrolyzed to less bioactive DHETs by sEH. As mentioned above, EETs have demonstrated potent vasodilatory,
anti-inflammatory and cardioprotective effects in a variety of preclinical models5. In parallel,
20-HETE, generated by CYP4F and CYP4A 𝜔-hydroxylases, promote vasoconstriction,
inflammation and myocardial injury in preclinical models4. A previous clinical study
found that patients with obstructive CAD were predisposed to have low EETs levels
secondary to suppressed EET biosynthesis11. Furthermore, higher plasma 20-HETE
levels and enhanced sEH metabolic function were shown to be associated with vascular
well-Advisor: Craig Lee established biomarker of prognosis in patients with established CAD. However, this current study did not observe an association between function of CYP-derived metabolic pathways and MACE in patients with stable CAD. Importantly, based on preclinical evidence, novel pharmacologic agents to increase EET levels (sEH
inhibitors) or to decrease 20-HETE levels (CYP 𝜔-hydroxylase inhibitors) are currently
in development, and are hypothesized to be a promising therapeutic strategy for the secondary prevention of MACE in patients with established CAD in addition to standard therapy. Based on our current study, the association between metabolite biomarkers of these pathways and prognosis of CAD cannot be established. Future studies in a larger population are needed to validate the lack of a significant relationship between CYP-derived eicosanoid levels and clinical outcomes in patients with stable CAD, as well as help to identify the subset of patients who are most likely to respond and benefit from these new therapies.
TxA2 is a potent pro-thrombotic and pro-inflammatory mediator that regulates vascular reactivity, platelet activation, and cardiac function; while anti-thrombotic and
anti-inflammatory PGI2 poses opposite effects on these processes9. Arachidonic acid is
converted to intermediate mediator prostaglandin H2 by cyclooxygenases (COX-1 and COX-2) and further metabolized to a variety of bioactive molecule, including TxA2 and
PGI2, by tissue-specific isomerases7. Low-dose aspirin used for prevention of MACE
specifically targets COX-1 in platelets, thus blocking biosynthesis of TxA2 in platelets without significantly suppressing PGI2 biosynthesis in endothelial cells. However, about 30% of TxA2 is produced from extraplatelet sources, including major inflammatory cells
monocytes and macrophages in atherosclerotic lesions8. TxA2 is rapidly converted to
more chemically stable and relatively biologically inactive metabolite TxB2, then further metabolized to stable urinary metabolite 11-dehydro-thromboxane B2 (M).
TxA2-M serves as a reliable measure of total in vivo TxA2 including extraplatelet sources8. In
this current study, higher baseline TxA2-M levels in urine was observed to be
Advisor: Craig Lee Our observation of elevated TxA2-M levels being associated with poor
cardiovascular outcomes in patients with stable CAD is consistent with previous literature reports (Table 10). In patients with stable established CAD or multiple risk factors, Eikelboom et al. reported 1.66-1.8 fold increased risk of MACE (composite of MI, stroke, and cardiovascular death) in patients with highest quartile of TxA2-M
compared to those in the lowest quartiles13,14. In addition, in patients with acute MI
presented for primary PCI, Szczeklik et al. also found an 3.66 fold increased risk of MACE (composite of MI, stroke/TIA, cardiogenic shock pulmonary edema, nonfatal cardiac arrest, need for rescue PCI/CABG, and cardiovascular death) in patients with
highest TxA2-M quartile compared to those with lowest quartiles15. Similarly, we
observed a 2.65 fold (proportional hazard regression) or 3.94 (logistic regression) increased risk of MACE in patients with highest TxA2-M tertile compared to those with lowest tertile (Table 9), although definition of MACE in all these studies are slightly different. Importantly, compared to Heart Outcomes Prevention Evaluation (HOPE) Study and Clopidogrel for High Atherothrombotic Risk and Ischemic Stabilization, Management and Avoidance (CHARISMA) Study, which were used as data sources by Eikelboom et al., our patient population exhibited a higher percentage of patients on guideline-directed medical therapy for CAD, yet elevated TxA2-M was still observed to be associated with poor cardiovascular outcome, suggesting additional interventions may be needed in this subset of patients.
Importantly, the observed increased cardiovascular risk with elevated TxA2-M is independent of aspirin treatment or dose at baseline. Aspirin irreversibly inhibits platelet COX-1, and there are individuals whose COX-1, or any gene involved in the pathway that converts arachidonic acid to TxA2 and TxB2, has a single nucleotide
polymorphisms (SNPs) that makes them less responsive to aspirin’s inhibition of platelet function in laboratory. However, SNPs associated with impaired laboratory response to
aspirin were found not to be significantly associated with clinical outcomes16, although
recent work had suggested that RNA profiles of platelet-specific genes could be used as novel biomarkers in identifying the subset of patients who might not respond to aspirin
adequately and who were at increased risk for death and MI17,18. Nonetheless, genetic
Advisor: Craig Lee baseline TxA2-M elevation observed in this study. Alternatively, TxA2 production from extraplatelet sources is not inhibited by low-dose aspirin. Inflammatory (monocytes and macrophages) and endothelial cells produce TxA2 via COX-2 pathway, and inhibition of
these COX-2 pathways requires much higher doses of aspirin than daily low dose19.
Arachidonic acid is metabolized in these alternative COX-2 pathways to prostaglandin H2, which can be shunted to platelets and further converted to TxA2 bypassing platelets COX-1, or can directly be converted to TxA2 in inflammatory and endothelial cells. This residue TxA2 not inhibited by aspirin, can activate platelets, and may be important in the pathogenesis of ACS. In fact, TxA2 was shown to be elevated during acute MI, and
correlated with inflammatory markers during the acute phase15. TxA2-M levels decrease
substantially when patients are out of the acute phase, but this cannot solely be
explained by the long-term use of aspirin after MI15. The current study, together with
previous studies, demonstrated that chronically elevated TxA2-M levels, despite aspirin
treatment, was associated with higher risk of future MACE13,14,20.
Novel agents targeting thromboxane pathway have been in clinical
development21–23, namely thromboxane synthase inhibitors (TXSI), thromboxane
receptor antagonists (TXRA), or dual action agents that combines the two. TXSIs aim to reduce biosynthesis of TxA2, mainly in platelets, by preventing conversion of PGH2 to effector TxA2. On the other hand, TXRAs block downstream effects of thromboxane receptors (TP), activated not only by TXA2, but also other ligands such as eicosanoids, endoperoxides, and isoprostanes. Expression of TPs is not limited to platelets. They are also expressed in inflammatory cells like macrophages and monocytes, as well as
vascular endothelial cells and in atherosclerotic plaques21,22. Theoretically, compared to
aspirin, TXSIs should be more selective, and TXRAs should exert additional benefit in inhibiting effects from not only platelet TxA2, but also extraplatelet TxA2 as well as endoperoxides and isoprostanes. Picotamide (dual TXSI/TXRA), ridogrel (dual
TXSI/TXRA), and terutroban (TXRA) have all been studied clinically in patients with risk
factors for thrombotic events21,22. However, results did not confirm substantial benefit
over aspirin22,23, making it less desirable for industry to continue their development to
Advisor: Craig Lee observed relationship between elevated TxA2-M and prognosis of CAD, TxA2-M can potentially be used as a biomarker to guide therapy. That is rather than trying to replace aspirin with the novel TXSI/TXRA agents in the general population, these agents may be used in addition to aspirin in the subset of CAD patients who have persistently elevated TxA2-M level despite being on low-dose aspirin to further block the action of the thromboxane pathway. This biomarker-guided treatment approach may help to identify the patient population who can benefit the most from these novel agents.
Further studies may be warranted to test the clinical effects of TXSI/TXRA as an adjunct to aspirin in this more selective patient population.
Limitations of this study include its retrospective design and limited sample size. The observational design of this study precludes us from establishing causality between increased risk of MACE and elevated TxA2-M level. Furthermore, evaluation of multiple metabolites included multiple statistical comparisons, increasing the risk of
false-positive findings. Lastly, urinary TxA2 metabolites were measured in 112 of the 127 evaluable patients enrolled in the study, which can potentially introduce selection bias. However, the baseline characteristics of patients in the cohort with urinary metabolite data are very similar to those of the overall population (Table 1), suggesting selection bias is unlikely. Nonetheless, the observed relationship requires validation in an independent population.
Although preclinical studies showed promising results suggesting
Advisor: Craig Lee levels in addition to guideline directed medical therapy. This demonstrates the potential value of using TxA2-M as a biomarker to predict cardiovascular outcomes, as well as to guide therapy selection. Future studies are needed to validate these results in a larger population, to investigate the causes of increased extraplatelet TxA2 biosynthesis in certain individuals, and to develop therapeutic interventions that mitigate the risk of elevated TxA2 levels in CAD patients on aspirin therapy.
References
1. Mozaffarian, D. et al. Executive Summary: Heart Disease and Stroke Statistics—
2016 Update:: A Report From the American Heart Association. Circulation133, 447–
454 (2016).
2. Hansson, G. K. Inflammation, atherosclerosis, and coronary artery disease. N.
Engl. J. Med.352, 1685–1695 (2005).
3. Oni-Orisan, A., Alsaleh, N., Lee, C. R. & Seubert, J. M. Epoxyeicosatrienoic
acids and cardioprotection: the road to translation. J. Mol. Cell. Cardiol.74, 199–208
(2014).
4. Waldman, M., Peterson, S. J., Arad, M. & Hochhauser, E. The role of 20-HETE in
cardiovascular diseases and its risk factors. Prostaglandins Other Lipid Mediat.125,
108–117 (2016).
5. Deng, Y., Theken, K. N. & Lee, C. R. Cytochrome P450 epoxygenases, soluble
epoxide hydrolase, and the regulation of cardiovascular inflammation. J. Mol. Cell.
Cardiol.48, 331–341 (2010).
6. Schuck, R. N. et al. Cytochrome P450-derived eicosanoids and vascular
dysfunction in coronary artery disease patients. Atherosclerosis227, 442–448 (2013).
7. Patrono, C., García Rodríguez, L. A., Landolfi, R. & Baigent, C. Low-dose aspirin
for the prevention of atherothrombosis. N. Engl. J. Med.353, 2373–2383 (2005).
8. Frelinger, A. L. et al. Aspirin ‘resistance’: role of pre-existent platelet reactivity
and correlation between tests. J. Thromb. Haemost. JTH6, 2035–2044 (2008).
9. Gabrielsen, A. et al. Thromboxane synthase expression and thromboxane A2
production in the atherosclerotic lesion. J. Mol. Med. Berl. Ger.88, 795–806 (2010).
10. Lee, C. R. et al. Relation between digital peripheral arterial tonometry and
brachial artery ultrasound measures of vascular function in patients with coronary artery
disease and in healthy volunteers. Am. J. Cardiol.109, 651–657 (2012).
11. Oni-Orisan, A. et al. Cytochrome P450-derived epoxyeicosatrienoic acids and
coronary artery disease in humans: a targeted metabolomics study. J. Lipid Res.57,
109–119 (2016).
12. Patrono, C. et al. Estimated rate of thromboxane secretion into the circulation of
normal humans. J. Clin. Invest.77, 590–594 (1986).
13. Eikelboom, J. W. et al. Aspirin-resistant thromboxane biosynthesis and the risk of
myocardial infarction, stroke, or cardiovascular death in patients at high risk for
Advisor: Craig Lee
14. Eikelboom, J. W. et al. Incomplete inhibition of thromboxane biosynthesis by
acetylsalicylic acid: determinants and effect on cardiovascular risk. Circulation118,
1705–1712 (2008).
15. Szczeklik, W. et al. Urinary 11-Dehydro-Thromboxane B2 as a Predictor of Acute
Myocardial Infarction Outcomes: Results of Leukotrienes and Thromboxane In
Myocardial Infarction (LTIMI) Study. J. Am. Heart Assoc.5, e003702 (2016).
16. Voora, D., Horton, J., Shah, S. H., Shaw, L. K. & Newby, L. K. Polymorphisms
associated with in vitro aspirin resistance are not associated with clinical outcomes in
patients with coronary artery disease who report regular aspirin use. Am. Heart J.162,
166–172.e1 (2011).
17. Voora, D. et al. Aspirin exposure reveals novel genes associated with platelet
function and cardiovascular events. J. Am. Coll. Cardiol.62, 1267–1276 (2013).
18. Voora, D. et al. Systems Pharmacogenomics Finds RUNX1 Is an
Aspirin-Responsive Transcription Factor Linked to Cardiovascular Disease and Colon Cancer.
EBioMedicine11, 157–164 (2016).
19. Halushka, M. K. & Halushka, P. V. Why Are Some Individuals Resistant to the
Cardioprotective Effects of Aspirin? Circulation105, 1620–1622 (2002).
20. Frelinger, A. L. et al. Association of cyclooxygenase1dependent and
-independent platelet function assays with adverse clinical outcomes in aspirin-treated
patients presenting for cardiac catheterization. Circulation120, 2586–2596 (2009).
21. Davì, G., Santilli, F. & Vazzana, N. Thromboxane receptors antagonists and/or
synthase inhibitors. Handb. Exp. Pharmacol. 261–286 (2012).
doi:10.1007/978-3-642-29423-5_11
22. Ferreiro, J. L. & Angiolillo, D. J. New Directions in Antiplatelet Therapy. Circ.
Cardiovasc. Interv.5, 433–445 (2012).
23. Ritter, J. M. TP receptor antagonists (TXRAs): expensive irrelevance or wonder
drugs strangled at birth? Br. J. Clin. Pharmacol.71, 801–803 (2011).
24. Krasopoulos, G., Brister, S. J., Beattie, W. S. & Buchanan, M. R. Aspirin
‘resistance’ and risk of cardiovascular morbidity: systematic review and meta-analysis.
BMJ336, 195–198 (2008).
25. Gluckman, T. J. et al. Effects of aspirin responsiveness and platelet reactivity on
early vein graft thrombosis after coronary artery bypass graft surgery. J. Am. Coll.
Advisor: Craig Lee
Acknowledgement
I would like to gratefully acknowledge my advisor Dr. Craig R. Lee, for his relentless guidance and support throughout this project.
I would also like to acknowledge the following former members of the Lee Laboratory and collaborators at NIH/NIEHS and UNC Division of Cardiology, for generating the eicosanoid data, as well as the UNC Honor’s Program for providing this opportunity.
Lee Lab
Kimberly Vendrov, BS
Brian Simmons, PharmD, MS Katherine Theken, PharmD, PhD Robert Schuck, PharmD, PhD Akinyemi Oni-Orisan, PharmD, PhD
UNC Cardiology
George A. Stouffer, MD
NIH/NIEHS
Advisor: Craig Lee
Tables
Table 1. Baseline characteristics of stable CAD patients with UNC follow-up. Data are
presented as count (%), median (interquartile range), and mean ±SD unless otherwise
indicated. EETs= epoxyeicosatrienoic acids, MI = myocardial infarction, BMI=body mass index, PCI=percutaneous coronary intervention, CABG=coronary artery bypass graft, ACE-I=angiotensin-converting enzyme inhibitor, ARB=angiotensin receptor blocker, NSTEMI=non-ST segment elevation myocardial infarction, STEMI=ST segment elevation myocardial infarction, LDL=low-density lipoprotein, HDL=high-density lipoprotein.
All patient (n=127)
EETs eicosanoid group (n=96)
Prostaglandin metabolite group
(n=112)
Age in years 59.46 ± 9.93 58.05 ± 9.80 59.71 ± 9.94
Age >65 35 (27.6%) 22 (22.9%) 30 (26.8%)
Female 36 (28.3%) 29 (30.2%) 31 (27.7%)
African American 21 (16.5%) 16 (16.7%) 19 (17.0%)
Past Medical History
Current smoker 27 (21.1%) 19 (19.8%) 25 (22.3%)
Diabetes 28 (22.0%) 21 (21.9%) 26 (23.2%)
Hypertension 106 (83.5%) 79 (82.3%) 95 (84.8%)
BMI in kg/m2 29.81 ± 5.4 30.32 ± 5.53 29.76 ± 5.48
Obesity (BMI >=30) 60 (47.2%) 52 (54.2%) 51 (45.5%)
Prior MI 49 (38.6%) 36 (37.5%) 45 (40.2%)
Prior stroke 8 (6.3%) 6 (6.3%) 5 (4.5%)
Prior PCI 55 (43.3%) 43 (44.8%) 52 (46.4%)
Medication use at baseline
Aspirin 124 (97.6%) 93 (96.9%) 109 (97.3%)
Aspirin dose at baseline
81 mg 46 (36.22%) 35 (36.46%) 37 (33.0%)
325 mg 78 (61.42%) 58 (60.42%) 72 (64.3%)
Statins 118 (92.9%) 89 (92.7%) 104 (92.9%)
Beta Blockers 107 (84.3%) 82 (85.4%) 94 (83.9%)
ACE-I or ARB 81 (63.8%) 61 (63.5%) 71 (63.4%)
Clopidogrel 101 (79.5%) 75 (78.1%) 89 (79.5%)
Indication of catheterization lab visit at screening
Advisor: Craig Lee
Unstable angina 21 (16.5%) 12 (12.5%) 18 (16.1%)
NSTEMI 18 (14.2%) 14 (14.6%) 16 (14.3%)
STEMI 3 (2.4%) 1 (1%) 3 (2.7%)
Catheterization lab findings and interventions
Multivessel disease 83 (65.4%) 65 (67.7%) 72 (64.3%)
Stent placement 78 (61.4%) 53 (55.2%) 68 (60.7%)
Post CABG 11 (8.7%) 10 (10.4%) 9 (8.0%)
Post revascularization 91 (71.7%) 65 (67.7%) 79 (70.5%)
Labs at baseline
Systolic blood pressure (mmHg) 133 (21) 133 (20) 133 (21) Diastolic blood pressure (mmHg) 78 (13) 79 (13) 78 (13)
Total cholesterol (mg/dL) 155 (53) 156 (49) 155 (53)
LDL (mg/dL) 85 (41) 84 (35) 84 (42)
HDL (mg/dL) 47 (17) 47 (17) 47 (17)
Triglyceride (mg/dL) 97 (80) 98 (74) 96 (84)
Advisor: Craig Lee
Table 2. Incidence and time-to-event rate of first MACE and MACE-revasc event in patients with stable CAD patients and UNC follow-up. Data are presented as count (%) and median (interquartile range) unless otherwise indicated. EETs= epoxyeicosatrienoic acids, MACE=major adverse cardiovascular event, ACS=acute coronary syndrome, TIA=transient ischemic attack, PCI=percutaneous coronary intervention,
CABG=coronary artery bypass graft, NSTEMI=non-ST segment elevation myocardial infarction, STEMI=ST segment elevation myocardial infarction.
All patient (n=127)
EETs eicosanoid group (n=96)
Prostaglandin metabolite group
(n=112)
MACE 36 (28.3%) 32 (33.3%) 33 (29.5%)
Death (all cause) 6 (4.7%) 6 (6.3%) 5 (4.5%)
ACS 26 (20.5%) 23 (24.0%) 24 (21.4%)
Unstable Angina 17 (13.4%) 16 (16.7%) 16 (14.3%)
NSTEMI 7 (5.5%) 5 (5.2%) 6 (5.4%)
STEMI 2 (1.6%) 2 (2.1%) 2 (1.8%)
Stroke/TIA 4 (3.2%) 3 (3.1%) 4 (3.6%)
Stroke 2 (1.6%) 1 (1.0%) 2 (1.8%)
TIA 2 (1.6%) 2 (2.1%) 2 (1.8%)
MACE-revasc 46 (36.2%) 40 (41.7%) 42 (37.5%)
Death (all cause) 6 (4.7%) 6 (6.3%) 5 (4.5%)
ACS 22 (17.3%) 19 (19.8%) 21 (18.8%)
Unstable Angina 13 (10.2%) 12 (12.5%) 13 (11.6%)
NSTEMI 7 (5.5%) 5 (5.2%) 6 (5.4%)
STEMI 2 (1.6%) 2 (2.1%) 2 (1.8%)
Stroke/TIA 4 (3.2%) 3 (3.1%) 4 (3.6%)
Stroke 2 (1.6%) 1 (1.0%) 2 (1.8%)
TIA 2 (1.6%) 2 (2.1%) 2 (1.8%)
Revascularization for stable CAD 14 (11.0%) 12 (12.5%) 12 (10.7%)
PCI 14 (11.0%) 12 (12.5%) 12 (10.7%)
CABG 0 (0%) 0 (0%) 0 (0%)
Time to events (in years)
Advisor: Craig Lee
Table 3. Clinical factors across patients with or without MACE (panel A) and MACE-revasc (panel B), as well proportional hazard analysis results for each outcome in n=127. P valued highlighted in bold indicates that the clinical factor is statistically significantly associated with outcomes. Data are presented as count (%), median
(interquartile range), and mean ±SD unless otherwise indicated. MI = myocardial
infarction, BMI=body mass index, PCI=percutaneous coronary intervention,
CABG=coronary artery bypass graft, ACE-I=angiotensin-converting enzyme inhibitor, ARB=angiotensin receptor blocker, NSTEMI=non-ST segment elevation myocardial infarction, STEMI=ST segment elevation myocardial infarction, LDL=low-density lipoprotein, HDL=high-density lipoprotein, BG=blood glucose, HR=hazard ratio, 95% CI=95% confidence interval.
A Chi-square/Fisher’s Exact, ANOVA Proportional Hazard
MACE (n=36)
no MACE
(n=91) P HR 95% CI p
Age in years 59.14 ± 1.66 59.58 ± 1.04 0.822
Age >65 8 (22.2%) 27 (29.7%) 0.397 0.72 0.31-1.51 0.403
Female 9 (25.0%) 27 (29.7%) 0.599 0.70 0.31-1.44 0.350
African American 6 (16.7%) 15 (16.5%) 0.980 1.04 0.39-2.32 0.935 Current smoker 9 (25.0%) 18 (19.8%) 0.517 1.40 0.62-2.86 0.400
Diabetes 12 (33.3%) 16 (17.6%) 0.054 1.82 0.88-3.57 0.103
Hypertension 29 (80.6%) 77 (84.6%) 0.579 0.90 0.42-2.24 0.806 BMI in kg/m2 30.95 ± 0.90 29.36 ± 0.56 0.135
Obesity (BMI ≥30) 20 (55.6%) 40 (44.0%) 0.238 1.48 0.77-2.91 0.238
Prior MI 16 (44.4%) 33 (36.2%) 0.393 1.34 0.68-2.58 0.389
Prior stroke 3 (8.3%) 5 (5.5%) 0.687 1.74 0.42-4.87 0.395
Prior PCI 17 (47.2%) 38 (41.8%) 0.575 1.28 0.65-2.45 0.474
Aspirin 34 (94.4%) 90 (98.9%) 0.193 0.37 0.11-2.30 0.238
Aspirin dose* 0.276
81 mg 10 (29.4%) 36 (40.0%)
325 mg 24 (70.6%) 54 (60.0%)
Statins 32 (88.9%) 86 (94.5%) 0.271 0.60 0.24-2.02 0.371
Beta Blockers 31 (86.1%) 76 (83.5%) 0.718 1.40 0.60-4.11 0.467 ACE-I or ARB 25 (69.4%) 56 (61.5%) 0.404 1.31 0.66-2.78 0.444 Clopidogrel 29 (80.6%) 72 (79.1%) 0.857 1.12 0.52-2.79 0.780
Advisor: Craig Lee
Multivessel disease 29 (80.6%) 54 (59.3%) 0.024 2.57 1.19-6.38 0.015
Stent placement 18 (50.0%) 60 (65.9%) 0.096 0.62 0.32-1.20 0.151
Post CABG 5 (13.9%) 6 (6.6%) 0.188 1.74 0.59-4.11 0.283
Post
revascularization 24 (66.7%) 67 (73.6%) 0.433 0.79 0.40-1.64 0.512 Systolic blood
pressure (mmHg) 135 (122-151) 133 (125-143) 0.794 Diastolic blood
pressure (mmHg) 79 (73-86) 78 (72-85) 0.724 Total cholesterol
(mg/dL) 167 (143-192) 154 (129-183) 0.407 LDL (mg/dL) 88 (71-114) 83 (62-104) 0.340
HDL (mg/dL) 45 (36-56) 48 (40-56) 0.271
Triglyceride (mg/dL) 110 (81-153) 94 (70-159) 0.279 BG (mg/dL) 96 (90-111) 96 (90-103) 0.998
*Only in patients who were taking aspirin at baseline, n=124
B Chi-square/Fisher’s Exact, ANOVA Proportional Hazard
MACE-revasc (n=46)
no
MACE-revasc (n=81) P HR 95% CI p
Age in years 59.89 ± 1.47 59.21 ± 1.11 0.712
Age >65 13 (28.3%) 22 (27.2%) 0.894 1.03 0.52-1.92 0.921
Female 12 (26.1%) 24 (29.6%) 0.670 0.76 0.38-1.43 0.403
African American 7 (15.2%) 14 (17.3%) 0.763 0.90 0.37-1.90 0.801 Current smoker 10 (21.7%) 17 (21.0%) 0.921 1.10 0.52-2.14 0.788
Diabetes 15 (32.6%) 13 (16.1%) 0.031 1.83 0.96-3.34 0.065
Hypertension 39 (84.8%) 67 (82.7%) 0.763 1.19 0.56-2.90 0.673 BMI in kg/m2 30.99 ± 0.79 29.14 ± 0.59 0.064
Obesity (BMI ≥30) 25 (54.4%) 35 (43.2%) 0.227 1.46 0.82-2.63 0.201
Prior MI 19 (41.3%) 30 (37.0%) 0.635 1.15 0.63-2.06 0.643
Prior stroke 4 (8.7%) 4 (4.9%) 0.459 1.98 0.59-4.91 0.237
Prior PCI 22 (47.8%) 33 (40.7%) 0.439 1.32 0.74-2.37 0.344
Aspirin 43 (93.5%) 81 (100%) 0.046 0.24 0.09-1.02 0.052
Aspirin dose* 0.249
81 mg 13 (30.2%) 33 (40.7%)
325 mg 30 (69.8%) 48 (59.3%)
Statins 41 (89.1%) 77 (95.1%) 0.211 0.60 0.26-1.75 0.317
Advisor: Craig Lee
ACS 15 (32.6%) 28 (34.6%) 0.823 0.98 0.51-1.78 0.946
Multivessel disease 37 (80.4%) 46 (56.8%) 0.007 2.67 1.34-5.90 0.004
Stent placement 24 (52.2%) 54 (66.7%) 0.107 0.68 0.38-1.22 0.191
Post CABG 6 (13.0%) 5 (6.17%) 0.186 1.62 0.62-3.54 0.300
Post
revascularization 32 (69.6%) 59 (72.8%) 0.694 0.93 0.50-1.79 0.808 Systolic blood
pressure (mmHg) 138 (123-150) 133 (125-143) 0.563 Diastolic blood
pressure (mmHg) 80 (74-87) 77 (72-85) 0.346 Total cholesterol
(mg/dL) 160 (143-185) 152 (128-183) 0.38 LDL (mg/dL) 87 (69-109) 83 (63-104) 0.439
HDL (mg/dL) 43 (36-55) 48 (41-56) 0.031
Triglyceride (mg/dL) 123 (87-169) 91 (69-126) 0.006
BG (mg/dL) 97 (90-111) 96 (89-102) 0.148
Advisor: Craig Lee
Table 4. Results from one-way ANOVA analysis of log-transformed CYP eicosanoid metabolite biomarker levels and MACE and MACE-revasc (n=96). Biomarker levels are expressed as median (interquartile range). EETs=epoxyeicosatrienoic acids,
DHETS=dihydroxyeicosatrienoic acids, 20-HETE=20-hydroxyeicosatetreanoic acid.
Eicosanoid metabolite MACE (n=32) no MACE (n=64) P MACE-revasc (n=40) no MACE-revasc (n=56) P Sum plasma EETs (ng/mL) 0.29 (0.23-0.42) 0.31
(0.21-0.40) 0.874
0.30 (0.23-0.43)
0.30 (0.21-0.39)
0.719
Sum EETs + DHETs (ng/mL)
1.78 (1.38-2.09)
1.58
(1.39-2.31) 0.966
1.67 (1.36-2.09) 1.59 (1.40-2.34) 0.952 14, 15-EET/14,15-DHET ratio 0.37 (0.17-0.74) 0.38
(0.17-0.71) 0.918
0.42 (0.18-0.81)
0.31
(0.16-0.63) 0.631
20-HETE (ng/mL) 1.55 (1.03-2.30)
1.58
(1.19-2.23) 0.381
1.55 (1.14-2.30)
1.58
Advisor: Craig Lee
Table 5. Chi-square and proportional hazard analysis with plasma eicosanoid
metabolite tertiles and MACE (panel A) or MACE-revasc (panel B) (n=96). HR=hazard ratio, 95% CI=95% confidence interval. EETs=epoxyeicosatrienoic acids,
DHETS=dihydroxyeicosatrienoic acids, 20-HETE=20-hydroxyeicosatetreanoic acid.
A Chi-square Proportional hazard
Tertiles MACE (n=32) no MACE (n=64) P HR 95% CI P
Sum EETs (ng/mL) 0.829 0.791
0 12 (37.5%) 20 (31.3%) Reference
1 10 (31.3%) 22 (34.4%) 0.77 0.32-1.77 0.531
2 10 (31.3%) 22 (34.4%) 0.79 0.33-1.83 0.582
Sum EETs + DHETs
(ng/mL) 0.720 0.772
0 9 (28.1%) 23 (35.9%) Reference
1 12 (37.5%) 20 (31.3%) 1.36 0.58-3.35 0.480
2 11 (34.4%) 21 (32.8%) 1.24 0.51-3.10 0.631
14,
15-EET/14,15-DHET ratio 0.954 0.956
0 10 (31.3%) 22 (34.4%) Reference
1 11 (34.4%) 21 (32.8%) 1.14 0.48-2.74 0.769
2 11 (34.4%) 21 (32.8%) 1.09 0.46-2.64 0.839
20-HETE (ng/mL) 0.954 0.928
0 11 (34.4%) 21 (32.8%) Reference
1 10 (31.3%) 22 (34.4%) 0.85 0.35-2.01 0.700
2 11 (34.4%) 21 (32.8%) 0.91 0.39-2.13 0.825
B Chi-square Proportional hazard
Tertiles MACE-revasc (N=40)
no MACE-revasc
(n=56) P HR 95% CI P
Sum EETs (ng/mL) 0.741 0.722
0 13 (32.5%) 19 (33.9%) Reference
1 12 (30.0%) 20 (35.7%) 0.89 0.30-1.96 0.765
2 15 (37.5%) 17 (30.4%) 1.21 0.57-2.58 0.618
Sum EETs + DHETs
(ng/mL) 0.96 0.971
0 13 (32.5%) 19 (33.9%) Reference
1 14 (35.0%) 18 (32.1%) 1.07 0.50-2.30 0.863
Advisor: Craig Lee
14,
15-EET/14,15-DHET ratio 0.573 0.573
0 11 (27.5%) 21 (37.5%) Reference
1 14 (35.0%) 18 (32.1%) 1.39 0.63-3.14 0.410
2 15 (37.5%) 17 (30.4%) 1.48 0.68-3.30 0.323
20-HETE (ng/mL) 0.573 0.594
0 15 (37.5%) 17 (30.4%) Reference
1 11 (27.5%) 21 (37.5%) 0.67 0.30-1.45 0.309
Advisor: Craig Lee
Table 6. Results from one-way ANOVA analysis of log-transformed urine prostaglandin metabolite levels and MACE and MACE-revasc (n=112). Biomarker levels are
expressed as median [interquartile range]. TxA2-M (11-dehydro-thromboxane B2) is the stable urine metabolite of thromboxane (TxA2). PGI2-M (2,3-dinor-6-keto-prostaglandin F1 alpha) is the stable urine metabolite of prostacyclin (PGI2).
Urine
metabolites MACE (n=33) no MACE (n=79) P
MACE-revasc (n=42)
no
MACE-revasc (n=70) P
TxA2-M (pg/mg Cr)
791.84 (606.24-1044.43)
579.19
(408.59-877.69) 0.098
782.34 (490.79-1077.21)
575.64
(405.41-830.35) 0.064 PGI2-M
(pg/mg Cr)
10060.89 (5734.21-16152.48)
10076.40
(6000.88-16399.99) 0.401
8044.70 (5167.38-15771.61)
10842.65
Advisor: Craig Lee
Table 7. Chi-square and proportional hazard analysis with urine thromboxane metabolite tertiles and MACE (panel A) or MACE-revasc (panel B) (n=112). TxA2-M (11-dehydro-thromboxane B2) is the stable urine metabolite of thromboxane (TxA2). HR=hazard ratio, 95% CI=95% confidence interval. P-values in bold indicates statistical significance.
A Chi-square Proportional hazard
Tertiles MACE (n=33) no MACE (n=79) P HR 95% CI P
TxA2-M
(pg/mg Cr) 0.039 0.092
0 6 (18.2%) 31 (39.2%) Reference
1 11 (33.3%) 27 (34.2%) 1.61 0.61-4.68 0.338
2 16 (48.5%) 21 (26.6%) 2.65 1.09-7.39 0.031
B Chi-square Proportional hazard
Tertiles MACE-revasc (n=42)
no MACE-revasc (n=70)
P HR 95% CI P
TxA2-M (pg/mg
Cr) 0.085 0.215
0 10 (23.8%) 27 (38.6%) Reference
1 13 (31.0%) 25 (35.7%) 1.07 0.47-2.51 0.871
Advisor: Craig Lee
Table 8. Clinical factors across TxA2-M tertiles (n=112). The associations between these factors and TxA2-M tertile were determined by chi-square/Fisher’s exact for nominal variable and one-way ANOVA for continuous variable. P values in bold
indicates statistical significance. Data are presented as count (%), median (interquartile
range), and mean ±SD unless otherwise indicated. MI = myocardial infarction,
BMI=body mass index, PCI=percutaneous coronary intervention, CABG=coronary artery bypass graft, ACE-I=angiotensin-converting enzyme inhibitor, ARB=angiotensin receptor blocker, NSTEMI=non-ST segment elevation myocardial infarction, STEMI=ST segment elevation myocardial infarction, LDL=low-density lipoprotein, HDL=high-density lipoprotein, BG=blood glucose.
Tertile 1 (n=37) Tertile 2 (n=38) Tertile 3 (n=37) P
Age in years 61.54 ± 10.74 60.21 ± 9.56 57.38 ± 9.30 0.185
Age >65 12 (32.0%) 11 (28.9%) 7 (18.9%) 0.395
Female 2 (5.4%) 13 (34.2%) 16 (43.2%) 0.0003
African American 4 (10.8%) 5 (13.2%) 10 (27.0%) 0.158
Current smoker 4 (10.8%) 8 (21.0%) 13 (35.1%) 0.047
Diabetes 7 (18.9%) 6 (15.8%) 13 (35.1%) 0.105
Hypertension 32 (86.5%) 30 (78.9%) 33 (89.0%) 0.509
BMI in kg/m2 28.59 ± 4.14 29.82 ± 5.42 30.86 ± 6.54 0.207
Obesity (BMI >=30) 12 (32.0%) 19 (50.0%) 20 (54.1%) 0.139
Prior MI 15 (40.5%) 15 (39.5%) 15 (40.5%) 0.994
Prior stroke 2 (5.4%) 2 (5.3%) 1 (2.7%) 1.000
Prior PCI 19 (51.3%) 17 (44.7%) 16 (43.2%) 0.758
Aspirin 37 (100%) 38 (100%) 34 (91.9%) 0.068
Aspirin dose at baseline* 0.654
81 mg 11 (29.7%) 15 (39.5%) 11 (32.4%)
325 mg 26 (70.3%) 23 (60.5%) 23 (67.7%)
Statins 37 (100%) 36 (94.7%) 31 (83.8%) 0.019
Beta Blockers 34 (91.9%) 30 (78.9%) 30 (81.1%) 0.265
ACE-I or ARB 24 (64.9%) 24 (63.2%) 23 (62.2%) 0.971
Clopidogrel 32 (86.5%) 30 (78.9%) 27 (73.0%) 0.354
ACS 17 (45.9%) 10 (26.3%) 11 (29.7%) 0.161
Multivessel disease 25 (67.6%) 22 (57.9%) 25 (67.6%) 0.600
Advisor: Craig Lee
Post CABG 2 (5.4%) 4 (10.5%) 3 (8.1%) 0.907
Post revascularization 27 (73.0%) 28 (73.4%) 24 (64.8%) 0.651 Systolic blood pressure (mmHg) 130 (14) 134 (21) 135 (25) 0.610 Diastolic blood pressure (mmHg) 77 (9) 76 (9) 83 (15) 0.040
Total cholesterol (mg/dL) 135 (47) 153 (27) 183 (47) 0.0001
LDL (mg/dL) 74 (40) 82 (26) 103 (50) 0.0001
HDL (mg/dL) 44 (16) 48 (17) 48 (26) 0.175
Triglyceride (mg/dL) 94 (89) 97 (70) 102 (91) 0.981
BG (mg/dL) 97 (12) 95 (16) 98 (18) 0.142
Advisor: Craig Lee
Table 9. Unadjusted and adjusted logistic regression and proportional hazard analysis between urine TxA2-M tertiles and MACE, in whole population with TxA2 data (n=112) (top panel) and population with non-aspirin users excluded (n=109) (bottom panel). P values in bold indicate statistically significant results. The association between TxA2-M tertile and MACE persists after adjusting for potential confounders and excluding patients not taking aspirin. OR=odds ratio, HR=hazard ratio, 95% CI=95% confidence interval.
n=112 Unadjusted Adjusted
Logistic regression Proportional hazard Logistic regression Proportional hazard Tertiles OR
(95% CI) P (95%CI) HR P
OR
(95% CI) P (95%CI) HR P TXA2-M
(pg/mg Cr) 0.036 0.092 0.014 0.059
0 Reference Reference Reference Reference
1
2.11
(0.70-6.83) 0.185
1.61
(0.61-4.68) 0.338
3.51
(1.05-12.91) 0.041
2.2
(0.81-6.54) 0.122
2 3.94
(1.38-12.52) 0.010 (1.09-7.39) 2.65 0.031 (1.75-25.13) 6.23 0.004 (1.22-10.00) 3.34 0.019
n=109 Unadjusted Adjusted
Logistic regression Proportional hazard Logistic regression Proportional hazard Tertiles OR
(95% CI) P (95%CI) HR P
OR
(95% CI) P (95%CI) HR P TXA2-M
(pg/mg Cr) 0.062 0.140 0.012 0.055
0 Reference Reference Reference Reference
1
2.11
(0.70-6.83) 0.185
1.61
(0.61-4.68) 0.338
3.67
(1.09-13.82) 0.036
2.28
(0.84-6.81) 0.107
2 3.62
(1.24-11.69) 0.018
2.51
(1.01-7.10) 0.048
6.56
(1.81-27.20) 0.004
3.4
Advisor: Craig Lee
Table 10. Evidence regarding association between TxA2 and MACE. CAD=coronary artery disease, MACE=major adverse cardiovascular events, CCB=calcium channel blocker, HOPE Study=Heart Outcomes Prevention Evaluation Study, CHARISMA Study= Clopidogrel for High Atherothrombotic Risk and Ischemic Stabilization, Management and Avoidance Study, NSAIDs=non-steroidal anti-inflammatory drugs, ACE-I=angiotensin-converting enzyme inhibitor, ARB=angiotensin receptor blocker, PAD=peripheral artery disease, ACS=acute coronary syndrome, SVG=saphenous vein graft, CABG=coronary artery bypass graft, LMWH=low molecular weight heparin, COX-1=cyclooxygenase-1, MI=myocardial infarction, PCI=percutaneous coronary
intervention, LTIMI Study=leukotrienes and Thromboxane in Myocardial Infarction Study, hs-CRP=high-sensitivity C-reactive protein, WBC=white blood cell,
hs-TnT=high-sensitivity troponin T, OR=odds ratio, HR=hazard ratio, 95% CI=95% confidence interval.
Study Design Relationship between
TxA2 and MACE
Patient population Background therapy
Eikelboom et al. 200213
Case-control design
Patients in the upper quartile of urinary
11-dehydro thromboxane B2
having a 1.8-times-higher risk of MACE (composite of MI, stroke, or
cardiovascular death) than those in the lower quartile (OR 1.8; 95% CI 1.2-2.7; P=0.009)
Canadian patients enrolled in HOPE Study (stable CAD, 1993-1999), 488 cases treated with aspirin who had MACE during 5-yr follow-up and 488 controls treated with aspirin but no MACE
In case group: 100% aspirin, 49% beta-blocker, 25% lipid-lowering agent, 15% diuretics, 59% CCB, 46.5% Ramipril, 50% vitamin E
Eikelboom et al. 200814
Externally validate results from the study mentioned above. Prespecified sub-study of the CHARISMA study
Baseline urinary
11-dehydro thromboxane B2
concentrations in the highest quartile were associated with an increased risk of stroke, MI, or cardiovascular death compared with the lowest quartile (adjusted HR 1.66, 95% CI 1.06-2.61,
P=0.03).
15603 patients with either clinically established CAD or multiple risk factors
In all patients: 99.7% aspirin, 55%
clopidogrel, 21.6% NSAIDs, 76.9% statin, 55.3% beta-blocker, 47.6% diuretic, 36.8% CCB, 18% ramipril, 46.3% other ACE-I, 12.4% other
Advisor: Craig Lee Krasopoulos
et al. 200824
meta-analysis of 20 studies (1997-2007), total of 2930 patients
All aspirin resistant patients, regardless of underlying clinical symptoms, were at a greater risk of death, ACS, failure in vascular
intervention, or a new cerebrovascular event: 39% of aspirin resistant patients compared with 16% of aspirin sensitive patients had a
cardiovascular event (OR 3.85, 95% CI 3.08 to 4.80; P<0.001)
Cardiovascular disease (CAD, PAD or
cerebrovascular disease) patients
N/A
Gluckman et al.25, 2011 ASA responsiveness and platelet reactivity measured 2-4 days after CABG surgery and 6 months after when SVG patency was assessed
Elevated Urine TxB2 increases risk of early SVG thrombosis after CABG surgery.
368 patients after first-time CABG surgery with implantation of at least 1 SVG.
100% aspirin, 4-6% oral anticoagulation, 61-62% ACE-i/ARB, 81-89% beta-blocker, 86-91% lipid lowering agent
Frelinger et al.20 2009
Prospectively determine whether COX-1 dependent and other platelet function assays correlate with clinical outcomes in aspirin-treated patients
This study is to look at serum TxB2 not urine metabolite. Serum TxB2 evaluates the capacity of maximally activated platelets to produce thromboxane via COX-1, which urinary 11-dehydro-TxB2 reflects total amount that can be derived in part from non-platelet sources. Nonetheless, this study showed elevated serum TxB2 is associated with an increase risk for MACE in this population
700 consecutive aspirin-treated patient presenting for
diagnostic angiographic evaluation of CAD
Advisor: Craig Lee Szczeklik et
al. 15 2016
part of the LTIMI study to
evaluate the relationship between 11-dehydro-TxB2 and MACE in patients with acute MI. Urinary 11-dehydro-TxB2 measured on admission, 1 month, 1 year
Baseline 11-dehydro-TXB2 was higher in patients with MACEs (n=60; 7.73, 7.07– 8.60) compared with those without MACEs (n=119; 7.28, 6.68–7.79; P=0.002). Univariate analysis
revealed 3.66 times (95% CI 1.47–9.13) higher MACE risk in patients within the highest 11-dehydro-TXB2 quartile, com- pared with those in the lowest
quartile.Baseline 11-dehydro-TxB2 also correlated with CK, hs-TnT, and inflammatory markers (WBC, hs-CRP)
180 consecutive patients with acute MI type 1 referred for primary PCI.
Advisor: Craig Lee
Figures
Figure 1. Study population definitions. Only patients with UNC follow-up (n=127) were included in the analysis. The subpopulations of patients with plasma eicosanoid data (n=96) (Panel A) and patients with urine metabolite data (n=112) (Panel B) were used for any analysis regarding these metabolites. CAD=coronary artery disease, EETs= epoxyeicosatrienoic acids, UNC=University of North Carolina.
Panel A
Panel B
Patients with stable CAD (n=139)
Patients with UNC follow-up (n=127)
Patients with plasma EETs eicosanoid data (n=96)
n=12 lost to follow-up
Patients with stable CAD (n=139)
Patients with UNC follow-up (n=127)
Patients with urine prostaglandin metabolite data (n=112)
Advisor: Craig Lee
Figure 2. Baseline eicosanoid biomarker level tertiles and subsequent risk for MACE by Kaplan-Meier curves (n=96). The four eicosanoid biomarkers are sum EETs (panel A), sum EETs + DHETs (panel B), 14, 15-EET:DHET ratio (panel C), and 20-HETE (panel D). EETs=epoxyeicosatrienoic acids, DHETS=dihydroxyeicosatrienoic acids,
20-HETE=20-hydroxyeicosatetreanoic acid. Red=lowest tertile, blue=middle tertile, green=highest tertile.
A. B.
C. D.
0 8 0 0 1 6 0 0 2 4 0 0 3 2 0 0
0 5 0 1 0 0
M A C E b y E E T T e r t i l e
T i m e t o E v e n t ( d a y s )
E v e n t r a te %
L o w e s t t e r t i l e ( s u m E E T s )
M i d d l e t e r t i l e ( s u m E E T s )
H i g h e s t t e r t i l e ( s u m E E T s )
0 8 0 0 1 6 0 0 2 4 0 0 3 2 0 0
0 5 0 1 0 0
M A C E b y E E T + D H E T T e r t i l e
T i m e t o E v e n t ( d a y s )
E v e n t r a te %
L o w e s t t e r t i l e ( s u m E E T + D H E T s )
M i d d l e t e r t i l e ( s u m E E T + D H E T s )
H i g h e s t t e r t i l e ( s u m E E T + D H E T s )
0 8 0 0 1 6 0 0 2 4 0 0 3 2 0 0
0 5 0 1 0 0
M A C E b y 1 4 , 1 5 - E E T : D H E T T e r t i l e
T i m e t o E v e n t ( d a y s )
E v e n t r a te %
L o w e s t t e r t i l e ( 1 4 , 1 5 - E E T : D H E T )
M i d d l e t e r t i l e ( 1 4 , 1 5 - E E T : D H E T )
H i g h e s t t e r t i l e ( 1 4 , 1 5 - E E T : D H E T )
0 8 0 0 1 6 0 0 2 4 0 0 3 2 0 0
0 5 0 1 0 0
M A C E b y 2 0 - H E T E T e r t i l e
T i m e t o E v e n t ( d a y s )
E v e n t r a te %
Advisor: Craig Lee
Figure 3. Baseline urine prostaglandin metabolite level tertiles and subsequent risk for MACE by Kaplan-Meier curves (n=112). The urine prostaglandin metabolites are TxA2-M (panel A) and PGI2-TxA2-M (panel B). TxA2-TxA2-M (11-dehydro-thromboxane B2) is the stable urine metabolite of thromboxane (TxA2). PGI2-M (2,3-dinor-6-keto-prostaglandin F1 alpha) is the stable urine metabolite of prostacyclin (PGI2). Red=lowest tertile, blue=middle tertile, green=highest tertile.
A. B.
0 8 0 0 1 6 0 0 2 4 0 0 3 2 0 0
0 5 0 1 0 0
M A C E b y T x A 2 - M T e r t i l e
T i m e t o E v e n t ( d a y s )
E
v
e
n
t
r
a
te
%
L o w e s t t e r t i l e ( T x A 2 - M )
M i d d l e t e r t i l e ( T x A 2 - M )
H i g h e s t t e r t i l e ( T x A 2 - M )
0 8 0 0 1 6 0 0 2 4 0 0 3 2 0 0 0
5 0 1 0 0
M A C E b y P G I 2 - M T e r t i l e
T i m e t o E v e n t ( d a y s )
E
v
e
n
t
r
a
te
%