The Association between Water Lead Levels and Blood Lead Levels: A
Systematic Review
Abhishek Komandur
Honors Thesis ENHS
Department of Environmental Sciences and Engineering
Gillings School of Global Public Health
The University of North Carolina at Chapel Hill
April, 2017
Approved:
Dr. Jacqueline Macdonald Gibson
Dr. [Advisor’s Name] (Advisor)
Dr. Jill Stewart
Dr. [ESE Faculty Member’s Name] (Reader)
2 Abstract
Lead adversely impacts health when consumed through drinking water, but there is no
standard model describing the relationship between lead in water and blood. To better understand
this relationship, I conducted a systematic literature review. Eighteen studies published after
1995 were identified from online databases and other sources, of which eleven measured both
water lead and blood lead. All 11 papers showed a statistically significant positive correlation
between water and blood lead. However, there is large variance in how these papers modeled the
relationship, and limitations of the studies limit their generalizability. The remaining seven
papers estimated blood lead from water lead using physiologically-based pharmacokinetic
models. These results demonstrate a deficit in information on dose-response relationships
between water lead and blood lead. A better understanding would aid in assessing the health
risks of lead exposure from drinking water, which in turn would help with regulatory
3
TABLE OF CONTENTS
Abstract ... 2
Table of Contents ... 3
Introduction ... 4
Methods ... 5
Results ... 7
Discussion... 15
Limitations ... 16
Conclusion ... 16
Appendix A ... 18
4 Introduction
Lead has been shown to have adverse health effects at any level of exposure27. High levels of lead exposure can lead to deleterious health effects such as encephalopathy, enzymatic
inhibition, hypertension, and kidney and liver damage. At low levels, lead can also increase the
risk of heart disease in adults27. Elevated blood lead levels (BLLs) in mothers or pregnant women are shown to correlate with increased BLLs in their offspring and miscarriage or fetal
death1, 15, 16, 17.
Children generally absorb more ingested lead than adults do, which increases their
vulnerability and can result in IQ decreases and other neurological effects during brain
development, especially in children under age 63,5,6,14,26. Studies have also shown that even low blood lead levels, such as those below the Center for Disease Control’s (CDC’s) elevated blood
lead reference level of 5 µg/dL, are associated with decreases in IQ during early childhood3, 14.
Such studies provide evidence that blood lead levels may not have a threshold dose above which
adverse effects first become apparent3, 14.
Due to these health risks, the Environmental Protection Agency (EPA) has established
regulations to reduce lead exposure, most notably through phasing out its use in gasoline (1976)
and paint (1978)28. In addition, 1986 amendments to the Safe Drinking Water Act banned the use of lead-containing service lines, solders, and other materials that allow lead to leach into the
water supply31. The EPA also established the Lead and Copper Rule under the Safe Drinking Water Act. This mandates that water utilities implement corrosion control measures to prevent
the leaching of lead and copper from water distribution mains and indoor plumbing29. As a result of these regulatory programs, mean blood levels have declined 78% from 12.8 micrograms per
5
United States28. However, recent events in Flint, Michigan indicate that lead exposure via drinking water can still occur. Along with this, the primary water source of approximately 14%
of the United States’ population is unregulated, as the Safe Drinking Water Act does not apply to
households relying on private water systems for their drinking water12.
Understanding the impact of lead exposure from water on BLLs is important because
characterizing the effect of water lead levels on BLLs can have significant implications in
regulatory policy making, as well as understanding and quantifying the resulting health effects
from elevated BLLs. The objective of this systematic literature review is to examine the
association between lead in water and BLLs.
Methods
A systematic literature review of the association between lead in water and lead in blood
was conducted according to PRISMA guidelines for systematic literature reviews32. The review
protocol was registered with PROSPERO (registration number CRD42017058717).
Search Strategy
Papers that were published after 1995 were systematically searched for using Google
Scholar, Jama Network, and Pubmed. Medical subject headings were also used to search the
National Center for Biotechnology Information’s database (Table 1). Other search strings
returned high rates of duplicate results, and thus were not utilized in the search process.
Additional papers from non-database sources were found by searching through the citations of
6
Table 1. Search Strings and Results
Search Strings Results
(Pb OR Lead) AND Water AND Blood 4
Blood in Water AND Blood in Lead 6
("blood"[Subheading] OR "blood"[All Fields] OR "blood"[MeSH Terms]) AND ("lead"[MeSH Terms] OR "lead"[All Fields]) AND levels[All Fields]AND water AND contamination AND health Filters: Abstract)*
1
Blood Lead Levels AND Water 3
*Medical subject headings were only used to search in Pubmed
Inclusion Criteria and Study Selection
In order to qualify for this systematic literature review, papers must have assessed the
relationship between the concentration of lead in drinking water and the concentration of lead in
blood. This includes papers that assess water as a source of lead exposure in conjunction with
other sources. Papers must have focused on humans. Papers were limited to those that were
published after 1995 because Triantafyllidou and Edwards previously reviewed a number of
papers published before 199513.
One reviewer conducted an abstract and text screen for all studies found in order to assess
their eligibility for the systematic literature review.
Data Extraction
Data on study characteristics, correlations, statistical significance found in each study,
7
Microsoft Word and Excel. Correlations were reported for studies that did not fit statistical
models to the data.
Study Quality
The risk of bias of the included studies was assessed using the Risk of Bias Assessment
tool for Non-randomized Studies (RoBANS)36. Using RoBANS, studies were graded on a scale
of low, high, or unclear risk of bias across 6 domains (Table 2). The results of this assessment
are displayed in Appendix A, and were taken into consideration when discussing the findings of
the studies. No papers were excluded based on this assessment.
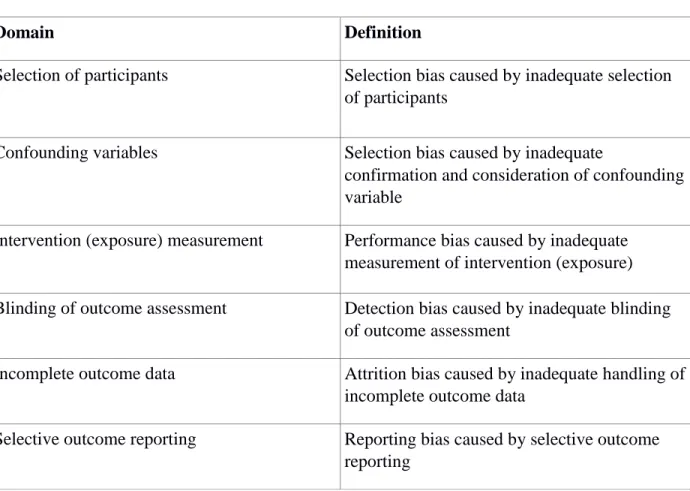
Table 2. Risk of bias domains and definitions as given by Kim et. al. 36
Domain Definition
Selection of participants Selection bias caused by inadequate selection of participants
Confounding variables Selection bias caused by inadequate
confirmation and consideration of confounding variable
Intervention (exposure) measurement Performance bias caused by inadequate measurement of intervention (exposure)
Blinding of outcome assessment Detection bias caused by inadequate blinding of outcome assessment
Incomplete outcome data Attrition bias caused by inadequate handling of incomplete outcome data
8
Results
Search Results
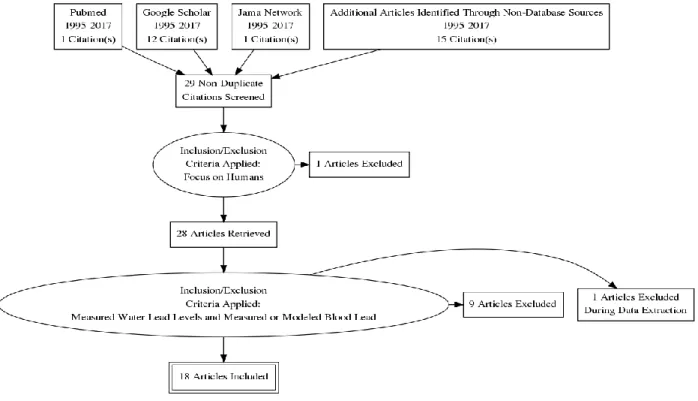
Fourteen papers were identified by searching through three databases. An additional 15
papers were identified through non-database sources, which included bibliography searches,
papers that cited the previously found papers, and papers of interest that were identified by
colleagues. A total of 18 papers were included in the study after applying the inclusion/exclusion
criteria (Figure 1).
These papers were classified into two major types of studies. The first type directly
measured both water lead levels and blood lead levels and calculated a statistical association
between them on the basis of blood lead. The second type measured water lead levels and
predicted blood lead levels using physiologically based pharmaco-kinetic (PBPK) models, which
simulate the effects of daily lead intake through the respiratory and gastrointestinal systems from
9
Figure 1. PRISMA flowchart. Results of Literature Search Process
Association between Lead in Water and Lead in Blood
Statistical significance was reported in 11 of the papers that measured both water lead
and blood lead (Table 3), and all eleven papers concluded that water lead levels are a significant
contributor to BLLs. Two papers of these papers had a high risk of selection bias due to no clear
consideration of confounding variables (Appendix A).
Eight papers did not measure blood lead but instead used the water lead data from their
research to predict what blood lead levels might be expected (Table 4). Seven predicted an
increase in BLLs or the incidence of elevated BLLs (>5 µg/dL) from consuming
10
the incidence of elevated BLLs, but only assessed the contribution from drinking water in
schools specifically37. Of these eight papers, seven used the EPA’s integrated exposure uptake
biokinetic (IEUBK) model and one used the International Commission for Radiation Protection
(ICRP) model (Table 4). Every study that used the IEUBK model adjusted for these background
sources of lead exposure using previously measured values or the default values provided by the
EPA.
Table 3. Characteristics of 11 Studies Directly Measuring Water Lead Levels and Blood Lead Levels
Sample Population Water Collection Protocol Statistically Significant
Reference
Mothers (225) and offspring (685) aged 1-2 years old in Allada, Benin
Not specified Yes Bodeau-Livinec, Florence, et
al., 20161
Mothers and children in Washington, DC between 1997 and 2011
DC water lead level samples previously collected for EPA compliance monitoring
Yes Edwards, Marc, 20134
Children (298) 1-5 years old in Montreal,
Quebec, Canada
One 1-L sample collected after 5 minutes of flushing and four 1-L samples collected after 30 minutes stagnation time
Yes Ngueta et. al., 20167
Mothers (1726) who had given birth to a live child approximately 18 months previously
One 30-mL sample collected from the household kettle and one
11
1-L sample collected after 30 minutes stagnation time
Families (207) previously included in the Edinburgh lead study
One sample collected after 30 minutes stagnation time
Yes Macintyre, Cecilia, et al., 199818
Children (1473) living within the city of Flint
Data from water lead sampling maps
Yes Hanna-Attisha, Mona, et al., 201620
Children (484) 6 months to 6 years old in France
One 2-L sample collected after 30 minutes stagnation time
Yes Etchevers, Anne, et al., 201521
Children (306) 1-5 years old that currently drink tap water
One 1-L sample collected after a 5 minute flush and four 1-L samples taken after 30 minutes stagnation time
Yes Levallois, Patrick, et al., 201424
All children aged 1 years old, and 2 years old, as well as 50% of children aged 3 years old in Washington DC between 2001-2003
One 1-L first draw sample collected after greater than 6 hours holding time and one 1-L second raw sample collected after flushing for 30 seconds to 5 minutes
Yes Edwards et al., 200939
Non-smoking young women (248) in Hamburg, Germany
Samples were collected form stagnant water in the morning, water taken at lunchtime for cooking, and from water after flushing for 3 minutes
Yes Fertman et al., 200442
Children (276) followed from 6 months of age to 24 months of age in Rochester, New York
One .25-L sample collected in the morning from the kitchen tap after flushing for 1 minutes
12
Table 4. Characteristics of Studies Predicting Blood Lead Levels (BLLs) from Water Lead Levels
Sample Population
Water Collection Protocol
Model Predicted Increase in
BLLS or Incidence of Elevated BLLs (>5
µg/dL)
ReferenceA
Homes (305) in Montreal, Quebec, Canada
One 1-L sample collected after 5 minutes of flushing and four 1-L samples collected after 30 minutes stagnation time
IEUBK Changes in WLL
between winter and summer can result in a 1 µg/dL increase in BLLs for children aged 0.5-7 years old.
Ngueta, G., et al., 20146
Large buildings (8530) in 4 Canadian provinces
First flush samples and/or other sampling protocols
IEUBK Elevated water lead
levels at some building points can result in a BLL increase of 1 µg/dL or more in some cases.
Deshommes, Elise, et al., 201622
Homes (519) in Montreal, Quebec, Canada
A combination of samples collected after 5 minutes of flushing, after 30 minutes stagnation time, and random daytime sampling
IEUBK Seasonal impacts on
water lead levels accounts for a difference of 0.8 µg/dL to 1.1 µg/dL in BLLs.
Deshommes, Elise et al., 201338
Households (18) in Tamatave, Madagascar
One .25-L to 1-L first flush sample and one .25-L to 1-L sample collected after 1 hour stagnation time
IEUBK Elevated water lead
levels due to the use of pitcher-pump systems can lead to between 15% and 40% of exposed children may be at risk of elevated BLLs.
Akers, D. Brad, et al., 201541
Seattle Public Schools district
One .250-L flushed samples collected after 30 seconds and one .250-L first-draw sample collected after 8-18 hours of no use
IEUBK Elevated water lead
levels in schools are not likely to result in elevated BLLs in the absence of other sources of lead exposure.
13
A. Edwards et. al., 2009 appears in both Table 3 and 4 due to comparing the results of the ICRP model with a calculated statistical association between water lead levels and blood BLLs
Exposure Source Characteristics
Sixteen of the papers included in this literature review used tap water from a municipal
water supply as the main source of water for their test populations. Two papers considered
municipal water from groundwater wells with lead-containing parts as a source of lead
exposure1, 41. Four papers mention that lead contaminated water may be a result of using lead
pipes to transport water to the households2,15,23,25. Three papers examined specific cases of water
lead levels in schools and other large buildings contributing to elevated blood lead levels22,39,40.
Schools in Seattle Public Schools District and Los Angeles Unified School District
Coupled first-draw samples and flushed samples
IEUBK Lowering water lead
levels through remediation measures (e.g. flushing) leads to a decreased incidence of elevated BLLs in school children from 8.6% to 6.0%.
Triantafyllidou, Simoni, et al., 201440
Area containing 4 boreholes, a water tank, and 5 domestic water taps north of Port-au-Prince, Haiti
Samples collected by telescopic perch
Zmirou and Perrodin, 1999
A contribution of 10 ug per day in the drinking water consumed by children leads to an increase of 16 ug/L in the BLL.
Emmanuel, Evens, et al., 20075
All children aged 1 years old, and 2 years old, as well as 50% of children aged 3 years old in Washington DC between 2001-2003
One 1-L first draw sample collected after greater than 6 hours holding time and one 1-L second raw sample collected after flushing for 30 seconds to 5 minutes
ICRP High water lead levels
increase the incidence of elevated BLLs.
14 Study Setting Characteristics
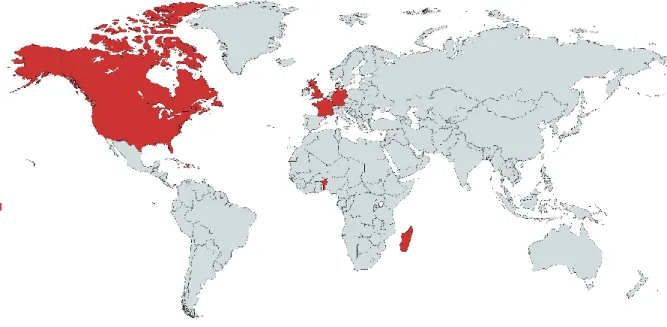
A majority of the studies conducted their research in developed countries, including the
United States (N=6), Canada (N=5), France (N=1), Germany (N=1), and Scotland (N=2). The
remaining three papers conducted their studies in Haiti, Madagascar, and Benin1, 5, 41. The
Canadian studies were mostly conducted in Montreal and the surrounding areas, while the
Scottish studies conducted their studies in Edinburgh and the surrounding areas. The American
studies were conducted in Washington DC, Flint, Seattle, Rochester, and Los Angeles.
Figure 2. Map of study locations
Water Collection Protocols and Covariate Characteristics
Common covariates besides the presence of lead in water that were included in the
models include gender, water consumption, presence of lead pipes, and age, type, or other factors
of the dwelling that the test subject resides in. Water collection protocols differed greatly
15
amount of time and a sample collected after a stagnation period of a certain amount of time
(Table 4).
Discussion
This systematic review examines the association between blood lead levels and water
lead levels. The findings were that ingesting lead from drinking water positively correlates to an
increase in BLLs. Eleven papers found a significant association between water lead levels and
blood lead levels. Seven of the papers using PBPK models predicted an increase in the incidence
of elevated BLLS from drinking water contaminated with lead.
To my knowledge, there have been no previous systematic reviews on the association
between water lead levels and blood lead levels. However results from this review are similar to
those from previously conducted literature reviews on lead exposure. The Agency for Toxic
Substances and Disease Registry’s review in 2007 noted water lead levels can contribute to
blood lead levels measured in children33. Studies that found high variability in the predicted
correlations between blood lead levels, soil, and dust also suggested that water is a contributing
factor in blood lead levels33.
Another study conducted in England in 1986 concluded that water lead can contribute to
variance in predicted blood lead levels when investigating other factors34.Elwood noted that
water is an important contributor to lead that is “seldom realized”, which may be in part because
of the limitations in the studies34. Water lead measurements differ greatly based on which water
collection method is used ((e.g. measuring from a flushed sample, stagnant sample, etc.).
Limitations of the examined articles center on difficulties in predicting BLLs from lead
exposure to drinking water. This is due to reasons which include exposure misclassification,
water-16
drawing behaviors, and drinking other sources of water away from the household5,6,7,8. Due to
these factors, it is difficult to model changes in BLLs because of the uncertainty in calculating
the amount of lead to which they were exposed. Along with this, all of the articles included had
study populations that used tap water as their main source of water consumption. The findings
from these papers may be difficult to extrapolate to people who are exposed to lead through their
well water due to differences in water drawing behaviors and water stagnation periods, which
can affect how much lead leaches into the water.
Limitations
A relatively small number of studies were included, which limits the generalizability of
the results. There is also an inherent risk of selection bias for the studies included due to only one
researcher participating in this review. However, this risk was minimized by clearly describing
and adhering to the inclusion criteria outlined in the sections above. This allowed for the
included literature to be fairly selected based on if they complied with each criterion. A risk of
language bias is also present as only English search strings were used. However, this risk is most
likely minimized due to a shift towards publishing studies in English35.
Conclusions
This systematic literature review demonstrates that there is a clear positive correlation
between BLLs and water lead levels. In papers that assessed multiple sources of lead exposure, a
majority of them also confirmed lead exposure through drinking water as a statistically
significant contributor to BLLs. However, many of the limitations in the studies themselves
raise concerns over how their findings can be extrapolated. Due to different water consumption
patterns, water sources, water collection protocols, water-drawing behaviors, etc., it is difficult to
17
even if the underlying correlation is the same, due to uncertainty in calculating the exact amount
of lead they are exposed to.
The results of this review demonstrate the importance of water as a source of lead
exposure. Lead exposure through water has been a known hazard dating back to the ancient
Romans, but the majority of the scientific research done on lead focuses on children’s lead
exposure through paint, lead, and dust. Decreasing the amount of variance in models determining
BLLs from water exposure to lead would help significantly in estimating the benefits of different
interventions.
Increased awareness and research on BLL and water lead levels could help in regulatory
policy-making and in assessing the risks of lead exposure. As problems such as those in Flint,
Michigan demonstrate, it is becoming increasingly clear that we need to be able to effectively
model and predict the effects that lead exposure through water has on the human body. Having
adequate dose-response models for BLLs would be an important step in facing the long-standing
18 Appendix A Selection of Participants Confounding Variables Intervention (exposure) measurement Blinding of outcome assessment Incomplete outcome data Selective outcome reporting Bodeau-Livinec, Florence, et al.
(2016) low low low unclear unclear low
Edwards, Marc
(2013) low low low low low low
Emmanuel, Evens, et al
(2007) low high low unclear unclear unclear
Ngueta, Gerard,
et al. (2014) low low low low low low
Ngueta, Gerard,
et al. (2016) low low low low low low
Watt, G. C. M.,
et al. (2000) low high low low unclear low
Macintyre, Cecilia, et al.
(1998) low low low low low low
Hanna-Attisha, Mona, et al.
(2016) low low low low low low
Etchevers, Anne,
et al. (2015) high low high low low low
Deshommes, Elise, et al.
(2015) low low low low low low
Levallois, Patrick, et al.
(2014) low low low low low low
Deshommes, Elise, et al.
(2013) low low low low unclear low
Akers, D. Brad,
et al. (2015) low low low low low low
Sathyanarayana, Sheela, et al.
19 Triantafyllidou,
Simoni, et al.
(2014) low low low low low low
Fertman et al.
(2004) low low low low low low
Edwards et al.
(2009) low low low low low low
Lanphear et al.
20 References
1. Bodeau-Livinec, Florence, et al. "Elevated Blood Lead Levels in Infants and Mothers in Benin and Potential Sources of Exposure." International journal of environmental research and public health 13.3 (2016): 316.
2. Brown, Mary Jean, et al. "Association between children’s blood lead levels, lead service lines, and water disinfection, Washington, DC, 1998–2006." Environmental research 111.1 (2011): 67-74.
3. Canfield, Richard L., et al. "Intellectual impairment in children with blood lead concentrations below 10 μg per deciliter." New England journal of medicine 348.16 (2003): 1517-1526.
4. Edwards, Marc. "Fetal death and reduced birth rates associated with exposure to lead-contaminated drinking water." Environmental science & technology 48.1 (2013): 739-746.
5. Emmanuel, Evens, et al. "Human health risk assessment of lead in drinking water: a case study from Port-au-Prince, Haiti." International Journal of Environment and Pollution 31.3-4 (2007): 280-291.
6. Ngueta, G., et al. "Exposure of young children to household water lead in the Montreal area (Canada): The potential influence of winter-to-summer changes in water lead levels on children's blood lead concentration." Environment international 73 (2014): 57-65. 7. Ngueta, Gerard, et al. "Use of a Cumulative Exposure Index to Estimate the Impact of
Tap Water Lead Concentration on Blood Lead Levels in 1-to 5-Year-Old Children (Montréal, Canada)." Environmental health perspectives 124.3 (2016): 388.
8. Office of Enforcement and Compliance Assurance. USEPA Drinking Water Bluebook; Federal Facilities Environmental Stewardship and Compliance Assistance Center. 9. Sacoby M. Wilson, Christopher D. Heaney, John Cooper, and Omega Wilson.
Environmental Justice. September 2008, 1(2): 63-72. doi:10.1089/env.2008.0509. 10.Schaider, L. A.; Ackerman, J. M.; Rudel, R. A., Septic systems as sources of organic
wastewater compounds in domestic drinking water wells in a shallow sand and gravel aquifer. Science of the Total Environment 2016, 547, 470-481.
11.Schaumberg, Debra A., et al. "Accumulated lead exposure and risk of age-related cataract in men." Jama 292.22 (2004): 2750-2754.
12.Swistock, B. R.; Clemens, S., “Water quality and management of private drinking water wells in Pennsylvania”. Journal of environmental health 2013, 75.6, 60-66.
13.Triantafyllidou, Simoni, and Marc Edwards. "Lead (Pb) in tap water and in blood: implications for lead exposure in the United States." Critical Reviews in Environmental Science and Technology 42.13 (2012): 1297-1352.
21
Drinking Symposium on Your Solution for the 21st Century, New Haven, Connecticut. 2009.
15.Troesken, Werner. "Lead water pipes and infant mortality at the turn of the twentieth century." Journal of Human Resources 43.3 (2008): 553-575.
16.Watt, G. C. M., et al. "Public health implications of new guidelines for lead in drinking water: a case study in an area with historically high water lead levels." Food and Chemical Toxicology 38 (2000): S73-S79.
17.Watt, Graham CM, et al. "Is lead in tap water still a public health problem? An observational study in Glasgow." BMJ 313.7063 (1996): 979-981.
18.Macintyre, Cecilia, et al. "Changes in blood lead and water lead in Edinburgh. An eight year follow-up to the Edinburgh lead study." Environmental geochemistry and health 20.3 (1998): 157-167.
19.Centers for Disease Control and Prevention (CDC. "Blood lead levels in residents of homes with elevated lead in tap water--District of Columbia, 2004." MMWR. Morbidity and mortality weekly report 53.12 (2004): 268.
20.Hanna-Attisha, Mona, et al. "Elevated blood lead levels in children associated with the Flint drinking water crisis: a spatial analysis of risk and public health response." American journal of public health 106.2 (2016): 283-290.
21.Etchevers, Anne, et al. "Environmental determinants of different blood lead levels in children: A quantile analysis from a nationwide survey." Environment international 74 (2015): 152-159.
22.Deshommes, Elise, et al. "Evaluation of exposure to lead from drinking water in large buildings." Water research 99 (2016): 46-55.
23.Etchevers, Anne, et al. "Screening for elevated blood lead levels in children: Assessment of criteria and a proposal for new ones in France." International journal of environmental research and public health 12.12 (2015): 15366-15378.
24.Levallois, Patrick, et al. "The impact of drinking water, indoor dust and paint on blood lead levels of children aged 1–5 years in Montréal (Québec, Canada)." Journal of Exposure Science and Environmental Epidemiology 24.2 (2014): 185-191.
25.Miranda, Marie Lynn, et al. "Changes in blood lead levels associated with use of
chloramines in water treatment systems." Environmental health perspectives (2007): 221-225.
22
27.Sanborn, Margaret D., et al. "Identifying and managing adverse environmental health effects: 3. Lead exposure." Canadian Medical Association Journal 166.10 (2002): 1287-1292.
28.Pirkle, James L., et al. "The decline in blood lead levels in the United States: the National Health and Nutrition Examination Surveys (NHANES)." Jama 272.4 (1994): 284-291.
29.Pontius, Frederick W. "LEGISLATION/REGULATION: The New Lead and Copper Rule." Journal (American Water Works Association) 83.7 (1991): 12-109.
30.Environmental Protection Agency (US). Drinking water regulations: maximum contaminant level goals and national drinking water regulations for lead and copper. Fed Regist 1991;53;110.
31.Maas, Richard P., et al. "Reducing lead exposure from drinking water: recent history and current status." Public Health Reports 120.3 (2005): 316-321.
32.Moher, David, et al. "Preferred reporting items for systematic reviews and meta-analyses: the PRISMA statement." PLoS med 6.7 (2009): e1000097.
33.Abadin, Henry, et al. Toxicological profile for lead. Agency for Toxic Substances and Disease Registry (US), Atlanta (GA), 2007.
34.Elwood, Peter C. "The sources of lead in blood: a critical review." Science of the total environment 52.1-2 (1986): 1-23.
35. Peter Jüni, Franziska Holenstein, Jonathan Sterne, Christopher Bartlett, Matthias Egger; Direction and impact of language bias in meta-analyses of controlled trials: empirical study. Int J Epidemiol 2002; 31 (1): 115-123.
36.Kim, S. Y., Park, J. E., Lee, Y. J., Seo, H. J., Sheen, S. S., Hahn, S., ... & Son, H. J. (2013). Testing a tool for assessing the risk of bias for nonrandomized studies showed moderate reliability and promising validity. Journal of clinical epidemiology, 66(4), 408-414.
37.Sathyanarayana, Sheela, et al. "Predicting children’s blood lead levels from exposure to school drinking water in Seattle, Washington, USA." Ambulatory Pediatrics 6.5 (2006): 288-292.
38.Deshommes, Elise, et al. "Application of lead monitoring results to predict 0–7 year old children's exposure at the tap." Water research 47.7 (2013): 2409-2420.
23
40.Triantafyllidou, Simoni, et al. "Reduced risk estimations after remediation of lead (Pb) in drinking water at two US school districts." Science of the Total Environment 466 (2014): 1011-1021.
41.Akers, D. Brad, et al. "Lead (Pb) contamination of self-supply groundwater systems in coastal madagascar and predictions of blood lead levels in exposed
children." Environmental science & technology 49.5 (2015): 2685-2693.
42.Fertmann, Regina, et al. "Lead exposure by drinking water: an epidemiologial study in Hamburg, Germany." International journal of hygiene and environmental health 207.3 (2004): 235-244.
43.Lanphear, Bruce P., et al. "Environmental lead exposure during early childhood." The Journal of pediatrics 140.1 (2002): 40-47.