Original Research Article
Evaluation of serum c-peptide levels in type 2 diabetics in
Punjabi population
Hardeep Singh Deep, Barjinder Pal Singh*, Shalinder Pal Singh
INTRODUCTION
Diabetes mellitus is a chronic metabolic and endocrine disorder characterized by chronic hyperglycemia with disturbances of carbohydrate, fat and protein metabolism resulting from defects in insulin secretion, insulin action or both. It is a major cause of mortality and morbidity worldwide. The incidence of this disorder is increasing worldwide.1 Human insulin and c-peptide are synthesized
as a single polypeptide chain known as proinsulin in the pancreatic islet by the beta cells. Proinsulin is cleaved proteolytically to form equimolar amounts of mature insulin and C-peptide and both are released in the portal vein. C peptide is a single peptide chain of 31 amino acids with molecular weight of 30200 g/mol. It is called as C-peptide because it connects the A and B chains of insulin in Proinsulin.2
ABSTRACT
Background: Diabetes mellitus is a chronic metabolic and endocrine disorder characterized by chronic hyperglycemia with disturbances of carbohydrate, fat and protein metabolism resulting from defects in insulin secretion, insulin action or both. It is a major cause of mortality and morbidity worldwide. Human insulin and c-peptide are synthesized as a single polyc-peptide chain known as Proinsulin in the pancreatic beta cells. Serum insulin measurement gives a wrong value of insulin secretion, because insulin after its secretion into the portal vein, passes through the liver where approximately 50% of the delivered insulin is extracted. The measurement of C-peptide, thus provides a better index of endogenous insulin production and pancreatic beta cell function than insulin measurements. Methods: The present study was conducted on 100 adult patients of type 2 diabetes mellitus presenting in OPD and emergency or admitted in Sri Guru Ram Das Institute of Medical Sciences and Research, Amritsar. Type 1 diabetic patients, pregnant females with diabetes, patients presenting with acute infections, septicaemia, patients with acute or chronic pancreatitis, patients with pancreatic carcinoma were excluded from the study. In this study C-Peptide levels were estimated by DRG C-peptide ELISA method.
Results: In our study, 38% patients had adequate insulin reserve (Normal C-peptide levels). Only 2% patients had poor insulin reserve (C-peptide levels below normal). 60% patients had c peptide levels more than normal, indicating insulin resistance. Increase in fasting c-peptide levels were associated with increased fasting plasma glucose (due to insulin resistance). A positive correlation exists in our study with r value of 0.523.
Conclusions: As majority of patients with elevated FBS and fasting c-peptide were obese, our study infers that obese are more insulin resistant than non-obese. Since c-peptide levels assess the endogenous insulin reserve, it will also be helpful to alter the treatment modality based on it. So, routine c-peptide testing should be done in patients with poor glycaemic control to modify treatment modality accordingly.
Keywords: C-peptide, Type 2 diabetes mellitus
Department of Medicine, Sri Guru Ram Das Institute of Medical Sciences and Research, Amritsar, Punjab, India
Received: 07 May 2017 Accepted: 03 June 2017
*Correspondence: Dr. Barjinder Pal Singh,
E-mail: barjinder007@gmail.com
Copyright: © the author(s), publisher and licensee Medip Academy. This is an open-access article distributed under the terms of the Creative Commons Attribution Non-Commercial License, which permits unrestricted non-commercial use, distribution, and reproduction in any medium, provided the original work is properly cited.
The great interest in C-peptide is due to the limitations of the use of serum insulin as a measure of insulin secretion because insulin after its secretion into the portal vein, passes through the liver where approximately 50% of the delivered insulin is extracted.3 Within the physiologic
range of insulin concentrations, there is variable fraction of hormone extracted by liver. Peripheral insulin concentration therefore is the post hepatic insulin delivery rather than the actually secreted insulin by the pancreatic beta cells.3
Before the development of C-peptide assays, evaluation of beta cell function in insulin treated patients was impossible as the insulin assay was unable to discriminate between secreted and injected insulin. Further, insulin measurements were disturbed more than C-peptide measurements because of the presence of insulin binding antibodies.4 The measurement of C-peptide, which is
co-secreted with insulin from beta cells of pancreas, thus provides a better index of endogenous insulin production and pancreatic beta cell function than insulin measurements.4
With the advent of newer drugs to overcome insulin resistance it has become all the more important to know about the pathophysiology of diabetes, whether endogenous insulin secretion is normal and to know about insulin resistance. Keeping this perspective in mind, this study was conducted to assess the endogenous insulin secretory function in a randomized sample of patients with type 2 diabetes.
METHODS
The present study was conducted on 100 adult patients of Type 2 Diabetes Mellitus presenting in OPD and emergency or admitted in Sri Guru Ram Das Institute of Medical Sciences and Research, Amritsar. Informed consent was taken from all the subjects included in the study and the approval from hospital ethical committee was taken. Type 1 diabetic patients, pregnant females with diabetes, patients presenting with acute infections, septicemia, patients with acute or chronic pancreatitis, patients with pancreatic carcinoma were excluded from the study. Patients were assigned a diagnosis of diabetes mellitus (according to ADA criteria), if:
• HBA1C>6.5% or,
• fasting plasma glucose greater than 126 mg/dl
(7.0mmol/l) or,
• 2-hr plasma glucose >=200mg/dL (11.1mmol/l)
during an OGTT (75gm oral glucose) or,
• In a patient with classic symptoms of hyperglycemia
or hyperglycemic crisis, a plasma glucose
>=200mg/dl (11.1mmol/l).
After taking informed consent of the patient, detailed history was taken. Complete general physical
examination was done with due emphasis on
anthropometry. BMI was calculated by dividing the
weight in Kg and the square of the height in meters. Patients having BMI 30 or more were taken as obese according to WHO criteria.
Following investigations were performed in each patient
A. Hemogram (hemoglobin, total leukocyte count,
differential leukocyte count, platelet count).
B. Fasting blood sugar estimation by GOD-POD
method (Trinder).6
C. C-peptide levels by DRG C-peptide ELISA.7
D. Glycosylated hemoglobin (HbA1c) estimation by
Nyocard Reader (Jeppsson).8
E. Fasting lipid profile
• Serum total cholesterol was estimated by enzymatic
method as described by Allain.9
• Serum Triglyceride was estimated by GPO-trinder
method as described by Trinder.10
• Serum high density lipoprotein (HDL) was
estimated by Phosphotungstic Acid method as described by Brustein et al.11
• Serum low density lipoprotein (LDL) was estimated
by Friedwald- equation given by Friedwald .12
• Serum very low density lipoprotein (VLDL) was
estimated by Friedwald- equation given by Friedwald.12
• Dyslipidemia was diagnosed by The third report of the expert panel on detection, evaluation, and treatment of high blood cholesterol in adults (Adult Treatment Panel III, or ATP III) by National
Cholesterol Education Program’s (NCEP’s)
guidelines.
In this study, c peptide levels of less than 0.5 ng/ml were considered less than normal, between 0.5 and 3.2 ng/ml as normal and more than 3.2 ng/ml as more than normal.
After completion of the study, the data was analysed, compared and evaluated statistically. Chi square test for non-parametric data and student’s t test for parametric data were applied. p value of less than 0.05 was considered significant and less than 0.001 as highly significant.
RESULTS
This study was conducted on 100 patients, 27-82 years old with mean age of 54 years, having sex distribution with 43 males and 57 females. Mean height, weight and BMI of the patients were 160.8cm, 71.03 kg and 27.74
kg/m2 respectively. 46% patients were obese and
remaining 54% were non-obese (Table 1).
Table 1: Demographic data of subjects in study.
Parameter Value
Mean age 54 years
Sex distribution Male:female = 43:57
Mean height 160.8 cm
Mean weight 71.03 kg
Mean BMI 27.74 kg/m2
Obesity 46%
Table 2: Investigations of subjects in study.
Parameter Value
Mean FBS 213.21 mg/dl
Mean HbA1c 10.17%
Mean C-peptide levels 7.9 ng/ml
Dyslipidemia (Number of patients) 51%
Figure 1: C-peptide levels in the study group.
Figure 2: Mean fasting blood sugar levels in obese and non-obese patients.
C peptide levels were below normal (< 0.5 ng/ml) in 2%, normal (0.5 - 3.2 ng/ml) in 38% and above normal (> 3.2 ng/ml) in 60 % patients (Figure 1).
Mean fasting blood sugar (FBS) levels were much higher in obese patients (260.91±60.82 mg/dl) as compared to non-obese patients (172.57±47.29 mg/dl). This indirectly indicates that the insulin resistance plays an important role in causing elevated FBS level despite elevated c peptide levels in the obese patients (Figure 2).
Mean C peptide levels were much higher in obese (13.53±8.48) than non-obese patients (3.12±3.15). The increased levels of C- peptide along with increased FBS in obese patients indicate insulin resistance (Figure 3).
Figure 3: Mean C-peptide levels compared in obese and non-obese patients.
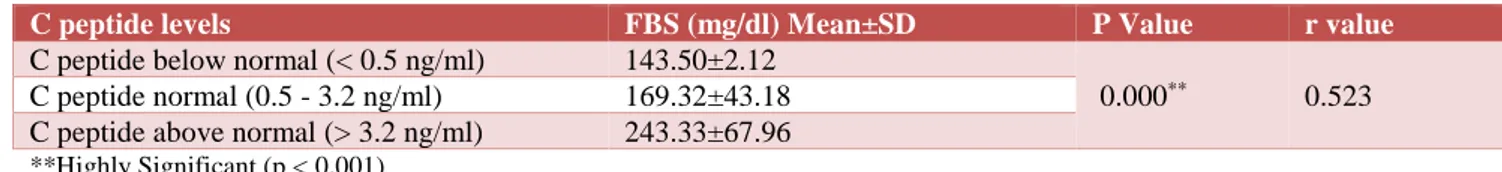
Mean fasting blood sugar (FBS±SD) were 143.50±2.12 mg/dl in below normal C-Peptide (< 0.5 ng/ml), 169.32±43.18 mg/dl in normal C-peptide (0.5 - 3.2 ng/ml) and 243.33±67.96 mg/dl in above normal C-peptide (>3.2 ng/ml) patients. Thus, mean FBS levels were higher in patients with higher than normal C-peptide levels which is highly significant statistically (p<0.001). This shows that increase in fasting c-peptide levels were associated with increased fasting plasma glucose due to insulin resistance. A positive correlation exists in our study with r value of 0.523 (Table 3).
Table 3: FBS compared with c-peptide levels.
C peptide levels FBS (mg/dl)Mean±SD P Value r value
C peptide below normal (< 0.5 ng/ml) 143.50±2.12
0.000** 0.523
C peptide normal (0.5 - 3.2 ng/ml) 169.32±43.18
C peptide above normal (> 3.2 ng/ml) 243.33±67.96
**Highly Significant (p < 0.001)
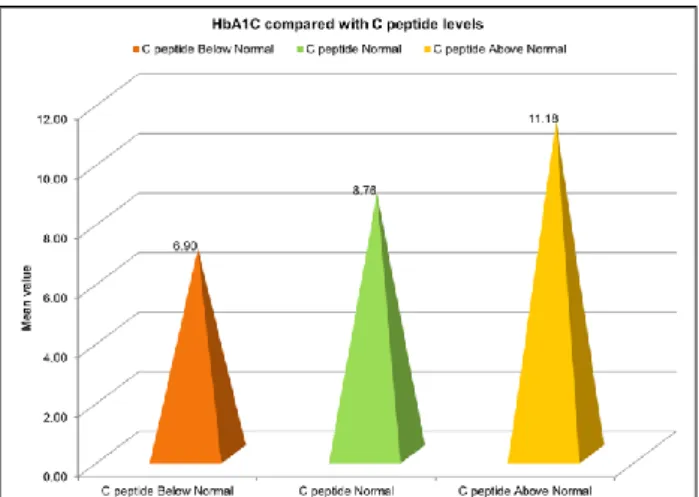
Mean HbA1c was higher (11.18±2.37) in patients with c peptide above normal (> 3.2 ng/ml) and was statistically
(high c peptide levels). This shows that increase in fasting c-peptide levels were associated with increased HbA1C levels due to insulin resistance. A positive correlation exists in our study with r value of 0.440 (Figure 4).
Figure 4: Mean Hba1c levels compared with c-peptide levels.
Dyslipidemia (according to NCEP ATP III guidelines) was seen in 48% patients also having above normal c peptide levels (>3.2ng/ml) and was statistically highly significant (p<0.001) (Figure 5).
Figure 5: Dyslipidemia compared with c-peptide levels.
DISCUSSION
Diabetes Mellitus is the commonest endocrine disorder in the population. The clinical syndrome is due to either absolute or relative deficiency of insulin. It is a major cause of mortality and morbidity worldwide. Type 1 DM is caused by auto immune destruction of the beta cells of the pancreas, rendering it unable to synthesize and secrete insulin. Type 2 DM is a result of combination of insulin resistance and inadequate secretion of insulin.13
The great interest in C-peptide is due to the limitations of the use of serum insulin as a measure of insulin secretion
because insulin after its secretion into the portal vein, passes through the liver where approximately 50% of the delivered insulin is extracted. Before the development of C-peptide assays, evaluation of beta cell function in insulin treated patients was impossible as the insulin assay was unable to discriminate between secreted and injected insulin. Further, insulin measurements were disturbed more than C-peptide measurements because of the presence of insulin binding antibodies. The measurement of C-peptide, which is co-secreted with insulin from beta cells of pancreas, thus provides a better index of endogenous insulin production and pancreatic beta cell function than insulin measurements.14
With the advent of newer drugs to overcome insulin resistance it has become all the more important to know about the pathophysiology of diabetes, whether endogenous insulin secretion is normal and to know about insulin resistance. Keeping this perspective in mind, this study was conducted to assess the endogenous insulin secretory function in a randomized sample of patients with type 2 diabetes.
In this study, the fasting c-peptide levels in the obese patients were increased compared to the non-obese individuals. The fasting plasma glucose levels were also elevated despite elevated c-peptide levels in the obese patients, proving the role of insulin resistance.
As majority of patients with elevated FBS and fasting c-peptide were obese, our study infers that obese are more insulin resistant than non-obese. Dyslipidemia was also more in patients having high c peptide levels.
Since c-peptide levels assess the endogenous insulin reserve, it will also be helpful to alter the treatment modality based on it. Those patients with adequate insulin reserve, will only require diet and exercise modalities of treatment to improve insulin sensitivity in addition to oral hypoglycemic insulin sensitizing drugs. And those patients with poor insulin reserve in the form of low c-peptide levels will require insulin therapy.
CONCLUSION
Since, measurement of C-peptide is a better index of endogenous insulin production and pancreatic beta cell function than insulin measurements, this study suggests routine c-peptide testing in patients with poor glycaemic control so that treatment modality can be modified based on c-peptide levels (endogenous insulin reserve).
Moreover, in clinical practice, emphasis should be given to educating patients about lifestyle modifications and to prevent obesity.
Funding: No funding sources Conflict of interest: None declared
REFERENCES
1. Ramachandran A, Snehalatha C, Kapur A. Diabetes
epidemiology study in India (DESI). High prevalence of diabetes and IGT in India: National
Urban Diabetes Survey. Diabetologia.
2001;44:1094-101.
2. Ashby TD, Frier BM. Circulating c-peptide
measurement and clinical application. Annals Clin Biochem. 1981;18:125.
3. Ferranini E, Cobelli C. The kinetics of insulin in
man. Role of the liver. Diabetes Metab
Rev.1987;3:365-97.
4. Tura A, Ludvik B, Nolan JJ, Pacini G, Thomaseth K. Insulin and C-peptide secretion and kinetics in humans: direct and model-based measurements
during OGTT. Am J Physio-Endocrinol
Metabolism. 2001;281(5):E966-74.
5. American Diabetes Association. Standards of
medical care in diabetes-2014. Diabetes Care. 2014; 37(1):S81-S90.
6. Trinder P. Blood sugar estimation by GOD-POD
method. Ann Clin Biochem. 1969;6:24.
7. Bonger A, Garcia-Webb P. C-peptide measurement:
Methods and clinical utility. Crit Rev Clin Lab Sci. 1971;19:297.
8. Jeppsson JO, Kobold U, Barr J, Finke A, Hoelzel W, Hoshino T, et al. Approved IFCC reference method for the measurement of HbA1c in human blood. Clin Chem Lab Med. 2002;40:78-89.
9. Allain CC, Poon LS, Chan CSG, Richmond W, Fu
P. LDL-D cholesterol kit (Direct Enzymatic Method). Clin Chem. 1974;20:470-5.
10. Trinder P. Cholesterol (SR) Kit. Ann Clin Biochem.
1969;6:24-7.
11. Burnstein M, Scholnic HR, Morfin R.
Phosphotungstic acid method, End Point J. Lipid Res. 1970;11(6):583-95.
12. Friedwald WT, Levy RI, Freindrickson DS.
Estimation of concentration of low density lipoprotein cholesterol in plasma without use of
preparative ultra-centrifuge. Clin Chem.
1974;18:499.
13. Vasudevan DM. Regulation of blood sugar, insulin and DM, Chapter 10. A Text book of Biochemistry, 2nd edition. Jaypee brother’s publishers, India; 1998;116-7.
14. Abdullah B, Patil B, Thaseen A. Significance of C
-peptide in Type 2 diabetics-A study in the north karnataka population of India. Al Ameen J Med Sci. 2010;3(1):65-78.