Lucrări ştiinŃifice Zootehnie şi Biotehnologii, vol. 41 (2) (2008) Timişoara
AMPLITUDE, TRAJECTORY AND AFFERENT
PARAMETERS ANALYSIS OF THE JUMP OVER A
VERTICAL FENCE IN SPORT HORSES
ANALIZA AMPLITUDINII, A TRAIECTORIEI ŞI A
PARAMETRILOR AFERENłI SĂRITURII PESTE
STAłIONATĂ LA CAII DE SPORT
BOCHIŞ FLAVIA*, DUMITRESCU GABI*, SIMIZ ELIZA*, TRIPON I. *, SIMIZ F. **
*Faculty of Animal Science and Biotechnologies, Timişoara, România
* *Faculty of Veterinary Medicine, Timişoara, România
There are a lot of obstacles type used in jumping competitions. Normally, for every kind of fence, there is a different type of approaching and cross over. The most used obstacles are the vertical fence and the oxer fence. For crossing over the vertical, which is a high fence, the horse must jump only in report to the height of the bar. In the oxer case, which is a large obstacle, the horse must jump related to the height and the largeness of it indeed. In the present study we obtained for the vertical fence, situated at five different levels. The purpose was to measure four parameters for every jump: the taking-off distance, the landing distance, and the distance between bar and legs for the front limbs and for the hind limbs. Based on these, were calculated in report to the type of the show arena the amplitude of the jumps, was assign the trajectory curve and placed the balance point.
Key words: sport horse, jumping parameters, vertical fence.
Introduction
The research is part of a greater study, and it was carried out on 158 jumping horses among five years. For all the jumping parameters description, we obtained for one of the most used obstacles, the vertical fence. All jumps were been executed during show jumping competitions and recorded with a video camera and a photo one. In this sense, the following height dimensions were the standard values for the fence: (80 cm, 100 cm, 110 cm, 120cm and 130 cm height, corresponding to competitional FEI levels: F, E, D, C and B. The arena was covered classically with grass or with sand.
Materials and Methods
The taking-off distance – was measured between the last contact of the hind
limbs with the land and the base of the obstacle.
The distance between bar and limbs – were calculated by measuring for the fore limbs the nearest point of a leg in the moment immediately after started the
ascendant phase, and for the hind limbs the nearest point between one of these and the bar in the last moment before the front limbs take the contact with earth.
The landing distance – it was represented by the measurement from the base
of the obstacle and the first contact of the fore limbs with the land immediately after the jump.
Based on these four jumping over obstacles parameters it was calculated in report to the type of the show arena the amplitude of the jumps and was assign the trajectory curve regarding to the type of fence, with their height and large dimensions.
Results and Discussions
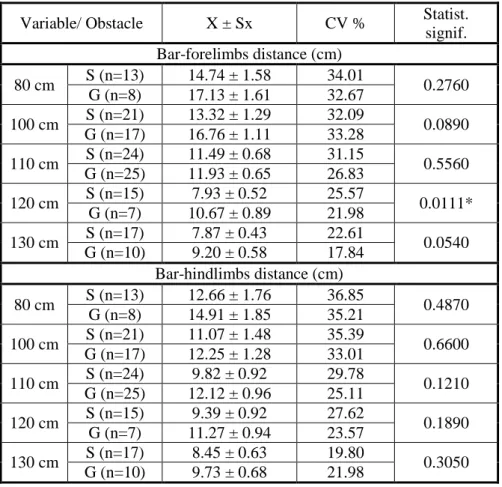
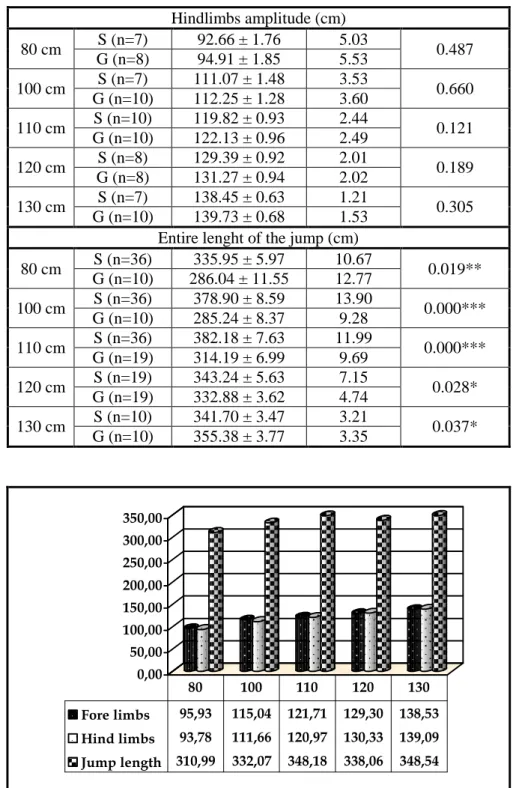
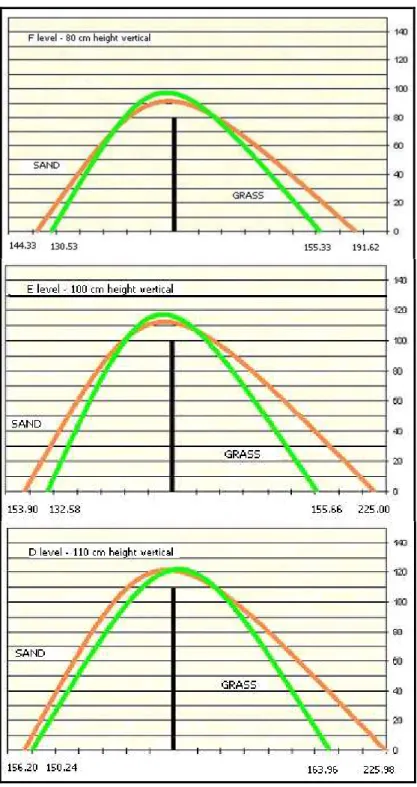
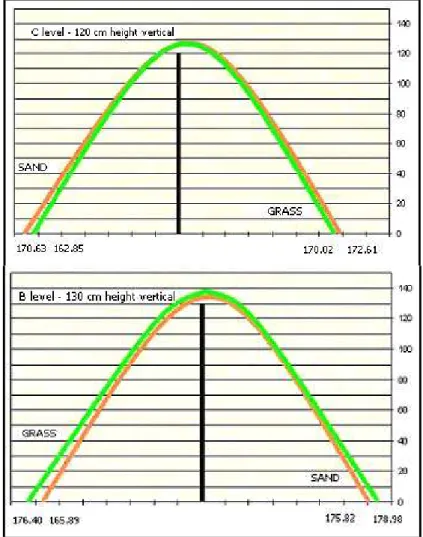
The obtained results are shown in tables 1, 2, 3 and graphics 1, 2A and 2B.
Table 1 Average values for taking off and landing zone in a vertical fence
Variable/ Obstacle X ± Sx CV % Statist. signif.
Taking-off distance (cm)
80 cm S (n=36) 144.33 ± 4.64 19.29 0.2050
G (n=10) 130.53 ± 6.63 16.07
100 cm S (n=36) 153.90 ± 4.90 19.12 0.0220*
G (n=10) 132.58 ±3.87 9.22
110 cm S (n=36) 156.20 ± 4.19 16.11 0.4100
G (n=19) 150.24 ± 4.35 12.61
120 cm S (n=19) 170.63 ± 3.22 8.22 0.0220*
G (n=19) 162.85 ± 2.35 6.29
130 cm S (n=10) 165.89 ± 2.27 4.33 0.0090**
G (n=10) 176.40 ± 2.28 4.08
Landing distance (cm)
80 cm S (n=36) 191.62 ± 5,35 16.76 0.0000***
G (n=10) 155.53 ± 5,23 10.63
100 cm S (n=36) 225.00 ± 7,01 18.69 0.0000***
G (n=10) 152.66 ± 4,77 9.89
110 cm S (n=36) 225.98 ± 6,47 17.17 0.0000***
G (n=19) 163.96 ± 2,87 7.63
120 cm S (n=19) 172.61 ± 4,39 11.08 0.8380
G (n=19) 170.02 ± 2,85 7.31
130 cm S (n=10) 175.82 ± 2,71 4.87 0.3070
Table 2 Average values for distances between bar and limbs in a vertical fence
Variable/ Obstacle X ± Sx CV % Statist.
signif. Bar-forelimbs distance (cm)
80 cm S (n=13) 14.74 ± 1.58 34.01 0.2760
G (n=8) 17.13 ± 1.61 32.67
100 cm S (n=21) 13.32 ± 1.29 32.09 0.0890
G (n=17) 16.76 ± 1.11 33.28
110 cm S (n=24) 11.49 ± 0.68 31.15 0.5560
G (n=25) 11.93 ± 0.65 26.83
120 cm S (n=15) 7.93 ± 0.52 25.57 0.0111*
G (n=7) 10.67 ± 0.89 21.98
130 cm S (n=17) 7.87 ± 0.43 22.61 0.0540
G (n=10) 9.20 ± 0.58 17.84
Bar-hindlimbs distance (cm)
80 cm S (n=13) 12.66 ± 1.76 36.85 0.4870
G (n=8) 14.91 ± 1.85 35.21
100 cm S (n=21) 11.07 ± 1.48 35.39 0.6600
G (n=17) 12.25 ± 1.28 33.01
110 cm S (n=24) 9.82 ± 0.92 29.78 0.1210
G (n=25) 12.12 ± 0.96 25.11
120 cm S (n=15) 9.39 ± 0.92 27.62 0.1890
G (n=7) 11.27 ± 0.94 23.57
130 cm S (n=17) 8.45 ± 0.63 19.80 0.3050
G (n=10) 9.73 ± 0.68 21.98
Table 3 Average values for entire jumping amplitude in a vertical fence
Variable/ Obstacle X ± Sx CV % Statist. signif.
Forelimbs amplitude (cm)
80 cm S (n=10) 94.74 ± 1,58 5.29 0.276
G (n=12) 97.13 ± 1,61 5.76
100 cm S (n=11) 113.32 ± 1,29 3.77 0.089
G (n=25) 116.76 ± 1,11 4.78
110 cm S (n=28) 121.49 ± 0,68 2.95 0.556
G(n=24) 121.93 ± 0,65 2.62
120 cm S (n=15) 127.93 ± 0,52 1.58 0.012**
G (n=7) 130.67 ± 0,89 1.79
130 cm S (n=17) 137.87 ± 0,43 1.29 0.054
Hindlimbs amplitude (cm)
80 cm S (n=7) 92.66 ± 1.76 5.03 0.487
G (n=8) 94.91 ± 1.85 5.53
100 cm S (n=7) 111.07 ± 1.48 3.53 0.660
G (n=10) 112.25 ± 1.28 3.60
110 cm S (n=10) 119.82 ± 0.93 2.44 0.121
G (n=10) 122.13 ± 0.96 2.49
120 cm S (n=8) 129.39 ± 0.92 2.01 0.189
G (n=8) 131.27 ± 0.94 2.02
130 cm S (n=7) 138.45 ± 0.63 1.21 0.305
G (n=10) 139.73 ± 0.68 1.53
Entire lenght of the jump (cm)
80 cm S (n=36) 335.95 ± 5.97 10.67 0.019**
G (n=10) 286.04 ± 11.55 12.77
100 cm S (n=36) 378.90 ± 8.59 13.90 0.000***
G (n=10) 285.24 ± 8.37 9.28
110 cm S (n=36) 382.18 ± 7.63 11.99 0.000***
G (n=19) 314.19 ± 6.99 9.69
120 cm S (n=19) 343.24 ± 5.63 7.15 0.028*
G (n=19) 332.88 ± 3.62 4.74
130 cm S (n=10) 341.70 ± 3.47 3.21 0.037*
G (n=10) 355.38 ± 3.77 3.35
0,00 50,00 100,00 150,00 200,00 250,00 300,00 350,00
Fore limbs 95,93 115,04 121,71 129,30 138,53
Hind limbs 93,78 111,66 120,97 130,33 139,09
Jump length 310,99 332,07 348,18 338,06 348,54
80 100 110 120 130
Graphic 2 B. Flight trajectory over the fence in F, E and D level competitions on sand and grass arena
By comparing the resulted jumping parameters on grass in report to the sand arena, in more than a half of values there were statistical significant differences.
Conclusions
Average values for the bar-limbs distance in both, fore and hind limbs, decrease in the same time with the increasing of the obstacle height. More than this, for all ten pares of the calculated results, the measured distance between fence and limbs, was always higher for the jumps made on grass arena, then those made on sand arena.
The taking off distance for the vertical fence, increased together with the height of the obstacle. In the same time for the landing zone distance there were registered results that cannot be integrated in a gradual scale. With a single exception (level B), all the jumps length were longer in the sand covered arena, in report to the grass covered arena made jumps.
The calculated amplitude for all jumps, increased together with the height of the obstacle; even more the variability coefficients decrease with the same height of the fence, which means an increasing for the low level courses.
The trajectory of the horse’s made jumps, described a more and more symmetrical curve together with the increasing difficultness of the competition. Excepting the 130 cm height vertical, in all cases, the jump trajectory on sand arenas were longer than those measured on grass arenas. All parts of the taking off trajectory were shorter than the landings, without any important of the land texture. The higher point of the jump, where it takes place the changing of the balance in horse-rider couple, was in average (sand-grass) before the fence in F and E level courses, over the obstacle in D level competitions and after the bar in C and B level courses.
Bibliography
1. Bochiş Flavia, L.T. Cziszter, G. Stanciu, S. Acatincăi, Erina Silvia (2003) – Basic principles in horse-rider relationship, Scientifical Papers, Faculty of Animal Science and Biotechnologies, Timişoara, pg. 100-105
2. Deuel R. Nancy, Lawrance L.M., (1987) - Individuality in Equine Gallop Motion Patterns, Proceed. of the Second Int. Conf. on Equine Exerc. Physiology,
ICEEP Publications, Davis, California, pg. 564-573
3. Lagarde J., Peham C., Licka T., Kelso A.S. (2005) – Coordination Dynamics of the Horse-Rider System, Journal of Motion and Behavior, Nov; 37(6):
pg. 418–424
4. Lewczuk D., Reklewski Z. (2002) – Analysis of untrained colt’s jumping parameters – preliminary results, Institute of Genetic and Animal Breeding, Polish