Global Insurance
Market Trends
2013
OECD Insurance and Private Pensions Committee
The importance of insurance as a foundation for economic activity was acknowledged at the inception of the OECD with the creation of the Insurance Committee in 1961. The scope of activities of the Insurance Committee has gradually widened, and now covers the topic of private pensions, reflecting the importance of private pension systems in OECD countries (the Committee was accordingly renamed the Insurance the Private Pensions Committee in 2005).
Today, the Committee’s work focuses on: promoting insurance market monitoring; collecting, analysing and disseminating insurance statistics; improving risk awareness, financial education and consumer protection; strengthening private pension systems to help them address the challenges of an ageing population; improving financial regulation and governance; and addressing the mitigation and compensation of catastrophic risks. The Committee engages in a range of co-operative activities with non-member economies.
This work is published on the responsibility of the Secretary-General of the OECD. The opinions expressed and arguments employed herein do not necessarily reflect the official views of the Organisation or of the governments of its member countries. This document and any map included herein are without prejudice to the status of or sovereignty over any territory, to the delimitation of international frontiers and boundaries and to the name of any territory, city or area.
Foreword
The OECD has been collecting insurance statistics for almost two decades, with data on the insurance sector dating back to the early 1980s. In response to the financial crisis, a Global Insurance Statistics (GIS) project was launched as part of the OECD’s insurance market monitoring activities. The main objective was to expand the scope of the OECDs statistical framework for insurance and extend its global reach, with a view to enhancing the transparency of insurance markets. These changes led to the collection of key balance sheet and income statement items for the direct insurance and reinsurance sectors, and to the gradual global expansion of the OECDs international insurance statistics database.
As a complement to its insurance market statistics, the OECD decided to initiate the publication of an annual monitoring report that makes use of the GIS database. This publication, Global Insurance Market Trends, provides an overview of market trends for developing a better understanding of the insurance industry’s overall performance and health. This third edition of the Global Insurance Market Trends provides a more global perspective through the addition of a large group of countries from Latin America, achieved through cooperation with the Association of Latin American Insurance Supervisors (ASSAL). Already a number of non-OECD countries contribute to the report, particularly from Asia. In the future, the report will seek to encompass additional countries and other aspects of insurance and reinsurance.
This monitoring report and the GIS database will provide an increasingly valuable cross-country source of data and information on the insurance sector developments for use by governmental and supervisory authorities, central banks, the insurance sector and broader financial industry, consumers and the research community. An OECD project will be launched in 2014 in order to further improve the relevance and quality of the GIS framework, ensuring that it meets the evolving needs of diverse users of insurance statistics and further promotes the transparency of insurance markets and operations of insurance undertakings.
TABLE OF CONTENTS
FOREWORD ... 3
HIGHLIGHTS ... 5
Underwriting performance ... 7
Life and non-life insurance premium growth. ... 7
Claims development ... 12
Combined ratio for non-life sector ... 15
Investment allocation and performance ... 16
Portfolio investment ... 16
Portfolio allocation: Composite insurers ... 19
Investment results ... 24
Profitability ... 25
ADDITIONAL NOTES AND REFERENCE SERIES ... 28
Notes to be taken into consideration when interpreting the data ... 28
Specific notes ... 29
FIGURES Figure 1. Annual real gross premium growth: Life sector (2011 - 2012) ... 9
Figure 2. Annual real gross premium growth: Non-Life Sector (2011 – 2012) ... 12
Figure 3. Nominal growth in gross claims payments: Life sector (2011 – 2012) ... 13
Figure 4. Nominal growth in gross claims payments: Non-Life sector (2011- 2012) ... 15
Figure 5. Combined ratio for non-life segment (2011 – 2012) ... 16
Figure 6. Investment portfolio allocation: Life insurers (2012)... 18
Figure 7. Investment portfolio allocation: Non-Life insurers (2012) ... 19
Figure 8. Investment portfolio allocation: Composite insurers (2012) ... 20
Figure 9. Portfolio allocation to bonds, public and private sector (2012) ... 21
TABLES Table 1. Insurers’ portfolio allocation in bonds and shares by type of insurer (2011-2012) ... 22
Table 2. Average real net investment return by type of insurer (2011-2012) ... 24
Table 3. Return on Equity by type of insurer (2010-2012) ... 26
Table 4. Change in equity position by type of insurer (2011-2012) ... 27
Table 5. Currency exchange rates and consumer price index (CPI) ... 33
Table 6. List of administrative sources ... 34
HIGHLIGHTS
Trends in insurance markets continued to be mixed across countries, reflecting different economic and financial situations, competitive environments, and levels of development.
Insurance markets in some countries continued to feel the effects of the financial and economic crisis. The adverse macroeconomic environment – low growth, high unemployment rates, economic uncertainty and austerity measures – and competitive pressures led to continued negative real premium growth in the life and non-life sectors in these countries. In some cases, tax measures on insurance were imposed.
By contrast, premiums continued to register growth in other countries, particularly in emerging market economies in Asia and Latin America and some developed countries where growth was very robust. In a few developed countries, growth rebounded after a negative trend in earlier years.
In the non-life insurance sector, the incidence and severity of disasters was reduced in comparison to 2011, although several major events did occur. Indeed, the level of insured losses in 2012 was such that it was the third costliest year on record after 2005 and 2011. Insurers have sought to respond to the costs of disasters through increased pricing, an effort that in some countries has reflected attempts to offset increased reinsurance pricing.
Heightened competition in motor insurance markets, typically one of the largest segments within the non-life sector, continued to be experienced in many countries, leading to lower premium rates. This environment, while beneficial for consumers, has raised issues in some countries regarding pricing adequacy and profitability of the segment.
Given the constrained environment in the non-life sector, there has been an industry focus in many countries on generating, amidst price competition, pure underwriting profit, which has entailed cost-cutting and the development of new distribution channels and marketing strategies.
The low interest rate environment continues to present challenges for the life insurance sector: it affects the ability of the life insurance sector to offer savings products with competitive interest rates; it renders the provision of explicit or implicit yield guarantees on long-term savings products more costly; and it makes it more difficult for life insurers, with their generally large holdings of fixed-income assets, to earn adequate returns in relation to their obligations. While the industry has largely been able to withstand pressures, the negative impact could increase should the low yield environment prolong itself. Some countries have been less affected by this trend, for instance where yield guarantees are not provided or where yields on domestic government debt are higher.
The cost of providing financial guarantees is posing challenges to all insurance firms with any form of investment guarantee, not just variable annuity writers.
Competitive pressures from the banking sector and other parts of the financial sector for savings and investments, as well as demand for liquidity given the difficult economic circumstances, have served to highlight lapse risk as a risk for the life sector in some countries. In some countries, banks have started to reduce deposit interest rates, which have eased pressures.
Sovereign risk remains an important risk for the insurance industry given the large exposure of the sector to government debt due to their portfolio holdings. However, this risk abated somewhat in 2012 given the efforts made to ensure the solidity of the Eurozone.
For the sector as a whole, many countries have reported that there is limited or reduced innovation. Insofar as there has been innovation, the trend has been to avoid long-term commitments. The insurance sector, it is reported, appears to be following a survival strategy as opposed to developing new types of products.
Many countries have reported on their efforts to modernise their solvency regimes, and have noted the positive effects of these reforms on insurer governance and risk management. These developments may thus serve to support the resilience of the sector going forward.
Underwriting performance
Life insurance markets continued to contract in real terms in a large number of countries, with some countries experiencing a further downward trend. Meanwhile, other countries saw continued premium growth or witnessed a reversal from earlier negative growth.
Life premiums continued to contract significantly in a large number of countries, principally from the European Union. The poor macroeconomic environment and economic uncertainty appear to have dampened demand for life insurance (including unit-linked products), although competition from the banking sector also served to constrain growth.
The greatest decline was experienced in the Netherlands which witnessed a large decline in life premiums. This negative trend, driven by declining sales, could be observed for both annuities as well as unit-linked products. In Hungary, the negative growth in life premiums turned more sharply negative in 2012. In Spain, premium growth in the life sector turned negative, with a large decrease in the first quarter. This decrease was caused by the economic and financial crisis that increased the policy lapse rate in savings insurance. Premiums in traditional life business and unit-linked insurance fell. The fall in the life premiums in France can be explained by the competition of other saving products, which have reached very similar interest rates, and the household preference for short term financial investments in a context of economic uncertainty.
In Greece, there was a continued, and increased, contraction of gross written premiums in the life sector. This drop in premiums was the most significant since the beginning of the financial crisis. This downward trend, found also in the non-life sector, is due to the impact of the financial crisis on the real economy, which has led to a downward pressure on wages and salaries, increased taxation, high unemployment levels and continued recessionary conditions in Greece.
In Austria, the downward trend in real premium growth continued. The proportion of premiums from unit and index-linked life insurance products continued to decline.
In Italy, the negative trend in premiums was confirmed in 2012, although there were signs of recovery – the decline in growth was less severe than was the case in 2011. Life risk insurance products displayed negative premium growth as did capital redemption products; by contrast, unit and index-linked products experienced premium growth, reversing the declines experienced in 2011. In Portugal, the negative trend in premium growth moderated in comparison with the sharp drop in premiums in 2011.
Australia experienced a reversal of growth in the life insurance sector, mainly due to a decrease in premiums for investment-linked products. The growing popularity of self-managed superannuation funds and industry superannuation are capturing this market. By contrast, life risk insurance premiums grew, although this growth was driven materially by contractual age and inflation adjustments.
In the Czech Republic, premium growth also continued to be negative, reflecting continued stagnation in the life sector. The negative trend in 2012 was due especially to the large amount of single premium contracts, which expired. Similarly, in Slovenia, premium growth continued to be moderately negative, with for instance declines in premiums in unit-linked business. Real growth was experienced in the life insurance class.
In the Slovak Republic, growth in gross written premiums in the life sector continued to be moderately negative, with slow growth experienced in unit-linked insurance and assistance insurance.
Positive trends could be found in new business in all lines of life insurance, with the exception of pension insurance.
By contrast, there was very strong growth in gross written premiums in the life sector in Chile, Korea and Luxembourg. In Chile, during 2012, this increase was coupled with fewer administrative costs. Significant growth was experienced in other Latin American countries. Costa Rica experienced growth due to maturing domestic insurance markets. In the accident and life insurance sector, the maturing of the markets was enhanced by the recent opening of the insurance market to competition.
In Colombia, premiums grew due to growing employment, which favoured demand for coverage of professional risks, group life insurance, and health and accident insurance. In Peru, the sizable increase in total volume of premiums was due largely to increased pension insurance
In Hong Kong (China), and Malaysia premiums grew substantially for both new and in-force life business. In Hong Kong (China), new insurance business comprised, for a large part, non-linked life insurance business. For in-force business, significant growth was observed in individual life and annuity (non-linked) business and retirement scheme insurance business.
In Belgium, life insurance premiums experienced a rebound, reaching their highest level since 2007 and reversing the negative real growth seen in 2011, when premiums levels fell to levels last seen in 2003. While this development appears to be related to renewed growth in investment-linked products, most of the growth likely stemmed from anticipation by households of the tax increase on the savings and investment classes of life insurance, which was set to take effect on 1 January 2013. This surge in premium growth echoes the pattern found in 2005, when premiums rose sharply in anticipation of a tax and then fell back.
In Poland, there was strong real growth in life insurance premiums, reversing the decline registered in 2011. Strong growth was experienced in life insurance and unit-linked insurance, or more specifically to increased sales of investment-type products and structured products.
In Mexico, premium growth remained strong in the life sector. This growth is primarily explained by the increase in sales of insurance products with a saving component, which include products in traditional life insurance as well as annuities products. In the United States, written premiums generally increased across the board, with growth due primarily payments made into annuities and life insurance revenues.
In Iceland, premium growth turned positive in 2012, with the main source of growth coming from traditional term life insurance.
Figure 1. Annual real gross premium growth: Life sector (2011 - 2012) In per cent
Note: For methodological notes, see page 28 onwards. Source: OECD Global Insurance Statistics.
While premiums in the non-life sector enjoyed substantive growth in a wide range of countries, particularly emerging markets, they continued their downward trend in other countries owing to the effects of the financial and economic crisis and heightened competition.
In Greece, gross written premiums continued to contract, and more severely than was the case in 2011. This result was due to the fall in written premiums in motor third party liability insurance, the dominant line of business in the non-life sector, and due to a further significant negative decrease in the other non-life classes. The falling number of vehicles in circulation, due to the effects of the financial crisis and austerity programme, is accounting for the drop in motor insurance.
In Hungary, the negative trend in non-life gross premium growth continued, driven mainly by motor insurance (including third-party liability). Premium growth in motor insurance has been falling since 2007 due both to decreased underlying risks and increased competition. In 2012, an Accident Tax on compulsory motor liability insurance policies was introduced. In other lines of non-life insurance, premiums have been growing but at less than the rate of inflation.
In Portugal, the level of gross written premiums continued to shrink in real terms. Premium levels in workers’ compensation insurance and, to a lesser extent, motor vehicle insurance were also impacted. The decrease reflected the macroeconomic environment and the fiscal situation.
Similarly, in the Slovak Republic, the downward trend in gross written premiums continued in 2012. The decline in non-life insurance was caused primarily by a sharp fall in premiums in motor insurance and property insurance. In the Netherlands, premiums declined in real terms. The introduction of tax-efficient bank saving (banksparen) and the fall of confidence in the life sector caused a downward trend in the sales of new policies, which has dropped dramatically.
In the Czech Republic, real gross premium growth in the non-life sector continued to be negative. Strong competition within the motor insurance market, which compressed premium levels, was largely responsible for this slowdown.
In Slovenia, premium growth continued on a negative trend, with substantial declines evidenced for instance in motor third party liability insurance, with premiums falling due to increased competition in the motor insurance market. Land motor vehicle insurance also witnessed a decline in premiums.
Strong growth in non-life premiums was, by comparison, experienced in a large number of reporting Asian, European and Latin American insurance markets. Within Asia, strong growth was witnessed in Singapore and Hong Kong (China). In Hong Kong (China), the driving force behind the increase in non-life insurance premiums was notably an increase in the general liability business (including Employee Compensation business), and accident and health business.
In Europe, in Belgium, premium growth reflected, in part, efforts by insurers to improve profitability, which involved raising premium levels, improving cost controls, and tightening underwriting terms for certain loss-making insurance products.
In Latin America, Brazil, Colombia, Costa Rica, Cuba, Nicaragua, Peru and Uruguay achieved strong premium growth. In Colombia, premium growth was linked to increased sales of motor insurance. In Costa Rica, growth in vehicle, fire and other property damage and accident, sickness and life insurance products remained stable; however, there was growth in accident and sickness insurance. In Peru, growth within the non-life market was driven by school and health insurance and fire and motor insurance.
In Canada, there was robust growth in property and casualty insurance. Direct premium growth was strongest for motor vehicle, fire and property insurance and other classes of insurance. Although the general trend for non-life insurance in Canada was one of growth, there was a slight decrease in growth in transport insurance and accident and sickness insurance.
In Australia, premium growth strengthened in 2012. Most of this increase was driven by householders and fire and industrial special risk property insurance classes. In particular, personal and commercial property classes saw increases in real premiums as insurers sought to pass on the higher
costs of reinsurance following the disaster events of late 2010 and early 2011. By contrast, premium growth in long tail classes of non-life insurance continued to be more subdued.
In Mexico, premiums grew at a reduced rate in comparison with 2011, owing to the effects of the PEMEX insurance policy, a large multi-year insurance policy. Real growth would otherwise have been more than double the registered real growth. Mexican non-life insurance direct premiums increased particularly due to growth in property and casualty insurance, automobile insurance and health and accident insurance.
In the United States, the positive trend in premium growth continued, due to improved economic conditions and higher premium rates, particularly in the commercial market, led by increased pricing in workers’ compensation insurance.
The non-life insurance sector in Switzerland posed robust premium growth. There was a strong increase in fire and property claims with robust construction and a stable economic environment and population growth in Switzerland. Within the motor vehicle industry there was an increasing number of vehicles which led to growth in automobile insurance.
In Poland, there was a continued upward trend in premiums in the non-life sector. Market growth was driven mainly by motor third party liability insurance, primarily due to increased pricing. Premium increases also occurred in “other third party liability” insurance as a result of the introduction of new third party liability insurance products. Growth was also experienced in “other physical damage” insurance due to the growing number of insurance agreements being concluded.
In Iceland, growth in written premiums turned positive in 2012, with strong growth exhibited in the property class of insurance. Motor insurance also grew in terms of written premiums.
Figure 2. Annual real gross premium growth: Non-Life Sector (2011 – 2012) In per cent
Note: For methodological notes, see page 28 onwards. Source: OECD Global Insurance Statistics.
Claims development
Claims development in the life segment was relatively more subdued in 2012 in comparison with 2011. Among reporting countries, aside from Luxembourg, countries in Latin America saw the largest increases. Colombia, Costa Rica, Uruguay and Nicaragua all experienced large increases in claims paid (in the 20-32 per cent range). In Colombia, the largest increase in claims was found in professional risk coverage. The growth in claims payments in Mexico was less strong; it was due to increased claims in traditional life insurance and annuities,
In Greece, despite the increase in life surrenders, there is no evidence of a run on insurers. In Slovenia, the increased claims can be linked to an increase in claims of capital redemption policies and outflows from unit-linked products. In the Slovak Republic, there were slight increases in claims due to policy surrenders. There was also an increase in the number of insured who survived beyond the projected age. Portugal saw a large decline in claims payments, following a high level of growth in 2011.
Figure 3. Nominal growth in gross claims payments: Life sector (2011 – 2012) In per cent
Note: For methodological notes, see page 28 onwards. Source: OECD Global Insurance Statistics.
In the non-life sector, Chile experienced the greatest increase in claims paid. Other notable increases could be found in Sweden, and Turkey. There was strong growth in insurance claims in Latin American countries, for instance in Brazil, Colombia, Costa Rica, Cuba, El Salvador, Peru, Nicaragua and Uruguay. In Nicaragua, there was significant growth in claims for motor insurance as well as for fire and related insurance; moreover, claims for “other commercial insurance” registered increases. Peru experienced growth in claims payments in fire insurance, motor insurance, civil liability insurance and accident and sickness insurance lines. In Colombia, the largest increase in claims was registered in motor insurance.
In Asia, Indonesia, Hong Kong (China) and Singapore experienced sizable growth in the number of gross claims paid in the non-life insurance sector.
The reporting countries which experienced the greatest decline in gross claim payments were Australia, Ireland and Luxembourg. In Australia, the lower severity of disaster events in 2012 led to a reversal of growth in claims, which was unusually high in 2011.
In Switzerland there was a strong increase in fire and property insurance claims which corresponded with continued robust construction activities, a stable economic environment and population growth. In the motor vehicle (liability) sector there was a significant drop in the claims ratio and a fall in the number of road traffic accidents due to road safety measures and safety features in vehicles coupled with a more restrictive legislative environment, tightening the law in relation to whiplash injuries.
Figure 4. Nominal growth in gross claims payments: Non-Life sector (2011- 2012) In per cent
Note: For methodological notes, see page 28 onwards. Source: OECD Global Insurance Statistics.
Combined ratio for non-life sector
The combined ratio1 measures operational underwriting performance in the non-life sector and allows the sources of profitability to be highlighted. An improvement in the combined ratio can be due
1 The combined ratio in this report is defined as a sum of gross claims paid, change in outstanding claims
provision, gross operating expenses and gross commissions divided by gross written premiums (for direct business only).
to higher premiums, better cost control and/or more rigorous management of risks covered in insurance classes. A combined ratio of more than 100% represents an underwriting loss for the non-life insurer. A company with a combined ratio over 100% may nevertheless remain profitable due to investment earnings.
Figure 5. Combined ratio for non-life segment (2011 – 2012) In per cent
Note: For methodological notes, see page 28 onwards. Source: OECD Global Insurance Statistics.
The combined ratios largely remained unchanged or improved across reporting countries. In some countries, there was a very marked improvement, such as in Australia. In Australia, the reduction in severity of disasters in 2012 in comparison with the major events experienced at year end 2010 and early 2011 led to a decrease in claims which, in combination with premium increases, led to a lower combined ratio.
In other countries, such as Sweden, the ratio increased sharply. The combined ratios are very elevated in some reporting countries including Singapore and Paraguay.
Investment allocation and performance Portfolio investment
In most countries, insurers continued to invest heavily in fixed-income securities, namely government and private sector bonds. Insurer investment in fixed-income securities allows for a better
matching of assets with liabilities, particularly for life insurers with long-term business, and enhances liquidity.
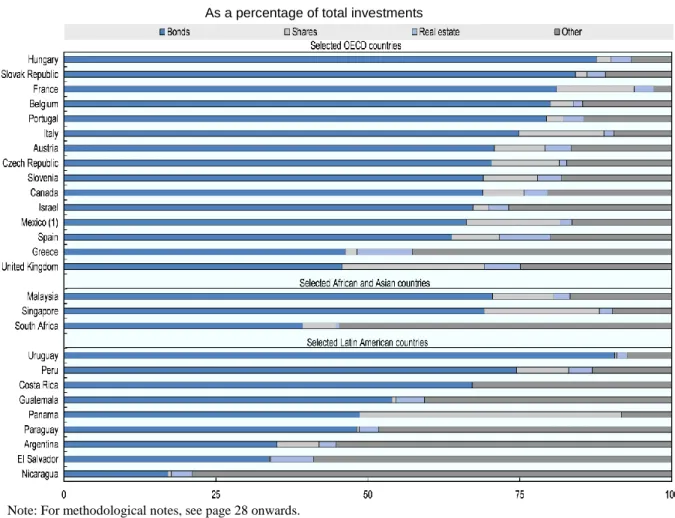
For most reporting countries, the life insurance industry allocates more than half of its own account portfolio investments into bonds. Some countries which did not have strong investment in bonds within their life insurance portfolios were Indonesia, Panama, South Africa and El Salvador.
With the exception of Denmark, El Salvador, Estonia, Finland, Germany, Indonesia, the Netherlands, Panama, and South Africa, the life insurance sectors in reporting countries allocated more than 50 per cent of their investment portfolio to bonds. The life insurance sector in Costa Rica, Hungary, Italy, and Turkey invested more than 90 per cent of own account assets in bonds.
In a majority of reporting countries, the life insurance sector invested less than 10 per cent of own account portfolio assets into equities. In some countries, however, equities comprised a sizeable component of portfolio investments (greater than or close to 20 per cent), such as in Australia, Denmark, Indonesia, Panama, Singapore, Slovenia, South Africa, and Sweden.
Investment in real estate is relatively limited in comparison with other asset classes. In Australia, Chile, Norway and Switzerland, the life insurance industry has significant investments in real estate (around 10 – 14 per cent).
Figure 6. Investment portfolio allocation: Life insurers (2012) As a percentage of total investments
Note: For methodological notes, see page 28 onwards. Source: OECD Global Insurance Statistics.
Similarly, the non-life insurance sector generally invested heavily in bonds. The Slovak Republic, Hungary, and Costa Rica were countries where the non-life sector had the greatest proportion of investments in bonds. In Costa Rica, the high allocation to debt securities reflected in large part the portfolio holdings of the state insurer which still dominates the market; there is more diversity in investments among commercial insurers.
Equities comprised, in aggregate, an important portion of investments in the non-life industry in several countries, most notably in Austria (over 40 percent), Finland, France, Indonesia, and Sweden (roughly between 25 and 30 per cent) but also in Denmark, Norway, South Africa and the United States (all over 20 per cent).
Figure 7. Investment portfolio allocation: Non-Life insurers (2012) As a percentage of total investments
Note: For methodological notes, see page 28 onwards. Source: OECD Global Insurance Statistics.
Portfolio allocation: Composite insurers
Composite insurers also invest substantially in bonds. Like the non-life sector, the composite insurance sector in Hungary and the Slovak Republic had the highest portfolio allocation to bonds. Similar to the life and non-life sectors, the composite sector in reporting countries does not allocate a significant portion of investments in equities; indeed, only in Panama and the United Kingdom did composite insurance investments in equities exceed, at an aggregate level, 20 per cent of portfolio holdings.
Figure 8. Investment portfolio allocation: Composite insurers (2012) As a percentage of total investments
Note: For methodological notes, see page 28 onwards. Source: OECD Global Insurance Statistics.
In many countries, public sector bonds comprise a large portion of the insurance sector’s bond holdings (life, non-life and composite insurance sector combined). In countries such as Hungary, Turkey, and Uruguay, where bond holdings represent a high proportion of portfolio investments, the allocation to government bonds is high in comparison with other reporting countries. In countries such as Chile, Panama, Norway, Paraguay, holdings of private sector debt far outweigh holdings of government debt.
Figure 9. Portfolio allocation to bonds, public and private sector (2012) As a percentage of total industry investment portfolio
Note: For methodological notes, see page 28 onwards. Source: OECD Global Insurance Statistics.
Regarding changes in asset allocations in 2012, there was a notable shift toward bonds (in excess of 5 per cent) in the life insurance industry in Chile, Czech Republic, and the Slovak Republic, and in the non-life insurance industry in Costa Rica, Finland, Ireland, Norway and the Slovak Republic.
By contrast, there was notable movement away from bonds in the life insurance industry in Costa Rica, Estonia, Iceland and Luxembourg and the non-life insurance industry in Chile and Poland, and in the United States. In Greece and the United States, there was a marked shift away from investment in bonds across all sectors of the insurance industry.
There was a substantive increase in allocation to equities in the life insurance sector in Iceland but a fall in allocation to equities in the life sector in the Slovak Republic and the life and composite sectors in the United Kingdom.
Table 1. Insurers’ portfolio allocation in bonds and shares by type of insurer (2011-2012) As a percentage of total investments
2011 2012 2011 2012 2011 2012 Australia (1) Bonds 64.8 67.1 62.1 66.6 x x Shares 17.4 19.4 c c x x Other 17.7 13.5 c c x x Austria Bonds 78.0 75.3 32.6 29.2 69.8 70.8 Shares 8.6 10.5 40.4 43.7 8.2 8.3 Other 13.4 14.2 27.0 27.2 22.0 20.9 Belgium Bonds 67.8 69.0 71.2 71.0 80.7 80.1 Shares 12.2 11.3 8.8 9.1 4.0 3.7 Other 20.1 19.7 20.0 19.9 15.3 16.2 Canada Bonds 60.1 .. 81.0 80.5 68.1 68.9 Shares 18.2 .. 16.0 16.2 6.3 6.7 Other 21.7 .. 3.1 3.3 25.6 24.3 Chile Bonds 55.1 65.3 53.5 47.2 x x Shares 2.8 2.7 1.0 0.4 x x Other 42.2 31.9 45.5 52.3 x x
Czech Republic Bonds 63.0 77.9 54.7 53.1 70.7 70.3
Shares 1.2 1.1 3.4 4.6 6.6 11.2 Other 35.7 21.0 41.9 42.3 22.7 18.5 Denmark Bonds 42.7 40.6 75.9 73.8 x x Shares 45.7 48.3 18.8 21.4 x x Other 11.7 11.1 5.3 4.9 x x Estonia Bonds 53.9 48.6 62.1 56.8 x x Shares 1.2 2.4 3.5 4.2 x x Other 44.9 49.0 34.5 39.1 x x Finland Bonds 31.9 30.1 46.8 57.4 .. .. Shares 26.1 19.6 43.9 31.3 .. .. Other 42.0 50.3 9.3 11.3 .. .. France Bonds 81.3 84.4 60.4 61.2 .. 81.0 Shares 12.7 11.6 27.1 25.6 .. 12.8 Other 6.0 4.0 12.5 13.2 .. 6.2 Germany (2) Bonds 36.7 38.8 37.0 37.5 x x Shares 3.3 3.7 6.9 10.3 x x Other 59.9 57.5 56.2 52.2 x x Greece Bonds 81.3 75.6 48.6 38.9 68.9 46.3 Shares 2.2 0.9 2.0 1.0 1.2 1.9 Other 16.5 23.5 49.5 60.1 29.9 51.8 Hungary Bonds 94.6 91.6 89.6 89.3 89.0 87.6 Shares 0.3 0.8 0.6 0.6 4.7 2.4 Other 5.1 7.5 9.9 10.0 6.3 10.0 Iceland Bonds 86.6 73.6 76.7 78.9 x x Shares 12.9 18.7 17.3 17.9 x x Other 0.5 7.8 6.0 3.2 x x Ireland Bonds 69.3 71.9 63.9 68.9 x x Shares 3.8 5.3 3.1 5.3 x x Other 26.9 22.9 33.0 25.8 x x Israel Bonds .. .. 66.6 68.2 67.8 67.3 Shares .. .. 0.6 0.8 2.4 2.5 Other .. .. 32.8 31.0 29.8 30.1 Italy Bonds 89.9 90.0 78.6 78.4 72.8 74.8 Shares 4.2 4.0 6.8 6.7 16.0 14.0 Other 5.9 6.0 14.6 14.9 11.2 11.2 Japan (3) Bonds 67.4 68.0 51.2 .. x x Shares 6.3 6.6 32.0 .. x x Other 26.3 25.3 16.8 .. x x Korea Bonds 52.1 53.9 38.5 41.7 x x Shares 5.7 5.8 5.7 5.3 x x Other 42.2 40.3 55.8 52.9 x x Luxembourg Bonds 62.3 55.7 49.9 49.2 x x Shares 1.1 1.6 3.6 3.5 x x Other 36.7 42.7 46.5 47.3 x x Mexico (4) Bonds 85.8 86.3 81.7 80.6 70.3 66.2 Shares 0.0 0.0 4.9 7.3 14.3 15.5 Other 14.2 13.7 13.4 12.1 15.5 18.3 Netherlands Bonds 40.1 40.2 43.5 40.9 x x Shares 9.4 21.2 5.3 5.5 x x Other 50.5 38.6 51.2 53.6 x x Norway Bonds 64.5 65.6 47.3 72.3 x x Shares 12.0 11.8 30.5 21.9 x x Other 23.5 22.6 22.1 5.8 x x Poland Bonds 63.2 62.5 62.3 50.8 x x Shares 5.9 3.9 20.0 19.2 x x Other 30.9 33.6 17.6 30.0 x x Portugal Bonds 80.7 80.8 59.6 58.5 81.7 79.4 Shares 1.5 1.8 1.6 2.7 1.9 2.8 Other 17.7 17.4 38.8 38.9 16.4 17.8
Slovak Republic Bonds 81.2 86.9 90.1 97.0 85.3 84.2
Shares 9.4 2.4 0.0 0.0 1.9 1.9
Other 9.4 10.6 9.9 3.0 12.7 14.0
life non-life composite Selected OECD countries
Table 1. Insurers’ portfolio allocation in bonds and shares by type of insurer (2011-2012) -- continued As a percentage of total investments
Note: For methodological notes, see page 28 onwards. Source: OECD Global Insurance Statistics.
2011 2012 2011 2012 2011 2012 Slovenia Bonds 52.8 56.0 57.5 53.8 65.1 69.0 Shares 25.7 27.1 6.5 7.7 7.3 8.9 Other 21.6 16.9 36.0 38.5 27.5 22.1 Spain Bonds 74.1 73.9 50.1 51.4 63.6 63.8 Shares 4.9 2.7 12.3 10.4 5.9 7.8 Other 21.0 23.4 37.6 38.3 30.4 28.4 Sweden Bonds 59.1 56.4 62.1 59.2 x x Shares 32.2 33.2 27.1 28.7 x x Other 8.7 10.4 10.7 12.2 x x Switzerland Bonds 60.9 60.7 39.0 38.6 x x Shares 0.8 1.1 3.4 3.8 x x Other 38.2 38.2 57.5 57.7 x x Turkey Bonds 92.9 92.2 79.5 79.2 x x Shares 2.0 2.5 3.1 4.5 x x Other 5.1 5.4 17.4 16.3 x x
United Kingdom Bonds 58.9 61.9 34.8 37.5 42.2 45.8
Shares 12.9 12.6 10.5 13.5 25.2 23.4
Other 28.2 25.6 54.7 48.9 32.6 30.9
United States Bonds 74.7 74.2 66.4 64.9 x x
Shares 3.8 3.6 21.1 22.0 x x Other 21.5 22.1 12.5 13.1 x x India Bonds 80.7 .. 78.8 .. x x Shares 10.6 .. 19.4 .. x x Other 8.7 .. 1.8 .. x x Indonesia Bonds .. 27.0 .. 15.3 .. .. Shares .. 24.0 .. 26.7 .. .. Other .. 49.0 .. 58.1 .. .. Malaysia Bonds 55.1 57.2 60.5 53.8 70.9 70.5 Shares 18.3 15.8 6.7 5.5 9.3 10.1 Other 26.6 27.0 32.8 40.7 19.7 19.5
Russian Federation Bonds 40.9 .. 11.4 .. 46.7 ..
Shares 7.2 .. 13.7 .. 8.1 ..
Other 52.0 .. 74.9 .. 45.2 ..
Singapore Bonds 57.8 59.6 36.8 25.0 64.6 69.1
Shares 22.8 23.3 9.7 22.8 19.6 19.0
Other 19.4 17.1 53.6 52.2 15.9 11.9
South Africa Bonds 18.7 22.9 10.5 12.2 48.5 39.3
Shares 49.8 50.3 22.2 24.5 5.1 5.6 Other 31.5 26.8 67.2 63.3 46.4 55.2 Thailand Bonds 70.6 .. 31.2 .. x x Shares 3.9 .. 25.1 .. x x Other 25.5 .. 43.7 .. x x Argentina Bonds .. 65.1 .. 36.0 .. 35.0 Shares .. 1.0 .. 1.1 .. 6.9 Other .. 34.0 .. 63.0 .. 58.0 Bolivia Bonds .. 50.4 .. 20.9 .. .. Shares .. 1.8 .. 4.1 .. .. Other .. 47.8 .. 74.9 .. .. Colombia Bonds .. 83.9 .. 79.0 x x Shares .. 15.6 .. 17.1 x x Other .. 0.6 .. 3.9 x x
Costa Rica Bonds 100.0 93.2 84.2 97.4 67.1 67.2
Shares 0.0 0.0 0.0 0.0 0.0 0.0 Other 0.0 6.8 15.8 2.6 32.9 32.8 El Salvador Bonds 29.3 27.7 21.3 13.7 32.8 33.8 Shares 0.0 0.0 0.1 0.0 0.2 0.2 Other 70.7 72.3 78.5 86.2 67.0 66.0 Guatemala Bonds .. .. .. 38.3 .. 54.0 Shares .. .. .. 0.8 .. 0.6 Other .. .. .. 60.9 .. 45.4 Nicaragua Bonds .. .. .. .. .. 17.1 Shares .. .. .. .. .. 0.6 Other .. .. .. .. .. 82.3 Panama Bonds .. 21.2 .. .. .. 48.6 Shares .. 76.1 .. .. .. 43.1 Other .. 2.6 .. .. .. 8.3 Paraguay Bonds .. .. .. 44.5 .. 48.2 Shares .. .. .. 1.5 .. 0.4 Other .. .. .. 54.0 .. 51.4 Peru Bonds 79.8 79.8 27.0 26.6 76.5 74.4 Shares 4.4 5.1 11.6 10.3 6.8 8.6 Other 15.8 15.0 61.5 63.1 16.7 17.0
Puerto Rico Bonds .. 82.7 .. 71.8 .. ..
Shares .. 4.6 .. 10.1 .. ..
Other .. 12.7 .. 18.2 .. ..
Uruguay Bonds .. 72.5 .. 73.2 .. 90.6
Shares .. 0.0 .. 0.0 .. 0.3
Other .. 27.5 .. 26.8 .. 9.1
Selected Latin American countries
life non-life composite
Investment results
The insurance industry generally experienced improvement in real terms of net investment returns in 2012 in comparison with 2011. A number of countries highlighted the positive performance of financial markets in 2012 as a reason for improved performance. This gave some respite to the insurance industry, which has been buffeted in recent years by market volatility.
For instance, in Switzerland, in the life sector the return on investments can be attributed to higher unrealised gains from fixed interest investments as well as lower unrealised losses in all asset classes, most significantly from lower unrealised losses from fixed interest investments.
Table 2. Average real net investment return by type of insurer (2011-2012) In per cent
Note: For methodological notes, see page 28 onwards. Source: OECD Global Insurance Statistics.
2011 2012 2011 2012 2011 2012 Australia -2.6 12.2 4.7 5.4 x x Austria .. .. 1.2 1.3 0.2 1.2 Belgium -6.5 2.3 -2.9 0.7 -1.2 2.2 Canada 1.4 .. 2.2 3.6 8.9 5.9 Chile 3.3 5.4 2.3 3.4 x x Czech Republic 0.2 -0.6 0.5 3.2 -0.1 1.0 Estonia -2.6 1.2 -1.5 .. x x Germany 1.5 3.0 2.0 1.7 x x Hungary 5.9 1.7 0.7 1.6 1.7 1.5 Iceland 3.5 -4.0 1.9 -3.9 x x Ireland .. 6.6 .. 3.8 x x Israel .. .. -0.1 7.0 2.1 5.0 Italy -2.1 3.2 -2.6 2.9 -1.5 2.1 Japan 2.1 2.5 2.3 .. x x Korea 0.7 2.8 -0.2 2.3 x x Luxembourg 0.0 -2.2 -1.6 -2.2 x x Norway .. 4.4 .. 4.4 x x Poland 0.5 4.0 3.4 4.7 x x Portugal -1.6 1.0 -1.3 0.6 0.4 4.0 Spain 1.5 2.2 1.7 -0.2 1.5 -0.2 Switzerland 4.1 4.0 4.9 4.0 x x Turkey -4.5 0.2 -6.9 -5.6 x x India 4.8 .. 4.7 .. x x Indonesia .. 7.8 .. 3.1 .. .. Malaysia 4.5 8.1 0.8 2.8 4.4 6.5 Russian Federation -5.3 .. -4.2 .. -5.2 .. Singapore -3.6 4.0 -3.8 -0.1 -4.6 3.4 South Africa -3.0 .. -3.0 .. -2.1 .. Thailand 0.5 .. -0.7 .. .. .. Argentina .. 8.2 .. 5.3 .. 8.9 Colombia .. 10.7 .. 5.9 x x Costa Rica 3.3 4.3 1.7 3.8 4.1 4.7 El Salvador -1.5 3.1 -1.3 2.9 1.7 6.3 Nicaragua .. .. .. .. .. -0.7 Peru 1.8 3.9 7.9 7.4 5.8 6.8 Uruguay .. 0.5 .. 0.6 .. 2.2
Selected African and Asian countries
Selected Latin American countries
Life Non-life Composite
Profitability Return on equity
The insurance industry’s return on equity (ROE)2 in reporting countries has shown some volatility in recent years due to changing financial market and economic conditions. There appears to have been an improvement in profitability in 2012, although not all countries exhibited this trend. Some of the improved performance can be linked to enhanced investment returns as described earlier.
There has been great variability in profitability within the European insurance sector, such as in Greece, Italy, Finland, Portugal, and the Slovak Republic. This reflects the economic and financial instability in Europe over the last few years due to the worsened economic conditions and fiscal positions. There was a strong reversal and return to profitability, for instance, in the life sector in Italy. In Australia, there has been stability in the returns of life insurance sector, with the ROE being stable since 2010. In the non-life insurance sector, the key drivers of profitability was higher premium revenue, reflecting as mentioned increased market pricing to recoup increased reinsurance costs, and lower claims expenses due to the lower severity of disaster events in 2012.
In Belgium, the positive development in profitability in the insurance sector comparison with the low profitability experienced in 2011 was mainly attributable to a significant increase in income from financial investments in the technical and non-technical accounts.
In Chile, the life sector experienced strong profitability due to financial investments and, to a lesser degree, higher sales and fewer administrative expenses. By contrast, in the non-life sector higher administrative and claims costs were not compensated for by an improvement in investment results. In Estonia, the profitability of the life insurance sector improved owing to good financial investment results.
With some exceptions, profitability was generally very strong in reporting non-OECD countries. For instance, ROE in South Africa was very strong. By contrast, in Costa Rica, there was a general trend towards minimal or no profitability for the majority of new insurers, likely reflecting the recent development of the private insurance sector; in 2012, the ROE was only positive for selected insurers including the state insurer, which formerly had a monopoly.
2 The return on equity (ROE) is calculated, in this report, as the current year’s net income divided by the average
of the current and the previous year’s shareholder equity as reported on the balance sheet calculated at an industry level.
Table 3. Return on Equity by type of insurer (2010-2012) In per cent
Note: For methodological notes, see page 28 onwards. Source: OECD Global Insurance Statistics.
Change in equity position
The change in equity position facilitates an understanding of the evolution of shareholder capital. Changes may occur due to gains and losses recognised in the income statement, dividend distributions, share buybacks and issuance of share capital. They may also reflect unrecognised gains or losses that do not appear in the income statement but which may nonetheless be important for understanding the financial position.
The table below shows that shareholder equity within the life insurance industry generally increased, although declines were witnessed in some countries, for instance in Canada, Hungary, the Slovak Republic, and South Africa. The evolution of shareholder equity in the non-life sector was more mixed. 2010 2011 2012 2010 2011 2012 2010 2011 2012 Australia 15.9 15.4 15.9 15.3 9.6 17.7 x x x Belgium 7.9 3.4 10.6 8.5 5.7 6.2 12.0 2.5 20.6 Canada 20.4 3.4 -5.2 6.6 9.8 11.3 6.7 7.1 9.9 Chile 20.5 5.3 15.0 3.3 12.2 9.4 x x x Czech Republic .. 14.0 9.9 .. -8.4 -2.7 .. 16.6 20.6 Denmark 20.0 3.0 9.6 19.3 6.7 15.0 x x x Estonia 28.7 9.8 17.0 14.6 13.8 16.7 x x x Finland 21.2 -2.7 21.8 17.6 10.2 24.7 .. .. .. France 6.4 2.5 5.5 7.0 7.1 3.6 8.0 5.5 8.6 Germany 9.8 9.7 9.6 3.8 3.8 3.9 x x x Greece 7.0 -6.0 -14.5 12.5 10.1 18.8 -16.2 -36.5 -62.5 Hungary -13.6 -0.8 -8.1 -5.7 -32.9 -6.3 5.4 11.3 12.0 Iceland 25.3 21.4 18.2 9.7 12.3 20.4 x x x Ireland -6.1 -8.2 10.5 8.7 10.0 14.6 x x x Israel .. .. .. 37.0 3.9 17.9 19.4 -0.6 15.2 Italy -2.4 -16.5 25.1 -7.7 -0.6 6.2 -0.6 -6.5 9.4 Korea 10.4 8.5 7.6 13.0 15.3 11.8 x x x Luxembourg 6.4 3.7 7.3 14.2 22.7 23.2 x x x Mexico 17.7 12.7 19.5 3.7 11.8 21.0 16.7 16.3 18.5 New Zealand 20.3 .. .. 15.3 .. .. .. .. .. Norway 15.2 .. 10.9 .. .. 36.1 x x x Poland 27.2 22.5 21.6 18.8 18.0 16.8 x x x Portugal 16.2 -7.8 17.6 2.0 3.0 -0.1 10.3 4.5 17.7 Slovak Republic 7.7 6.1 -3.8 -31.5 -43.5 19.3 10.8 15.6 11.4 Spain .. .. 24.6 .. .. 11.2 15.9 11.2 11.6 Switzerland 13.1 20.7 8.0 20.2 16.2 16.9 x x x Turkey 15.7 13.2 13.3 -4.1 0.3 -12.9 2.8 .. .. United Kingdom 7.6 7.1 3.5 .. .. 5.4 13.5 11.3 12.0 United States 8.8 5.3 12.0 7.1 5.0 6.9 x x x Indonesia .. .. 8.2 .. .. 6.8 .. .. .. Malaysia 53.7 23.4 20.3 10.8 13.4 12.7 23.9 28.4 22.6 Singapore 16.6 20.6 22.5 8.0 -62.8 15.5 22.8 15.5 35.9 South Africa .. 91.0 49.3 43.4 35.0 170.2 13.2 31.7 8.6 Thailand .. 14.7 .. .. -123.4 .. x x x Costa Rica .. .. 3.3 .. .. -0.1 .. .. 8.9 El Salvador .. .. 29.9 .. .. 4.3 .. .. 20.3 Peru .. .. 15.5 .. .. 9.8 .. .. 20.9
Selected Latin American countries Selected African and Asian countries
ROE
Life Non-life Composite
Table 4. Change in equity position by type of insurer (2011-2012) In per cent
Note: For methodological notes, see page 28 onwards. Source: OECD Global Insurance Statistics.
2011 2012 2011 2012 2011 2012 Australia 6.0 8.9 -1.6 1.9 x x Belgium -6.0 8.6 9.2 5.7 -8.8 0.9 Canada -0.1 -19.0 7.6 3.9 -1.1 8.8 Chile -2.4 9.0 16.0 33.7 x x Czech Republic -3.6 0.3 2.2 4.6 -13.5 15.4 Denmark 0.9 7.7 2.0 7.0 x x Estonia 7.1 18.6 13.3 -0.2 x x Finland -8.4 25.2 3.6 15.5 .. .. France 7.8 8.0 5.3 -4.5 1.5 2.8 Germany -3.4 10.8 -1.2 5.6 x x Greece 7.6 12.1 9.4 -13.9 -16.3 83.0 Hungary -9.0 -8.7 5.3 -10.6 0.6 -5.8 Iceland 5.2 2.1 12.8 35.9 x x Ireland -4.2 15.8 10.8 -18.8 x x Israel .. .. -0.4 -0.5 -2.8 19.9 Italy -13.8 28.3 -10.1 8.6 -1.8 10.5 Korea 8.8 27.2 27.4 18.7 x x Luxembourg -13.5 44.6 14.7 10.5 x x Mexico 6.7 16.3 11.0 2.7 17.4 7.7 Norway 14.7 100.2 37.3 224.9 x x Poland -3.4 15.7 4.1 17.7 x x Portugal -27.8 88.6 0.2 1.5 -11.5 52.4 Slovak Republic 0.7 -7.5 -12.0 105.0 -2.1 10.1 Slovenia 382.0 0.0 -0.1 -6.7 36.4 57.3 Spain .. 32.8 .. 6.7 -43.4 0.8 Switzerland 30.4 7.8 -1.3 -6.1 x x Turkey 41.7 14.5 11.8 -1.8 x x United Kingdom 2.7 0.7 .. 0.9 -7.5 12.6 United States 0.5 4.2 3.4 6.3 x x Malaysia 18.9 10.2 8.4 28.0 26.3 6.4 Singapore 55.0 108.9 -58.8 268.1 -85.6 431.1 South Africa 11.1 -20.5 4.4 43.8 113.7 -35.9 Thailand 58.0 .. 45.4 .. x x Costa Rica .. 13.0 .. 7.2 .. 9.7 El Salvador .. 7.5 .. -1.0 .. 11.7 Peru .. 9.1 .. 10.9 .. 16.5
Selected Latin American countries
life non life composite
Selected OECD countries
ADDITIONAL NOTES AND REFERENCE SERIES
Notes to be taken into consideration when interpreting the data
This report is based on the first phase of responses provided by countries on results from the 2013 Global Insurance Statistics (GIS) exercise, including qualitative information supplied by countries or sourced from national administrative sources. The second phase of country responses, to be submitted toward the end of 2013, provides more detailed information on the sector and will be published in the
OECD Insurance Statistics collection. Data collected under the GIS exercise can be found at the following OECD statistical portal: http://stats.oecd.org/Index.aspx.
Given possible divergences in national reporting standards, different methods for compiling data for the GIS exercise, and recent amendments to the OECD statistical framework, caution needs to be exercised in interpreting the data. For this reason, countries are regularly requested to provide methodological information relevant for developing a thorough understanding of their submissions to the Global Insurance Statistics (GIS) exercise. The methodological notes below provide some explanations in this respect.
Economic data on exchanges rates and the Consumer Price Index (CPI) in countries come from the OECD’s Main Economic Indicators (MEI) database.
As per the OECD GIS framework, data normally refers to direct business and include domestically incorporated undertakings (i.e., incorporated under national law) and, where data is available, the branches and agencies of foreign undertakings operating in the country. Some countries, particularly within the EU member states, in submitting “Part 1” data, may not be able to exclude the foreign branches of domestic undertakings. Therefore, data for those countries may include these foreign branches (particularly branches established within the EU).
Composite undertakings operate in a number of countries, as shown in Table 7.
Conventional signs: "c" means confidential; "x" not applicable; ".." not available.
The statistical data for Israel are supplied by and under the responsibility of the relevant Israeli authorities. The use of such data by the OECD is without prejudice to the status of the Golan Heights, East Jerusalem and Israeli settlements in the West Bank under the terms of international law.
Australia changed the reporting framework from a written premium concept to an earned premium concept as of July 2010. Given the change in the reporting basis, gross and net earned premiums are used in the report instead of written premiums.
Data on composite insurers from Italy and Portugal include life insurers operating also in accident and sickness line of business.
Data from Malaysia cover global business (within and outside Malaysia) including Takaful insurance.
Specific notes Figure 1:
Premiums refer to gross written premiums for direct insurance only, excluding reinsurance business accepted. Given OECD classification standards, life data does not include accident and health insurance. Real growth rates are calculated using the Consumer Prices Index (CPI) from the OECD’s Main Economic Indicators (MEI) and other sources.
All OECD reporting countries have been included in the calculations of the simple and weighted averages.
1. Data refer to domestic undertakings only and do not take into account branches and agencies of foreign undertakings.
2. Data refer to undertakings subject to domestic undertakings and branches of insurance undertakings with head office outside EU or EEA countries.
3. Data include reinsurance business accepted.
4. The growth rate is not expressed in real terms but in nominal terms.
5. The split of premiums between the life and non-life segment for composite undertakings in 2011 is assumed to be the same as the one in 2012.
Figure 2:
Premiums refer to gross written premiums for direct insurance only, excluding reinsurance business accepted. Given OECD classification standards, non-life data includes accident and health insurance. Real growth rates are calculated using the CPI from the OECD’s MEI and other sources.
All OECD reporting countries have been included in the calculations of the simple and weighted averages.
1. Data refer to undertakings subject to domestic undertakings and branches of insurance undertakings with head office outside EU or EEA countries.
2. Data refer to domestic undertakings only and do not take into account branches and agencies of foreign undertakings.
3. Data include reinsurance business accepted.
4. The growth rate is not expressed in real terms but in nominal terms.
5. The split of premiums between the life and non-life segment for composite undertakings in 2011 is assumed to be the same as the one in 2012.
Figure 3:
The claims payments indicator includes variations in outstanding claims provisions to reflect better the magnitude of the obligations that the industry had in 2012 as a result of insured events that occurred. 1. Outstanding claims provision changes are not taken into account in this chart.
2. Claim payments of the composite undertakings are not included, as the breakdown by type of sub-sector (life, non-life) is not available.
3. Data refer to undertakings subject to domestic undertakings and branches of insurance undertakings with head office outside EU or EEA countries.
4. The split between each segment (life and non-life) of the composite undertakings of changes in outstanding provisions in 2012 is assumed to be the same as the split of gross claims paid in 2012. The split between each segment (life and non-life) of the composite undertakings of gross claims paid and changes in outstanding provisions in 2011 is assumed to be the same as in 2012.
Figure 4:
The claims payments indicator includes variations in outstanding claims provisions to reflect better the magnitude of the obligations that the industry had in 2012 as a result of insured events that occurred. 1. Claim payments of the composite undertakings are not included, as the breakdown by type of sub-sector (life, non-life) is not available.
2. Outstanding claims provision changes are not taken into account in this chart.
3. Data refer to undertakings subject to domestic undertakings and branches of insurance undertakings with head office outside EU or EEA countries.
4. Data include reinsurance.
5. The split between each segment (life and non-life) of the composite undertakings of changes in outstanding provisions in 2012 is assumed to be the same as the split of gross claims paid in 2012. The split between each segment (life and non-life) of the composite undertakings of gross claims paid and changes in outstanding provisions in 2011 is assumed to be the same as in 2012.
Figure 5:
The combined ratio is calculated in this report as the sum of gross claims payments, changes in outstanding claims provision, gross operating expenses, and gross commissions divided by gross written premiums. I.e., Combined ratio = “Loss ratio” + “Expense ratio”, where:
Loss ratio: (Gross claims paid + changes in outstanding claims provision) / gross written premiums (the latter used as a proxy for gross earned premiums); and,
Expense ratio = (Gross operating expenses + commissions) / Gross written premiums.
The combined ratio is used in analysing the underwriting performance of insurance companies, especially for non-life insurance where the risk exposure is short-term -- generally one year. The use of the combined ratio for long-term business such as life insurance is of limited use only.
Due to limitations in data, it is not possible to calculate the combined ratio using earned premiums and claims incurred data, which would provide a more accurate depiction of underwriting performance. The displayed combined ratio is an aggregate covering different types of business and hence different types of risks. For instance, in the United States, data for the non-life sector are the combination of figures from three types of business: title, property/casualty and health.
1. Values for the non-life branch of composite undertakings are not available and not taken into account in the calculation of the combined ratio.
2. Commissions have not been included in the calculation since they are already included in gross operating expenses.
3. Commissions are not included in the calculation of the combined ratio.
4. Earned premiums were used instead of gross written premiums to calculate the combined ratios. In the numerator of the ratios, reinsurance business is included.
6. As the breakdown of gross operating expenses between the life and non-life segment for composite undertakings was not available, the breakdown was assumed to be the same as the share of life and non-life gross premiums in the total premiums collected by composite undertakings.
Figure 6:
Data refer to direct business and domestically incorporated undertakings only. Data exclude assets linked to unit-linked products where risk is fully borne by policyholders.
1. Data about other investments are excluded because of their negative value.
2. The “Other” category mainly comprises loans and mutual fund investments for which no look-through was available.
Figure 7:
Data refer to direct business and domestically incorporated undertakings only.
1. The “Other” category mainly comprises loans and mutual fund investments for which no look-through was available.
Figure 8:
Data refer to direct business and domestically incorporated undertakings only. Data exclude assets linked to unit-linked products where risk is fully borne by policyholders.
Figure 9:
Data refer to direct business and domestically incorporated undertakings only. Data exclude assets linked to unit-linked products where risk is fully borne by policyholders.
Table 1:
Data refer to direct business and domestically incorporated undertakings only. Data exclude assets linked to unit-linked products where risk is fully borne by policyholders.
1. Data about other investments of life insurance companies in 2012 are excluded because of their negative value.
2. The “Other” category mainly comprises loans and mutual fund investments for which no look-through was available.
3. Data for the non-life insurance companies exclude the category “Other investments”, which represent investments other than in “Bonds”, “Shares”, “Mortgage loans”, “Loans other than mortgage loans” and “Real estate”.
4. The level of composite insurer investments in equity does not represent a direct exposure to the equity market since such investments include investment in the shares of mutual funds, which in the case of these insurers mainly invest in bonds.
Table 2:
Average real net investment return calculations are based on nominal net investment return reported by countries and CPI figures.
Table 3:
ROE was calculated by dividing segment net income for 2012 by average segment equity over 2011 and 2012.
Table 4:
Change in equity position is calculated as the change in shareholder equity divided by the level of shareholder equity from the previous year.
Table 5. Currency exchange rates and consumer price index (CPI) National units per USD and CPI (percentage change), 2012
1. The CPI percentage change is calculated as the variation of the end-of-period CPI. For all countries, it refers to annual CPI inflation for 2012.
Source: OECD MEI and other sources.
Currency exchange rates, national units per
USD CPI (1) Australia 0.966 2.2 Austria 0.778 2.8 Belgium 0.778 2.2 Canada 0.999 0.8 Chile 486.471 1.5 Czech Republic 19.538 2.4 Denmark 5.790 2.0 Estonia 0.778 3.4 Finland 0.778 2.4 France 0.778 1.3 Germany 0.778 2.0 Greece 0.778 0.8 Hungary 224.823 5.0 Iceland 125.118 4.2 Ireland 0.778 1.2 Israel 3.856 1.6 Italy 0.778 2.3 Japan 79.814 -0.1 Korea 1125.935 1.4 Luxembourg 0.778 2.3 Mexico 13.150 3.6 Netherlands 0.778 2.9 New Zealand 1.235 0.9 Norway 5.815 1.4 Poland 3.252 2.3 Portugal 0.778 1.9 Slovak Republic 0.778 3.2 Slovenia 0.778 2.7 Spain 0.778 2.9 Sweden 6.769 -0.1 Switzerland 0.938 -0.4 Turkey 1.792 6.2 United Kingdom 0.631 2.7 United States 1.000 1.7
Hong Kong (China) 7.756 3.8
India 53.437 11.2 Indonesia 9386.629 4.3 Malaysia 3.089 1.2 Russian Federation 30.840 6.5 Singapore 1.250 4.3 South Africa 8.210 5.7 Thailand 31.083 3.6 Argentina 4.537 10.8 Bolivia 6.910 5.3 Brazil 1.953 5.8 Colombia 1796.896 2.4 Costa Rica 502.901 4.5 Cuba .. .. El Salvador 8.750 0.8 Guatemala 7.834 3.4 Nicaragua 23.547 6.6 Panama 1.000 4.6 Paraguay 4424.918 4.0 Peru 2.638 2.6 Puerto Rico 1.000 .. Uruguay 20.311 7.5 OECD countries
Selected African and Asian countries
Table 6. List of administrative sources
Countries Statistical source Website
Australia Australian Prudential Regulation Authority (APRA) www.apra.gov.au
Austria Financial Market Authority (FMA) www.fma.gv.at
Belgium National Bank of Belgium (NBB) www.nbb.be
Canada Department of Finance Canada www.fin.gc.ca
Chile Superintendency of Securities and Insurance (SVS) www.svs.cl
Czech Republic Ministry of Finance www.mfcr.cz
Denmark Danish Financial Supervisory Authority (FTNET) www.finanstilsynet.dk
Estonia Ministry of Finance of Estonia www.fin.ee
Finland Ministry of Social Affairs and Health www.stm.fi
France French Prudential Supervisory Authority (ACP) www.acp.banque-france.fr
Germany Federal Financial Supervisory Authority (BaFin) www.bafin.de
Greece Bank of Greece www.bankofgreece.gr
Hungary Hungarian Financial Supervisory Authority (PSZAF) www.pszaf.hu
Iceland The Financial Supervisory Authority (FME) www.fme.is
Ireland Department of Finance www.finance.gov.ie
Israel Ministry of Finance www.mof.gov.il
Italy Institute for the Supervision of Insurance (ISVAP) www.isvap.it
Japan Financial Services Agency (FSA) www.fsa.go.jp
Korea Financial Services Commission (FSC) www.fsc.go.kr
Luxembourg The Insurance Commission (CAA) www.commassu.lu
Mexico The Insurance and Surety National Commission (CNSF) www.cnsf.gob.mx
Netherlands Statistics Netherlands (CBS) www.cbs.nl
New Zealand Statistics New Zealand www.stats.govt.nz
Norway Financial Supervisory Authority of Norway (Finanstilsynet) www.finanstilsynet.no
Poland Polish Financial Supervision Authority (KNF) www.knf.gov.pl
Portugal Insurance and Pension Funds Supervisory Authority (ISP) www.isp.pt
Slovak Republic National Bank of Slovakia (NBS) www.nbs.sk
Slovenia Ministry of Finance www.mgrt.gov.si
Spain Ministry of Economy www.meh.es
Sweden Statistics Sweden (SCB) www.scb.se
Switzerland State Secretariat for International Financial Matters (SIF) www.sif.admin.ch
Turkey The Undersecretariat of Turkish Treasury www.hazine.gov.tr
United Kingdom Bank of England www.bankofengland.co.uk
United States National Association of Insurance Commissioners (NAIC) www.naic.org
Hong Kong (China) Financial Services and the Treasury Bureau (FSTB) www.fstb.gov.hk
India Ministry of Finance www.finmin.nic.in
Indonesia Financial Services Authority (OJK) www.ojk.go.id
Malaysia Central Bank of Malaysia (BNM) www.bnm.gov.my
Russian Federation Federal Financial Markets Service (FFMS) www.ffms.ru
Singapore Monetary Authority of Singapore (MAS) www.mas.gov.sg
South Africa Financial Services Board (FSB) www.fsb.co.za
Thailand Office of Insurance Commission (OIC) www.oic.or.th
Argentina Superintendence of Insurance (SSN) www.ssn.gob.ar
Bolivia Supervision and Control Authority for Pensions and Insurance (APS) www.aps.gob.bo
Brazil Superintendence of Private Insurance (SUSEP) www.susep.gov.br
Colombia Financial Superintendence (SFC) www.superfinanciera.gov.co
Costa Rica General Insurance Superintendence (SUGESE) www.sugese.fi.cr
Cuba Cuba Insurance Superintendency www.mfp.cu
El Salvador Superintendency of the Financial System (SSF) www.ssf.gob.sv
Guatemala Superintendency of Banks (SIB) www.sib.gob.gt
Nicaragua Superintendency of Banks and Other Financial Institutions (SIBOIF) www.siboif.gob.ni
Panama Insurance and Reinsurance Superintendence of Panama (SSRP) www.superseguros.gob.pa
Paraguay Insurance Superintendence – Central Bank of Paraguay www.bcp.gov.py
Peru Superintendency of Banking, Insurance and Private Pension Funds Administrators (SBS) www.sbs.gob.pe
Puerto Rico Office of the Commissioner of Insurance (OCS) www.ocs.gobierno.pr
Uruguay Central Bank of Uruguay www.bcu.gub.uy
OECD countries
Selected African and Asian countries
Table 7. Composite undertakings
1. Most of life insurance companies are authorized to provide coverage for accident and sickness risks. The data for their life and non-life businesses (including accident and sickness) are provided separately under composite sector.
2. There are no composites, except that 2 life companies which have small operation in accident and sickness insurance which are classified as life company.
3. No official company is allowed to operate in both life and non-life business. However, a Portuguese composite subsidiary operates.
4. For profit and loss accounts (e.g. premiums) data is separated but for the balance sheet information and solvency (e.g. solvency ratio, capital, ROE) it is not separated.
5. The composite undertakings operating in Spain have to submit technical and non technical accounts for all non-life and life classes separately. The balance sheet data are presented together with no differentiation by classes .
Source: OECD Global Insurance Statistics.
Countries in which composite undertakings operate Availability of separate data on composite undertakings Australia No x
Austria Yes Yes
Belgium Yes Yes
Canada (1) Yes Yes
Chile No x
Czech Republic Yes Yes
Denmark No x
Estonia No x
Finland Yes No
France Yes Yes
Germany No x
Greece Yes Yes
Hungary Yes Yes
Iceland (2) No No
Ireland No x
Israel Yes Yes
Italy Yes Yes
Japan No x
Korea No x
Luxembourg (3) Yes Yes
Mexico Yes Yes
Netherlands No x
New Zealand Yes Yes
Norway No x
Poland No x
Portugal (4) Yes Yes
Slovak Republic Yes Yes
Slovenia Yes Yes
Spain (5) Yes Yes
Sweden No x
Switzerland No x
Turkey No x
United Kingdom Yes Yes
United States No x
Hong Kong (China) Yes No
India No x
Indonesia .. ..
Malaysia Yes Yes
Russian Federation Yes Yes
Singapore Yes Yes
South Africa Yes Yes
Thailand No x
Argentina Yes Yes
Bolivia .. ..
Brazil Yes Yes
Colombia No x
Costa Rica Yes Yes
Cuba .. ..
El Salvador Yes Yes
Guatemala Yes Yes
Nicaragua Yes Yes
Panama Yes Yes
Paraguay Yes Yes
Peru Yes Yes
Puerto Rico .. ..
Uruguay Yes Yes
OECD countries
Selected African and Asian countries
Acknowledgements
This report was made possible by the contributions of OECD and non-OECD countries. The OECD gratefully acknowledges their efforts in supplying the data and qualitative information that supported this publication and which was compiled within the framework of the Global Insurance Statistics (GIS) exercise.