The Cost of Debt Capital and Corporate
Governance Practices
∗Hae-Young Byun**
Seoul National University, Seoul, Korea
Received 05 March 2007; Accepted 17 September 2007
Abstract
This study examines the association between the cost of debt capital and corporate gov-ernance practices. Utilizing a unique data set of firm-level corporate govgov-ernance practices that is provided by the Korea Corporate Governance Service (KCGS), this study examines whether sound corporate governance practices reduce agency costs and thus the default risk and cost of debt capital of a firm. The findings indicate that corporate governance practices are negatively related to the cost of debt capital after controlling for relevant control variables and that the association between the cost of debt capital and corporate governance practices is more pronounced in firms that have assets of more than 2 trillion won (approximately US$2 billion). Thus, the results strongly suggest that sound corporate governance practices work favorably to lower the cost of external debt financing.
Keywords: Cost of debt capital; Corporate governance; Shareholder rights protection; Dividend policies; Audit committee
* I gratefully acknowledge the Korea Corporate Governance Service for proving the data on corporate governance practices of Korean listed companies. I thank helpful comments by two anonymous reviewers, Tae-Sik Ahn, Jong-Hag Choi, Lee-Seok Hwang, Woon-Oh Jung, Su-Keun Kwak, Hyun-Han Shin, Seung-Weon Yoo, and Yong-Keun Yoo. Any errors are my own.
** Corresponding Author. Address: Doctoral student of the College of Business Administration, Seoul National University, Bldg 58, Suite 415, Sillim-9dong, Gwanak-gu, Seoul, Korea, 151-742; E-mail: hb70@snu.ac.kr; Tel: +82-16-366-5783; Fax: +82-2-872-6900.
1. Introduction
This study examines the association between the cost of debt capital and corporate governance practices in Korea. Although one of the key factors that contributed to the 1997 financial crisis in Korea was the heavy debt, incurred by the top Korean con-glomerates (hereafter, chaebol groups), relatively few empirical studies have used firm-specific data to examine the relation between the cost of debt capital and corpo-rate governance practices. Since the financial crisis, the poor corpocorpo-rate governance practices of chaebol groups have become a contentious issue. Reform of the govern-ance systems of chaebol groups has been both voluntary and mandatory. Although government regulations have facilitated the reform, there is still doubt that the re-form efforts are satisfactory. Scandals about unlawful inheritances and accounting frauds in chaebol groups still make headlines. In addition, according to the results of a survey conducted by the Korea Institute for Industrial Economics and Trade (KIET) in August 2003, managers of 77 Korean listed companies do not consider corporate governance to be an important factor in enhancing firm value or stock price. While this evidence is anecdotal, it provides an important clue about the perspective of those who are responsible for the reform of corporate governance practices.1)
The purpose of this research is to develop hypothesis related to corporate govern-ance systems based on agency theory and to test this hypothesis in the context of the cost of debt capital. There is abundant prior literature on corporate governance sys-tems and firm value (e.g., Mitton, 2002; Fan and Wong, 2002; Classens, Djankov, Fan, and Lang, 2002; Lemmon and Lins, 2003; Joh, 2003; Baek, Kang, and Park, 2004; and Black, Jang, and Kim, 2006a). Many of these studies focus on the relation be-tween corporate governance and equity valuation, and suggest that improved corpo-rate governance practices result in an increase in firm value or stock price. While corporate governance generally benefits shareholders, however, it could also entail different consequences for debtholders. While there is the alignment of interests be-tween debtholders and shareholders, there are also the potential conflicts of interests
1) Of the managers who responded, 66% believe that corporate governance has improved due to government enforcement. However, 45.9% of those who responded believe that the improvement in corporate govern-ance has nothing to do with firm performgovern-ance. Managers pointed out that one important reason for the lack of influence of corporate governance on firm performance was the weak power of outsider share-holders. The second reason that was given was that the imported global standards of corporate governance do not fit Korean firms well.
between them. Therefore, the net impact of strong shareholder governance on deb-tholders is theoretically unclear and thus remains as an empirical question which needs to be specifically addressed (Anderson, Mansi, and Reeb, 2003b; Klock, Mansi, and Maxwell, 2005; Ashbaugh-Skaife, Collins, and Lafond, 2006; Cremers, Nair, and Wei, 2007).
In addition, this study investigates the association between firm value and corpo-rate governance from the perspective of debtholders for the reasons that are outlined by Mansi, Maxwell, and Miller (2004) and Klock et al. (2005). They argue that the debt market is a natural setting to examine the economic impact of corporate govern-ance because; (1) debt represents a significant portion of the value of a typical corpo-ration, and debtholders can provide an equilibrium point between shareholders and managers; (2) the information environment in the debt financing market is character-ized by credit rating agencies and banks; and (3) debt pricing is relatively well de-fined and has small measurement errors compared with equity pricing.
Several studies examine the relation between the cost of debt capital and firm-specific governance systems (Sengupta, 1998; Bhojraj and Sengupta, 2003; Anderson et al., 2004; Ashbaugh-Skaife et al. 2006; Klock et al., 2005; Cremers et al., 2007). These studies focus on the effect of one aspect of firm governance systems or informa-tion quality on the cost of debt capital of firms. The recent studies of Anderson et al. (2004) and Ashbaugh-Skaife et al. (2006) are particularly relevant to this paper as they find that the cost of debt is reduced in firms that have strong corporate govern-ance practices.
This study uses firm-specific corporate governance score data for the period of 2001 to 2004, obtained from the Korea Corporate Governance Service (hereafter, KCGS), an independent non-profit organization that is under the joint sponsorship of six securities-related organizations in Korea. This data set of comprehensive corpo-rate governance practices is divided into five categories: shareholder rights protection, board of directors, corporate disclosure, audit committee, and dividend policies. This study examines four proxies of cost of debt capital−industry-adjusted leverage ratio, interest rates, bond ratings, and bond spreads−patterned after prior studies (e.g., Faccio, Lang, and Young, 2004; Pitman and Fortin, 2004; Mansi et al., 2004; Bhojraj and Sengupta, 2003). The testable hypothesis predicts that the cost of debt capital is reduced in firms with sound corporate governance practices.
governance practices have lower industry-adjusted leverage ratios, lower interest rates, and higher bond ratings. The results also provide evidence that the relation between the cost of debt capital and corporate governance practices is more pro-nounced in firms that have assets of more than 2 trillion won (approximately US$2 billion). Finally, the results indicate that of the five corporate governance practices, dividend policies, shareholder rights protection, and audit committee are significant factors in lowering the cost of debt capital.
This study contributes to the extant literature on corporate governance and firm valuation in several ways. First, it investigates whether the corporate governance systems that were adopted in the aftermath of the 1997 financial crisis based on global standards work favorably in Korea’s external debt market. The results of this investigation provide the first evidence that global standards of corporate governance have an economic impact on the cost of debt financing.2) Second, this study can
pro-vide independent verification of the usefulness of the KCGS scores. The scores are already used to select firms that demonstrate good corporate governance for inclusion in the Korea Corporate Governance Stock Market Price Index (KOGI).3) Third, this
study is the first comprehensive attempt to examine the relation between corporate governance practices and the cost of debt capital of Korean listed firms. This study also adds to the information on the bond market for potential investors, who conjec-ture that the Korean bond market is not as efficient as the stock market.4)
This study is organized as follows. Section 2 reviews the literature on the relation between corporate governance and firm value, with a focus on the cost of debt capital. Section 3 describes the research design and the empirical measure of proxies of the cost of debt capital. Section 4 discusses the main results and robustness checks. Sec-tion 5 discusses addiSec-tional analysis, and secSec-tion 6 concludes the study.
2) Before the 1997 financial crisis, a sound corporate governance mechanism of Korean listed firms did not exist. Since the financial crisis, explicit income shifting measures of chaebol groups, such as cross share-holding, reciprocal debt guarantees, and internal transactions, have been restricted. However, the public is still suspicious of the effect of corporate governance reform by the Korean government.
3) Currently, 50 firms belong to the KOGI. According to a report by the KCGS, the KOGI is used as an un-derlying index for exchange traded funds, particularly for long-term investors who seek solid returns from equity investments. For the period from January, 2003 to September, 2004, the KOSPI shows a 9% aver-age return with a standard deviation of 1.59%, whereas the KOGI shows a 7% averaver-age return with a stan-dard deviation of 1.49% (See “Evaluation Results of Corporate Governance in the Korean Stock Market” by the KCGS, 2004).
4) See Won (2005). Analysis on bond market liberalization and its impact on the market after financial crisis. Journal of Korean Economic Development 11: 23-57.
2. Research and Development of the Hypothesis
2.1 Corporate Governance in Emerging Markets
Due to the Asian financial crisis, recent researches on corporate governance in emerging markets focus on the relation between corporate governance and firm value. Typical in emerging markets, a concentrated ownership structure (e.g., stock pyra-mids and cross ownership) makes it difficult for outside shareholders to monitor cor-porate insiders (e.g., controlling shareholders and their associated managers). A common view supports that weak corporate governance systems impair firm value. Empirical evidence for this argument is presented in several cross-country studies which examine the relation between corporate governance and firm performance (Johnson, Boone, Breach, and Friedman, 2000; Classens, Djankov, and Lang, 2000; Mitton, 2002).
Using the ownership structure of 977 companies in seven East Asian economies, Fan and Wong (2002) show that concentrated ownership is related to low earnings informativeness because concentrated ownership forbids the disclosure of the pro-prietary information of firms to protect their rent-seeking activities. Haw, Hu, Hwang, and Wu (2004) also find that income management which is the result of the separation of the voting rights and cash flow rights of concentrated ownership is greater in countries in which statutory protection of minority rights and extra-legal institutions (i.e., the effectiveness of competition laws, diffusion of the press, and tax compliance) is not high.
Poor corporate governance systems are considered a primary reason for the value discount of Korean listed firms.5) Concentrated ownership of chaebolgroups in which
there was a large divergence between the voting rights and cash flow rights appeared to play a main role in the poor corporate governance systems before the financial cri-sis. Joh (2003) examines how controlling shareholders in a concentrated ownership expropriate firm resources even when the ownership concentration is small. Baek et al. (2004) find that changes in firm value during the 1997 financial crisis are associ-ated with firm-specific corporate governance systems. Black et al. (2006a, 2006b)
5) According to Kim and Lee (2003), global money managers think that the “Korea Discount” is due to the poor corporate governance system of Korean companies. See also Choe and Lee (2003) for the associa-tion between governance structure and stock returns.
port that after the financial crisis, corporate governance is an important factor in ex-plaining the market value of Korean listed companies. In fact, firms that have 50% or more outside directors have an approximately 40% higher share price.
2.2 The Effect of Corporate Governance on Debt pricing
Several studies examine the effect of corporate governance systems on debt pricing. Using disclosure scores as proxies for asymmetry of information in the market, Sen-gupta (1998) finds that firms with high disclosure quality ratings from financial ana-lysts enjoy a lower effective interest cost of issuing debts; firms with more timely and informative disclosures are perceived to have a lower likelihood of hiding bad infor-mation. As a result, it is expected to be charged a lower risk premium by debtholders. Bhojraj and Sengupta (2003) argue that effective monitoring of management affects bond yields and ratings through its impact on the default risk of firms. Specifically, firms with greater institutional ownership and stronger outside control of the board have lower bond yields and higher ratings of their bond issues.
Anderson et al. (2004) presume that the control of financial reporting quality by the board of directors is the most important thing, since debtholders count on accounting based covenants in their loan agreements. Consistent with the conjecture, they con-firm the significantly negative relation between the cost of debt capital and the exis-tence of an independent board and audit committee. Ashbaugh-Skaife et al. (2006) also find that the credit ratings of firms are positively related to board independence, board stock ownership, and board expertise by monitoring management. This indi-cates that better board structure and processes lead to strong monitoring of man-agement that restrict managerial opportunism. Furthermore, financial transparency such as accrual quality and earnings timeliness is positively associated with credit ratings. However, firms with strong shareholder rights have lower credit ratings and a higher cost of debt financing because shareholders can exercise their influence to affect wealth transfers from bondholders through asset substitution or exposure to takeover.
Similarly, Anderson et al. (2003b) and Klock et al. (2005) examine the impact of weak shareholder rights such as founding family ownership or various anti-takeover provisions on the cost of debt capital, respectively. The results indicate that founding
family ownership or strong anti-takeover provisions are associated with a lower cost of debt financing. This means that founding family ownership or strong anti-takeover provisions, although not beneficial to shareholders, are viewed favorably in the bond market. Cremers et al. (2007) provide additional evidence on the anti-takeover provi-sions on the cost of debt capital. They find that shareholder control is associated with higher (lower) bond yields if the firm is exposed to (or protected from) takeovers. They also argue that these results are derived from the interest divergence between share-holders and bondshare-holders and that the role of bond covenants is important to decrease the conflict between shareholders and debtholders.
2.3 Development of the Hypothesis
This paper investigates the effects of corporate governance systems on debtholders. It is assumed that a well-designed corporate governance system can reduce the possi-bility of information asymmetry and managerial opportunistic behavior, and there-fore outside investors (i.e., shareholders and debtholders) discount of the future firm value at a lower rate of return. Based on the agency theory, this paper offers the di-rectional hypothesis that the cost of debt capital is reduced in firms with sound cor-porate governance practices.
Ashbaugh-Skaife et al. (2006) explain debt pricing based on agency theory. They address that bondholders, and more generally debt stakeholders, face two types of agency conflicts that increase the probability of default. First, agency conflict hap-pens in the relation between management and bondholders since self-interest mana-gerial behavior induces information asymmetry and creates moral hazard problems. Second, agency conflict that bondholders face occurs in the relation between share-holders and bondshare-holders since shareshare-holders in levered firms have incentives to make decisions that can transfer wealth from bondholders to themselves. This wealth transfer can affect the persistence of the firm’s future cash flows and thus increase the probability of default.6) According to Ashbaugh-Skaife et al. (2006), some of the
corporate governance attributes may protect the interests of bondholders by
6) Ashbaugh-Skaife et al. (2006) refer to the role that governance plays in mitigating the agency conflicts between management and all stakeholders as the “management disciplining” hypothesis. Alternatively, they refer to the role that governance features that weaken shareholder rights as the “wealth redistribu-tion” hypothesis.
ing either the conflict between management and bondholders or the conflicts between shareholders and bondholders. However, corporate governance systems that protect the interest of shareholders will not necessarily be aligned with the interest of deb-tholders. Using KCGS’s framework, this paper investigate corporate governance practices that potentially affect firm’s debt pricing. KCGS develops a comprehensive framework for evaluating corporate governance that is based on five governance categories; shareholder right protection, board of directors, corporate disclosure, au-dit committee, and dividend policy.
This paper also investigates the effect of dividend policy on debtholders because dividend policy is treated as one of corporate governance practices by KCGS. Prior literature explains dividend policy as a consequence of agency conflicts. Dividends reduce the cash flow that is under the control of managers or controlling owners and their power to spend on negative net present value projects (Jensen and Meckling, 1976; Jensen, 1986). Furthermore, dividends may impose additional monitoring by forcing the managers to address the external financing market, and may be useful in adjusting the level of risk taken by managers (Easterbrook, 1984).7) Managers even
signal superior future performance to decrease information asymmetry by increasing dividends (Bhattacharya, 1979; Miller and Rock, 1985; John and Williams, 1985).8)
However, there is no prior study that documents the impact of dividend policy on bondholders directly when better monitoring of management occurs. In general, shareholders and bondholders have a conflicting interest over dividend policy. If shareholders demand direct payouts of firm assets (dividends or share repurchases) as opposed to supporting the manager’s investments in positive net present value projects, then the mean of a firm’s future cash flow distribution could be lower. Con-sequently, the reduction in a firm’s expected future cash flows increases bondholders’ default risk, thereby reducing bond prices (Easterbrook, 1984). According to prior studies, the net impact of corporate governance practices including dividend policy on debtholders is unclear and the effects of overall corporate governance systems on
7) Jensen (1986) also explains the benefit of debt in reducing agency costs of free cash flow. He notes that debt financing enables managers and their organizations to be more efficient in paying out future cash flow. Thus, debt reduces the agency costs of free cash flow as an effective substitute for dividends. He also emphasizes that this control function of debt is especially important for shrinking firms with large cash flows and low growth opportunities.
8) As a relevant theory on dividend policy, empirical paper has examined the use of changes in dividends as a signal of the future prospects of a firm. The argument that dividends signal the well-being of the firm to investors and so promote confidence is called “signaling theory”.
tholders are ultimately an empirical issue.9)
3. Model Development and Research Variables
3.1 The Regression Models
This paper sets the main models using the corporate governance score (CGSCORE) constructed by the KCGS to estimate the relevance of the four proxies of the cost of debt capital. Each dependent variable has a different set of control variables. All of the control variables are derived from the prior literature. The four pooled cross-sectional models are as follows.
ADJ_LEV1 = α + β1CGSCORE (FAC1 ~ FAC5) + β2LNTASSET +β3ALTMAN + β4TOBINQ
+ β5 SGROWTH + β6COLLAT + β7BETA + β8PERFORM + β9Year Dummy
+ β10 Industry Dummy + ε (1)
INT_RATE = α + β1CGSCORE (FAC1 ~ FAC5) + β2LNTASSET + β3SGROWTH
+ Β4COLLAT + Β5INT_COV + β6CASHFLOW + β7LEV + β8Year Dummy
+ β9 Industry Dummy + ε (2)
WRATING = α + β1CGSCORE (FAC1 ~ FAC5) + β2LNTASSET + β3BETA + β4BM
+ β5LEV + Β6RETVOL + β7PERFORM + β8WTMATURE + β9LWTISIZE
+ β10Year Dummy + β11Industry Dummy + ε (3)
WSPREAD = α + β1CGSCORE (FAC1 ~ FAC5) + β2LNTASSET + β3SGROWTH
+ Β4 BETA + Β5 BM + Β6LEV + β7RETVOL + β8PERFORM + β9LWTISIZE
+ β10 WDURAT + β11 WCONVEC + β12WBAGE + Β13Year Dummy
+ β14 Industry Dummy + ε (4)
3.2 Research Variables
Dependent Variables
ADJ_LEV1 = industry-adjusted leverage ratio estimated as each corporation’s leverage ratio minus the median of the ratio in the same industry;
9) Ahmed, Billings, Morton, and Stanfors-Harris (2002) find that firms facing more severe conflicts over dividend policy tend to use more conservative accounting. Furthermore, accounting conservatism is asso-ciated with a lower cost of debt capital.
INT_RATE = interest rates on the firm’s debt measured by interest expenses divided by the firm’s average short-term and long-term financial debt;
WRATING = the weighted average bond rating;
WSPREAD = the weighted average spread estimated using the difference between the weighted average yield to maturity of the firm’s outstanding traded bonds and the yield to maturity of treasury bonds with a similar time to maturity.
Test Variables
CGSCORE = corporate governance overall score consisting of five categories;
FAC1 = shareholder rights protection score;
FAC2 = board of directors score;
FAC3 = corporate disclosure score;
FAC4 = audit committee score;
FAC5 = dividend policies score.
Control Variables
LNTASSET = firm size measured by the natural log of the total assets of the firm;
ALTMAN = Altman’s Z score estimated using Altman’s equation (1968);
TOBINQ = Tobin’s Q measured by the market value of equity plus the book value of debt scaled by total assets;
SGROWTH = sales growth computed as the percentage change in sales amount;
COLLAT = asset tangibility as a ratio of fixed to total assets;
PERFORM = firm performance estimated as income before extraordinary items to total sales;
INT_COV = interest coverage as a ratio of the income before extraordinary items and interest expenses divided by interest expenses;
CASHFLOW = firm profitability measured by cash flow from operations scaled by total assets;
BETA = stock beta calculated by the capital asset pricing model over a 60 month-period;
RETVOL = return volatility estimated as the standard deviation of residuals from the market model regression using daily returns over a one-year period;
BM = book to market as a ratio of the book value of equity to the market value of equity;
LEV = leverage estimated as the long-term debt scaled by the market value of equity;
WTMATURE = the weighted average time to maturity of bonds;
LWTISIZE = log of the weighted average bond issue size;
WDURAT = the weighted average bond duration;
WCONVEC = the weighted average bond convexity;
WBAGE = the weighted average bond age computed as the difference between the observation year and the issue year.
The industry-adjusted leverage ratio (ADJ_LEV1) serves as a proxy for the poten-tial cost of capital concerns and incentives of firms to strengthen their financial re-porting interest (Newberry and Mills, 2005). ADJ_LEV1 is also used as a proxy of the agency cost of debt for the expropriation of controlling shareholders who facilitate more debt resources to use for their private interest (Faccio et al., 2004). This esti-mate is the broadest proxy of the cost of debt capital and uses total debt and total as-sets. This study adds the alternative leverage measure, ADJ_LEV2, which is the ra-tio of total debt to total debt and equity.
Interest rates (INT_RATE) is a less broad proxy than ADJ_LEV1, as only interest-bearing liabilities of short-term debt and long-term debt are estimated. As discussed in Pittman and Fortin (2004), INT_RATE may be a noisy proxy of the cost of debt capital because of the indirect way of estimating the dependent variable. They handle the noisy problem by dropping the extreme observations. Following Pittman and Fortin (2004), this study drops the extreme observations that are outside the 1st or 99th percentiles of INT_RATE toalleviate the measurement error.
The proxies that are related to bond pricing (e.g., WRATING and WSPREAD) are the narrowest proxies and use only publicly traded debt securities. Specifically, bond ratings (WRATING) are measured by conversion numbers using one value from 1 to 10 that represents the KIS-NET bond ratings from AAA to BBB-.10) The weighted
av-erage bond spread (WSPREAD) of a firm is calculated by multiplying each bond spread with its equivalent weight, which is computed as the amount outstanding for each bond divided by the total amount outstanding for all publicly traded bonds.
The corporate governance score that is used in this study has a distinct advantage over other corporate governance variables that have been used in prior studies (Sen-gupta, 1998; Bhojraj and Sen(Sen-gupta, 2003). Prior studies investigate just one variable of corporate governance, which can cause the correlated omitted variables problem and in turn, biased estimates. The KCGS’s overall score of corporate governance
10) Anderson et al. (2003b, 2004) use credit rating as a control variable for their spread analysis. They point out a potential problem in that credit rating can incorporate the impact of test variables (e.g., family own-ership or board structure). To alleviate this concern, they use an error term as an estimate of the debt credit ratings by regressing credit ratings on those components. However, this study does not use bond ratings as a control variable for bond spread analysis. If bond ratings are included in the model as a con-trol variable, the incremental effect of the test variable (i.e., the CGSCORE) may be lessened (Bhojraj and Sengupta, 2003). To deal with this issue, this study presents the main results using an extensive set of control variables, which are derived from prior literature on the determinants of corporate bond ratings, to capture the default risk of firms.
tegrates a number of aspects of corporate governance practices within reasonable lim-its. This solves the correlated omitted variables problem as each of the five categories that are correlated with each other predicts the cost of debt capital separately. There-fore, this study can examine the overall and respective effects of corporate govern-ance practices on the cost of debt capital. Ashbaugh-Skaife et al. (2006) address the same issue and use a broad set of corporate governance practices in their study.
The corporate governance scores are divided into five categories. Shareholder rights protection (FAC1) consists of three parts: shareholder rights provisions, con-trolling ownership structure, and related party transactions. Board of directors (FAC2) consists of two parts: the board structure and the meeting procedure. Corpo-rate disclosure (FAC3) comprises management transparency and the voluntary and mandatory disclosure behaviors of the corporation. Audit committee (FAC4) includes the structure and procedures of the audit committee. Dividend policies (FAC5) com-prises the dividend yield, dividend payout ratio of the past three years, and treasury stock purchases. Firms with better corporate governance systems have higher scores. This paper includes Appendix for more detail information on survey questions.11)
Control variables include both firm characteristics and bond characteristics. To mitigate endogeneity concerns, this study uses one-year lagged data for firm charac-teristics. For bond characteristics, however, contemporaneous data are used. Firm size (LNTASSET) is associated with the cost of debt capital of a firm either positively or negatively. Firm size is a proxy for both the reduced probability of bankruptcy risk and the better information environment of large firms. Thus, it is hard to predict the
11) The score should be credible based on the purpose of the KCGS survey. The KCGS established the sur-vey to choose well-governed firms for the KOGI, which encourages listed companies to improve their corporate governance. Especially, the survey for 2003~2004 is well constructed by an objective question format that is based on the inclusion or omission of approximately 100 items of corporate governance practices.
Several papers use same data set to investigate the effect of the corporate governance system on various topics. Yoon and Oh (2005) examine the effects of corporate governance on the firm’s performance, market value and market returns of Korean listed companies. They find that a firm’s performance and market value are highly correlated with its corporate governance score. Furthermore, they conclude that an investment strategy using the information on corporate governance score can produce excess returns. Park, Park, and Hwang (2005) also use the same data set to investigate the relation between corporate governance and wealth redistribution to shareholders. They find that firms with sound corporate govern-ance practices are associated with both high firm value and high dividend payments, suggesting that sending out positive signal to the market by paying out high dividends can achieve the goal of lower cost of capital in the long run. Choi and Yoon (2006) also examine the effects of corporate governance on the conservativeness of accounting information. In general, they find that firms with a high overall corporate governance index report more conservative accounting information and that foreign investor ownership contributes to improve the conservativeness of accounting information.
sign of firm size. Because managers with investment opportunities may choose lower debt or more debt, this study does not predict the signs of TOBINQ or SGROWTH (Rajan and Zingales, 1995; Titman and Wessels, 1988).12) Asset tangibility (COLLAT)
is also unclear. Interest rates increase for riskier borrowers who must provide collat-eral for their loans (Pittman and Fortin, 2004). Due to their information value, how-ever, tangible assets can lower the interest rate of a firm (Harris and Raviv, 1990). PERFORM, INT_COV, and CASHFLOW,proxies of firm profitability, are expected to have a negative association with the cost of debt capital.
Bond characteristics are computed as the summation of the weighted value of all bonds for each firm, with the weight being the amount that is outstanding for each bond issue divided by the total amount that is outstanding for all publicly traded bonds of the firm. Prior studies have hypothesized that bonds with longer maturity and less liquidity have higher spreads and lower ratings as their greater interest risks exposure (Anderson et al., 2003b). However, Mansi et al. (2004) argue that firms with higher risk typically issue shorter term bonds with higher coupon rates. In that case, a negative relation between duration (or time to maturity) and bond spread is expected. This study also predicts a negative association between WTMATURE and WRATING, and between WDURAT and WSPREAD. The proxy of economies of scale in underwriting, LWTISIZE, is expected to have a negative sign (Bhojraj and Sengupta, 2003; Anderson et al., 2003a, 2003b, 2004; Kolck et al., 2005). Industry and year effects are controlled for because unobserved factors that may influence the cost of capital can be significant across industries and by year.
4. Sample Selection, Descriptive Statistics, and Empirical Results
4.1 Sample Selection
This study uses a given corporate governance score based on KCGS surveys for the period 2001-2004. The response rate is relatively high, and the total number of re-spondents for four years is 1,647. Financial statements data are taken from the KIS-FAS database, stock price and return data are taken from the KIS-SMAT database,
12) To find out more about the relation between leverage and Tobin’s Q, see McConell and Servaes (1995) and Faccio et al. (2004).
and bond-related data are taken from the KIS-NET database.
Table 1. Distribution of Samples by Year and by Industry
Panel A : Sample Distribution by Year No.of Survey
Respondents ADJ_LEV1 (1) INT_RATE (2) WRATING (3) WSPREAD (4)
2001 261 216 211 84 84
2002 553 476 454 102 99
2003 426 372 346 69 69
2004 407 359 318 81 79
Total 1,647 1,423 1,329 336 331
Panel B : Sample Distribution by Industry
Industries ADJ_LEV1 (1) INT_RATE (2) WRATING (3) WSPREAD (4)
Fishing 15 16
Mining 3 3 3 2
Manufacturing 1,079 1,007 216 212
Utilities 35 35 9 9
Construction 90 86 43 42
Wholesale and Retail 107 101 30 29
Transportation 43 45 17 17
Telecommunication 12 12 11 13
Real Estate and Rental
Service 3 3
Business Services 31 17 6 6
Education Services 3 2
Recreation, Culture, and
Health services 2 2 1 1
Total
(Firm) 1,423(560) 1,329(524) (150)336 (152)331
The sample consists of corporate governance-scored nonfinancial firms listed on the Korea Stock exchange (KSE) during the period 2001 to 2004, ranging from 331 to 1,423. This study obtains observations from various sources, including the Korea Corporate Governance Service (KCGS), KIS FAS data base, KIS SMAT data base and KIS-NET data base. Panel A presents sample distribution by year. Panel B presents sample distribution by industry, using one-digit Korean SIC codes. Model (1), the industry-adjusted leverage ratio, has 1,423 firm year observa-tions; model (2), interest rates, has 1,329 firm-year observaobserva-tions; model (3), bond ratings, has 336 firm-year observations; and model (4), bond spreads, has 331 firm-year observations.
Firms are excluded if they belong to the financial service industry, as regulated firms have more strict corporate governance systems than do unregulated firms. All of the firms in the sample have the requisite data on the cost of debt capital and cor-porate governance score and control variables.13) To alleviate potential measurement
error problems, observations that fall within one percent of the top or bottom of the dependent variables are deleted, except bond ratings. All of the control variables are also winsorized at the 1st or 99th percentile to reduce the influence of extreme values.
As outlined in panel A of Table 1, the number of final observations totals 331 through 1,423 firm-year observations over the 2001~2004 period for four regression models. Panel B of Table 1 provides the distribution of sample firms across different indus-tries, using one-digit Korean SIC codes. All of the models are heavily concentrated in the manufacturing industry, ranging from 64.04% to 75.83%.
4.2 Descriptive Statistics and the Pearson
’
s Correlations of Variables
4.2.1 Descriptive Statistics
Table 2 presents the summary statistics of the regression variables. The mean (median) of industry-adjusted leverage (ADJ_LEV1) is -2.11% (-1.71%) with a stan-dard deviation of 18.77%. The mean (median) of interest rates (INT_RATE) is 7.65% (7.06%), ranging from a lowest score of 0.4% to a highest score of 34.6%. The mean (median) value of bond ratings (WRATING) is 7.36 (8.00), ranging from 1 (AAA) to 10 (BBB-). The mean (median) of bond spreads (WSPREAD) is 1.70% (1.00%) with a standard deviation of 2.50%.
The mean of firm size (LNTASSET) is 26.22 (approximately 1 trillion won) with large variation across the sample. The mean (median) of Altman’s Z score, an indicator
13) To estimate the weighted average bond spreads, a calculation process of several phases is carried out. First, the median value of each bond spread from a total of 167,967 daily trade spreads is taken (both the median and mean spread are estimated, but the summary results are not much different). After this is done, there are a total of 3,251 bond-year observations for the period 2001~2004. Bonds that carry pro-tective options are eliminated. Next, the equivalent weight of each bond for individual firms is calculated, and each spread is multiplied with the equivalent weight. Then all of the weighted spreads are summed up by year, and through this calculation, a total of 950 firm-year bond ratings and spreads remain. Nega-tive spreads are also eliminated. After the last merging process, with the corporate governance score, the firm-year sample is reduced further due to the great number of unmerged bond data. The non-investment level is also deleted as high-risk non-investment grade bonds are not traded frequently in Korea’s bond market and typically carry more protective options. After being truncated, 331 observations for bond rat-ings and 336 observations for bond spreads remain in the final sample.
TABLE 2. Descriptive Statistics for Variable Measures
Panel A : Dependent Variables
N MEAN STD MIN Q1 MEDIAN Q3 MAX
ADJ_LEV1 1,423 -0.021 0.187 -0.381 -0.164 -0.017 0.099 0.644 INT_RATE 1,329 0.076 0.037 0.004 0.054 0.070 0.090 0.346
WRATING 336 7.363 2.351 1.000 6.000 8.000 9.000 10.000
WSPREAD 331 0.017 0.025 0.001 0.005 0.010 0.021 0.242
Panel B : Test Variables
CGSCORE 1,423 0.426 0.095 0.203 0.356 0.416 0.481 0.823 FAC1 1,423 0.151 0.062 0.066 0.106 0.140 0.170 0.370 FAC2 1,423 0.124 0.051 0.023 0.083 0.120 0.160 0.293 FAC3 1,423 0.080 0.047 0 0.056 0.076 0.110 0.260 FAC4 1,423 0.032 0.026 0 0.010 0.030 0.050 0.143 FAC5 1,423 0.037 0.036 0 0.010 0.026 0.050 0.145
Panel C : Control Variables
LNTASSET 1,423 26.220 1.453 23.668 25.217 25.972 27.009 30.605 ALTMAN 1,423 0.940 0.492 0.177 0.636 0.871 1.141 3.348 TOBINQ 1,423 0.810 0.299 0.318 0.632 0.755 0.906 2.049 SGROWTH 1,423 0.029 0.290 -0.664 -0.059 0.047 0.147 1.254 COLLAT 1,423 0.568 0.174 0.185 0.445 0.576 0.701 0.918 PERFORM 1,423 0.046 0.119 -0.817 0.009 0.043 0.094 1.538 BETA 1,423 0.801 0.365 -0.118 0.550 0.786 1.022 1.864 INT_COV 1,329 7.599 38.370 -22.907 0.775 2.396 6.596 312.143 CASHFLOW 1,329 0.057 0.082 -0.194 0.009 0.056 0.109 0.273 LEV 1,329 1.336 2.223 0.008 0.231 0.577 1.399 14.154 PRIME 1,329 0.058 0.007 0.050 0.053 0.061 0.061 0.071 BM 336 2.663 2.137 0.332 1.091 2.148 3.512 13.101 RETVOL 336 0.029 0.009 0.013 0.023 0.028 0.033 0.059 WTMATURE 336 2.936 0.382 1.500 2.861 3.000 3.000 4.071 LWTISIZE 336 24.602 0.981 22.33 24.017 24.417 25.328 26.937 WDURAT 331 1.276 0.623 0 0.880 1.271 1.580 3.521 WCONVEC 331 3.099 2.544 0 1.546 2.739 3.952 21.90 WBAGE 331 1.356 0.868 0 0.787 1.333 2.000 3.000
The variables are defined as follows.
ADJ_LEV1 = industry-adjusted leverage ratio estimated as each corporation’s lever-age ratio minus the median of the ratio in the same industry;
INT_RATE = interest rates on the firm’s debt measured by interest expenses divided by the firm’s average short-term and long-term financial debt;
WRATING = the weighted average bond rating;
WSPREAD = the weighted average spread estimated using the difference between the weighted average yield to maturity on the firm’s outstanding traded bonds and the yield to maturity on the treasury bonds with similar time to maturity;
FAC1 = shareholder rights protection score;
FAC 2 = board of directors score;
FAC3 = corporate disclosure score;
FAC4 = audit committee score;
FAC5 = dividend policies score;
LNTASSET = firm size measured by the natural log of the total assets of the firm;
ALTMAN = Altman’s Z score estimated using Altman’s equation (1968);
TOBINQ = Tobin’s Q measured by the market value of equity plus the book value of debt scaled by total assets;
SGROWTH = sales growth computed as percentage change in sales amount;
COLLAT = asset tangibility as the ratio of fixed to total assets;
PERFORM = firm performance estimated as income before extraordinary items to total sales;
INT_COV = interest coverage as the ratio of the income before extraordinary items and interest expenses divided by interest expenses;
CASHFLOW = firm profitability measured by the cash flow from operations scaled by total assets;
BETA = stock beta calculated by the capital asset pricing model over a 60-month period;
RETVOL = return volatility estimated as the standard deviation of residuals from the market model regression using daily returns over a one-year period;
BM = book to market as a ratio of the book value of equity to the market value of equity;
LEV = leverage estimated as the long-term debt scaled by the market value of equity;
WTMATURE = the weighted average time to maturity of the bond;
LWTISIZE = log of the weighted average bond issue size;
WDURAT = the weighted average bond duration;
WCONVEC = the weighted average bond convexity;
WBAGE = the weighted average bond age computed as the difference between the observation year and the issue year.
of the financial condition of a firm, is 0.94 (0.87). The mean (median) scores of Tobin’s Q, sales growth, and firm performance are 0.81 (0.75), 2.92% (4.74%), and 4.68% (4.33%), respectively, which shows a business slowdown for the sample period. Turn-ing to proxies for bond characteristics, the mean (median) time to maturity is 2.93 (3.0) years, the mean (median) duration is 1.27 (1.27) years, and the mean (median) bond age is 1.35 (1.33) years. On average, corporate bonds have a short time to ma-turity; furthermore, bonds that are primarily traded in the Korean bond market are those that have a short outstanding length.
4.2.2. Pearson’s Correlations among Regression Variables
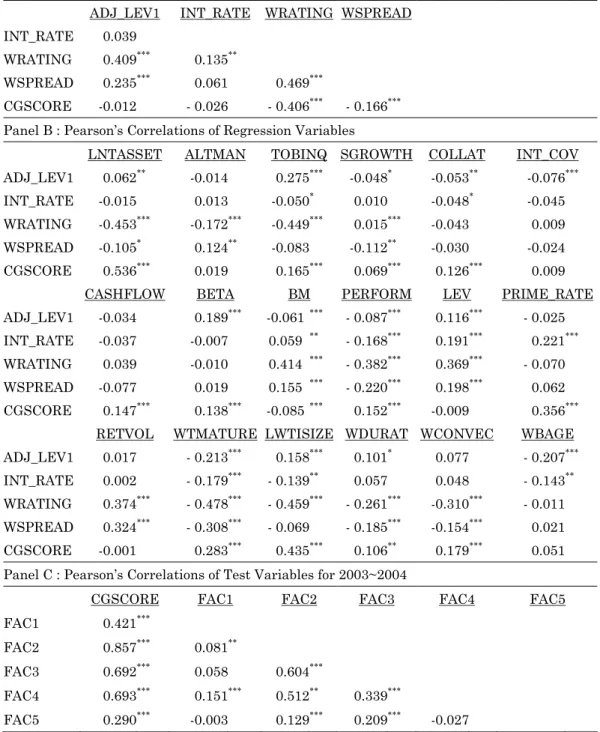
Panel A of Table 3 shows the Pearson’s correlations of the dependent variables. The costs of debt capital are almost positively correlated with each other, but some of cor-relations with INT_RATE are not significant. ADJ_LEV1 is positively and signifi-cantly correlated with WRATING (0.409) and WSPREAD (0.235), INT_RATE is posi-tively and significantly correlated with WRATING (0.135), and WRATING is posi-tively and significantly correlated with WSPREAD (0.469). All of the dependent vari-ables are negatively associated with the CGSCORE, but just two of them (WRATING and WSPREAD) are statistically significant, which suggests that firms with a higher CGSCORE have higher ratings and lower spreads.
Panel B of Table 3 provides the Pearson’s correlations between the dependent vari-ables and the independent varivari-ables. ADJ_LEV1 is positively related to LNTASSET, TOBINQ, and BETA and negatively related to PERFORM. Large or growth firms tend to acquire more debt whereas profitable firms need less external debt financing. INT_RATE is positively correlated with leverage and the annual prime rate. WRAT-ING and WSPREAD are negatively correlated with LNTASSET and PERFORM, which suggests that large or profitable firms deserve higher ratings and lower spreads. In addition, WRATING and WSPREAD are negatively correlated with time to maturity (WTMATURE) and duration (WDURAT), which suggests that firms that issue large or long-term bonds usually have higher bond ratings and lower spreads.
Panel C of Table 3 reports the Pearson’s correlations among the test variables for the period 2003~2004.14) The corporate governance overall score (CGSCORE) is
posi-tively correlated with each category at a 1% significance level. FAC1 (shareholder rights protection) has a positive correlation with FAC2 (board of directors) and FAC4 (audit committee) at a 1% and 5% significance level, respectively. This means that the im-provement of shareholder rights protection is achieved together with these two cate-gories. FAC2 (board of directors) is positively correlated with all of the categories, and its correlations with FAC3 (corporate disclosure) and FAC4 (audit committee) are especially high. Furthermore, FAC2 is also highly correlated with the CGSCORE, per-haps due to the enforcement of this element of corporate governance by the government
14) The survey construction for 2001~2002 is somewhat different from the survey construction for 2003~ 2004. This study reports the correlation table of test variables only for the 2003~2004 period because the survey structure is more consistent and stable.
Table 3. Pearson’s correlations of regression variables
Panel A : Pearson’s Correlations of Dependent Variables
ADJ_LEV1 INT_RATE WRATING WSPREAD INT_RATE 0.039
WRATING 0.409 *** 0.135**
WSPREAD 0.235 *** 0.061 0.469***
CGSCORE -0.012 - 0.026 - 0.406*** - 0.166***
Panel B : Pearson’s Correlations of Regression Variables
LNTASSET ALTMAN TOBINQ SGROWTH COLLAT INT_COV ADJ_LEV1 0.062 ** -0.014 0.275*** -0.048* -0.053** -0.076***
INT_RATE -0.015 0.013 -0.050* 0.010 -0.048* -0.045
WRATING -0.453 *** -0.172*** -0.449*** 0.015*** -0.043 0.009
WSPREAD -0.105 * 0.124** -0.083 -0.112** -0.030 -0.024
CGSCORE 0.536 *** 0.019 0.165*** 0.069*** 0.126*** 0.009
CASHFLOW BETA BM PERFORM LEV PRIME_RATE
ADJ_LEV1 -0.034 0.189*** -0.061*** - 0.087*** 0.116*** - 0.025
INT_RATE -0.037 -0.007 0.059 ** - 0.168*** 0.191*** 0.221***
WRATING 0.039 -0.010 0.414 *** - 0.382*** 0.369*** - 0.070
WSPREAD -0.077 0.019 0.155 *** - 0.220*** 0.198*** 0.062
CGSCORE 0.147 *** 0.138*** -0.085*** 0.152*** -0.009 0.356***
RETVOL WTMATURE LWTISIZE WDURAT WCONVEC WBAGE ADJ_LEV1 0.017 - 0.213*** 0.158*** 0.101* 0.077 - 0.207***
INT_RATE 0.002 - 0.179*** - 0.139** 0.057 0.048 - 0.143**
WRATING 0.374 *** - 0.478*** - 0.459*** - 0.261*** -0.310*** - 0.011
WSPREAD 0.324 *** - 0.308*** - 0.069 - 0.185*** -0.154*** 0.021
CGSCORE -0.001 0.283*** 0.435*** 0.106** 0.179*** 0.051
Panel C : Pearson’s Correlations of Test Variables for 2003~2004
CGSCORE FAC1 FAC2 FAC3 FAC4 FAC5
FAC1 0.421 ***
FAC2 0.857 *** 0.081**
FAC3 0.692 *** 0.058 0.604***
FAC4 0.693 *** 0.151*** 0.512** 0.339***
FAC5 0.290 *** -0.003 0.129*** 0.209*** -0.027
Note) See Table 2 for the variable definitions. ***, **, and * denote the significance of the p-values at the 0.01,
under the Securities and Exchange Act of 2000.15) That is, firms are usually required
to reform the structure and procedures of their board of directors first, because the board composition and increased responsibility of board members have been regarded as the most important measures to mitigate agency problems.
4.3 Main Empirical Results
4.3.1 Regression Results of the Costs of Debt Capital on the Corporate Gov-ernance Overall Score
Table 4 and Table 5 present four regression results of the costs of debt capital on the corporate governance score using the pooled sample. The statistical significance of the reported coefficients is based on the heteroscedasticity-consistent covariance matrix (White, 1980).16)
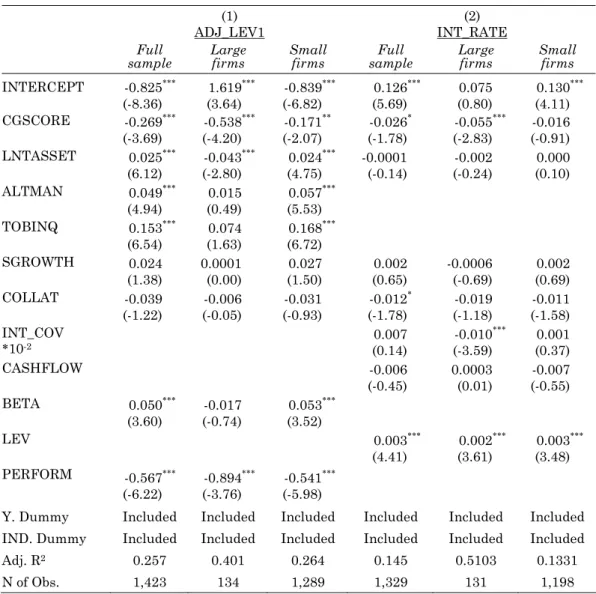
First of all, Table 4 shows regression results of book-based measures, such as in-dustry-adjusted leverage ratio and interest expenses. In Table 4, The CGSCORE is strongly negatively significant in model (1) (coefficient = -0.269, t = -3.69) and mar-ginally negatively significant in model (2) (coefficient = -0.026, t = -1.78). The signs of the control variables are almost as predicted. In model (1), firm size (LNTASSET), ALTMAN, and Tobin’s Q have positively significant coefficients, which indicates that large or growth firms usually have a higher debt ratio (Rajan and Zingales, 1995; Titman and Wessels, 1988). Consistent with the prediction, PERFORM has a nega-tive sign, which supports the theory that profitable firms prefer internal funds over external debt financing (Harris and Raviv, 1990).17) An interesting finding for model
(2) is that the firm’s fixed assets (COLLAT) are inversely related to the interest rate, which shows that a firm’s tangible assets have information value and lower the risk
15) Under the Securities and Exchange Act of 2000, large firms with total assets of more than 2 trillion won must have a board of directors with at least three outside directors and 50% outside directors, an audit committee with at least two-thirds outside members and an outside director as the chairperson, and an outside director nominating committee.
16) Each model is estimated again with Newey-West (1987) standard errors, because this study uses panel data for which the error term and regressor may be autocorrelated. All results remain robust after correct-ing for heteroscedasticity and serial correlation.
17) An additional robustness test for model (1) is performed by using an alternative dependent variable,
ADJ_LEV2, in which the denominator includes total debt and shareholder equity. The results are consis-tent with the full sample in Table 4, which suggests that the CGSCORE is negatively associated with
Table 4. Regression Results of Model (1) and Model (2) on Overall Corporate Governance Score
(1)
ADJ_LEV1 INT_RATE (2)
Full
sample Large firms Small firms sample Full Large firms Small firms
INTERCEPT -0.825 (-8.36) *** 1.619 (3.64) *** -0.839 (-6.82) *** 0.126 (5.69) *** 0.075 (0.80) (4.11)0.130 *** CGSCORE -0.269 (-3.69) *** -0.538 (-4.20) *** -0.171 (-2.07) ** -0.026 (-1.78) * -0.055 (-2.83) *** -0.016 (-0.91) LNTASSET 0.025 (6.12) *** -0.043 (-2.80) *** 0.024 (4.75) *** -0.0001 (-0.14) (-0.24) -0.002 (0.10)0.000 ALTMAN 0.049 (4.94) *** 0.015 (0.49) (5.53)0.057 *** TOBINQ 0.153 (6.54) *** 0.074 (1.63) 0.168 (6.72) *** SGROWTH 0.024 (1.38) 0.0001(0.00) (1.50)0.027 (0.65)0.002 -0.0006 (-0.69) (0.69)0.002 COLLAT -0.039 (-1.22) -0.006 (-0.05) -0.031 (-0.93) -0.012 (-1.78) * -0.019 (-1.18) -0.011 (-1.58) INT_COV *10-2 (0.14)0.007 (-3.59) -0.010 *** 0.001 (0.37) CASHFLOW -0.006 (-0.45) 0.0003 (0.01) (-0.55)-0.007 BETA 0.050 (3.60) *** -0.017 (-0.74) (3.52)0.053 *** LEV 0.003 (4.41) *** 0.002 (3.61) *** 0.003 (3.48) *** PERFORM -0.567 (-6.22) *** -0.894 (-3.76) *** -0.541 (-5.98) ***
Y. Dummy Included Included Included Included Included Included IND. Dummy Included Included Included Included Included Included
Adj. R2 0.257 0.401 0.264 0.145 0.5103 0.1331
N of Obs. 1,423 134 1,289 1,329 131 1,198
Table 4 shows regression results for model (1) and model (2); regression on large firms is per-formed using firms with assets of more than 2 trillion won, and regression on small firms is performed using firms with assets of less than 2 trillion won. See Table 2 the variable defini-tions. The t-statistics for the t-test are reported in parentheses. ***, **, and * denote the
signifi-cance of the parameter estimated at the 0.01, 0.05, and 0.10 levels, respectively, based on the heteroscedasticity-consistent covariance matrix following White (1980).
ADJ_LEV1 = α + β1 CGSCORE(FAC1~5) + β2 LNTASSET + β3 ALTMAN + β4TOBINQ +
β5 SGROWTH + β6 COLLAT + β7 BETA + β8 PERFORM + β9 Year Dummy + β10 Industry Dummy +ε
(1)
INT_RATE = α + β1 CGSCORE(FAC1~5) + β2 LNTASSET + β3 SGROWTH + β4 COLLAT +
Table 5. Regression Results of Model (3) and Model (4) on Overall Corporate Governance Score
(3)
WRATING WSPREAD (4)
Full
Sample Firms Large Small firms Sample Full Large firms Small firms
INTERCEPT 32.620 (12.62) *** 37.063 (5.36) *** 42.879 (9.86) *** 0.041 (0.82) (-1.11)-0.288 (5.83)0.235 *** CGSCORE -3.869 (-3.28) *** -4.392 (-2.78) ** -1.182 (-0.66) (-1.59)-0.020 -0.048(-1.67) * -0.001 (-0.07) LNTASSET -0.482 (-3.54) *** -0.511 (-1.68) * -0.886 (-4.01) *** -0.002 (-1.05) 0.0003(0.06) (-2.51)-0.009 ** SGROWTH -0.0005 (-0.09) (0.98)0.009 (-0.92)-0.006 BETA 0.693 (2.52) ** -0.838 (-1.90) * 1.601 (4.67) *** 0.0003 (0.76) (0.25)0.001 (1.38)0.006 BM 0.212 (4.12) *** 0.210 (1.81) * 0.154 (2.12) ** -0.0003 (-0.36) (-0.80)-0.002 0.0005(0.70) LEV 0.177 (3.36) *** 0.074 (0.75) (3.13)0.315 *** 0.0005 (0.68) (1.03)0.002 (-0.20)-0.000 RETVOL 26.600 (1.95) * 111.178 (4.57) *** 26.533 (1.81) * 0.453 (2.05) ** 1.407 (1.91) * 0.308 (1.89) * PERFORM -4.811 (-3.41) *** -9.473 (-3.70) *** -4.003 (-2.23) ** -0.052 (-2.33 ) ** -0.063 (-1.53) -0.034(-0.85) WTMATURE -1.582 (-5.58) *** -1.555 (-3.53) *** -1.413 (-3.05) *** LWTISIZE -0.334 (-1.93) * -0.585 (-1.37) (-1.56)-0.424 (0.52)0.001 (1.06)0.009 0.001(0.28) WDURAT -0.007 (-1.49) -0.013(-1.09) -0.012(-3.07) *** WCONVEC 0.0005 (0.52) 0.001(0.62) 0.001(1.22) WBAGE -0.001 (-0.63) 0.004(0.44) -0.002(-1.25) YEAR D Included Included Included Included Included Included IND. D Included Included Included Included Included Included
Adj. R2 0.626 0.783 0.537 0.182 0.216 0.218
No of Obs. 336 108 228 331 107 224
Table 5 shows regression results for model (3) and model (4); regression on large firms is per-formed using firms with assets of more than 2 trillion won, and regression on small firms is performed using firms with assets of less than 2 trillion won. See Table 2 for the variable defi-nitions. The t-statistics for the t-test are reported in parentheses. ***,**, and * denote the
sig-nificance of the parameter estimated at the 0.01, 0.05, and 0.10 levels, respectively, based on the heteroscedasticity-consistent covariance matrix following White (1980).
WRATING = α + β1CGSCORE(FAC1~5) + β2LNTASSET + β3BETA + β4BM + β5LEV + β 6RET-VOL + β7PERFORM + β8WTMATURE + β9LWTISIZE +β10Year Dummy +
β11Industry Dummy + ε
(3) WSPREAD = α + β1 CGSCORE(FAC1~5) + β2LNTASSET + β3SGROWTH + β4 BETA + β5BM +
β6LEV + β7RETVOL + β8PERFORM + β9LWTISIZE + β10WDURAT + β11WCONVEC + β12WBAGE + β13YearDummy + β14Industry Dummy +ε
of the lenders (Harris and Raviv, 1990). The relation, however, is not strong. As pre-dicted, firm leverage is positively related to interest rate.18)
Secondly, Table 5 shows regression results of market-based measures, such as bond ratings and bond spreads. In Table 5, the CGSCORE is strongly negatively signifi-cant in model (3) (coefficient = -3.869, t = -3.28), but not signifisignifi-cant at a conventional significance level in model (4) (coefficient = -0.020, t = -1.59). The regression results of model (3) provide strong evidence of the usefulness of bond ratings in the Korean bond market. The control variables that are related to firm risk characteristics (BETA, BM, LEV,and RETVOL) have the expected positive signs with a strong significance level. The control variables that are related to bond characteristics (WTMATURE and LWTISIZE) have the expected negative signs. These results are consistent with those of prior studies of bond ratings (Bhojraj and Sengupta, 2003; Mansi et al., 2004; Ashbaugh-Skaife et al., 2006; Klock et al., 2005). Based on the results, the prediction of the fi-nancial risk of firms by their bond ratings is useful for bond holders in Korea.19)
However, model (4) has only two significant control variables: stock return volatil-ity (RETVOL) and firm performance (PERFORM). This weak result may be due to the inefficiency or the illiquidity of the corporate bond market. According to the prior literature, the corporate bond market is not as efficient as the stock market.20) It is
18) An additional test for model (2) is performed using a new control variable, annual prime rate (PRIME).
PRIME is considered a substitute of YEAR DUMMY and the negative relation between the CGSCORE, and INT_RATE is consistent with the result of full sample regression that is shown in Table 4.
19) In model (3), the additional test of bond ratings using an alternative methodology is performed. First, the ordered probit model is used because of a natural ordering system of bond ratings. Consistent with the re-sults in Table 5, the ordered probit model confirms the negative association between bond ratings and corporate governance practices. Second, Heckman’s two-stage is performed. The sample selection proc-ess that is related to the value of the dependent variable causes bias in the OLS estimators. For bond rat-ing models that have observations selected from bond issurat-ing firms only, potential self-selection bias is corrected by using Heckman’s two-stage model. The inverse Mills’ ratio of model (3) is strongly signifi-cant, which indicates that selection bias may exist. However, the inclusion of the inverse Mills’ ratio does not produce large differences from the previous OLS results. The first-stage probit model (5) is defined as follows (Jung, Kim, and Stulz, 1996):
BOND = α + β1CGSCORE + β2LNTASSET + β3TAXPAY + β4LEV + β5PERFORM
+ β6 MB + β7RETVOL + β8SLACK + β8Year Dummy + β9Industry Dummy + ε. (6)
BOND is an indicator variable which is equal to 1 for firms with outstanding bonds and 0 otherwise. Be-cause of the deductibility of interest payments, the gain from the debt financing relative to equity financ-ing increases with the firm’s tax rate. TAXPAY is a proxy for this benefit estimated by tax payments scaled by the book value of total assts. MB is the market-to-book ratio, and SLACK is cash and liquid as-sets normalized by total asas-sets.
20) According to the commentary in the Korea Economic Research Institution (KERI) Economic Bulletin 25 (2001), the Korean bond market has made a very slow progress in raising funds for companies since the
suggested that local financial market growth is closely correlated with the participa-tion of foreign investors, which also would contribute to the qualitative development of the market. In 2004, the equity market had 41.97% foreign ownership, but the bond market had only 0.48% foreign ownership.21)
In summary, the results of Table 4 and Table 5 indicate that overall corporate gov-ernance score with other control variables are moderately important determinants of the industry-adjusted leverage ratio, interest rates, and bond ratings.
4.3.2 Additional Tests using Firm Size
This section addresses whether the impact of corporate governance practices on the cost of debt capital differs according to firm size. Korea is an appropriate country to study for this purpose because after the 1997 financial crisis, the Korean government reformed the corporate governance systems of large firms with assets of more than 2 trillion won (approximately US$2 billion). To examine this issue, the sample is di-vided by asset size into two groups: small firms (assets of less than 2 trillion won) and large firms (assets of more than 2 trillion won). The results are also given in Table 4 and Table 5.
Even though the large firm sample for model (1) in Table 4 includes just 134 obser-vations, the coefficient of the CGSCORE (coefficient = -0.538, t = -4.20) is larger and stronger than that of the full sample (coefficient = -0.269, t = -3.69) or that of the small firm sample (coefficient = -0.171, t = -2.07). Table 4 also shows that corporate governance practices are closely associated with firm size in model (2). The coefficient of the CGSCORE (coefficient = -0.055, t = -2.83) in the large firm sample is larger and stronger than that of the full sample (coefficient = -0.026, t = -1.78). In the small firm sample, the coefficient of the CGSCORE (coefficient = -0.016, t = -0.91) is no longer significant.
Table 5 provides similar results for the bond rating and bond spread models. The coefficient of the CGSCORE (coefficient = -4.392, t = -2.78) for model (3) is still
1997 financial crisis. The corporate bond share stood at 45% in 1995, but fell sharply and has remained near 30% since 1999. In the same period, the share of government and public agency bonds rose from 32% to 51%. There are two explanations for this. First, since the 1997 financial crisis, lenders have grown extremely averse to lending to business. In addition, large firms’ leverage ratio is legally limited to 200% and thus, the demand of firms for financing has decreased. Second, instead of corporate need, the demand for public funding has increased because of the need for relief funds.
nificant in the large firm sample, but not significant in the small firm sample (coeffi-cient = -1.182, t = -0.66). Model (4) shows similar results. The coeffi(coeffi-cient of the large firm sample (coefficient = -0.048, t = -1.67) is significant at a marginal significance level, but not significant in the small firm sample (coefficient = -0.001, t = -0.07). Spe-cifically, the model (4) WSPREAD regression shows that the CGSCORE is significant only for the large firm sample. The adj_R2 of the large firm sample of three cost of
debt capital models, model (1) ADJ_LEV1, model (2) INT_RATE, and model (3) WRATING, is much larger than the adj_R2 of thefull sample and the small firm
sam-ple.
Overall, these additional tests by firm size show that the corporate governance practices of large firms have a greater impact on the cost of debt capital than they have for small firms for the sample period. This result may be inconsistent with prior expectations. In general, large Korean firm characteristics, such as ownership struc-ture, analyst following, financial market access, and level of information asymmetry, are better than those of small firms. Thus, small firms would need more strict corpo-rate governance systems than those of large firms to reduce agency problems and the cost of external financing. Furthermore, the impact of corporate governance systems on the cost of capital for large firms would be less than smaller firms because costly corporate governance systems present fewer benefits to large firms. However, this is not the case. The result shows that large firms are required to have more sound cor-porate governance systems than small firms. It is interpreted that large firms may have more debt outstanding held by bondholders who require more credit protection. However, large firms that used to be affiliated with the chaebol groups are, in general, more complex in nature and are hard to be monitored by outside bondholders. In fact, numerous bondholders are free-riders because they are dispersed with little or no incentive to monitor large firms. Without sound corporate governance systems, there is no way for bondholders to monitor large firms when the management of large firms makes a risky investment decision. Therefore, sound corporate governance system of large firms seems to have a large impact on the cost of debt capital. In addition, forci-ble reform of large firms by the government also has produced practical and substan-tial effects in the level difference of corporate governance between large and small firms.
5. Additional Analyses
5.1 Regression Results of the Cost of Debt Capital on Corporate
Governance Categories
In this section, the relation between the five categories of corporate governance and the cost of debt capital is investigated. The survey construction for 2001~2002 is re-constructed into five categories in accordance with the survey construction for 2003~ 2004. OLS regression of the cost of debt capital is performed for one year, two years, and three years.22) In untabulated yearly regressions, dividend policies (FAC5) are
the most frequently significant category, followed by audit committee (FAC4).
Table 6 reports the summary results of the corporate governance overall score and five categories for two years and for three years. In the two-year and three-year re-gressions, FAC5 is still the most significant category among the five corporate gov-ernance practices, followed by FAC1 (shareholder rights protection). Model (1) shows that FAC1 (coefficient = -0.892, t = -2.37) and FAC5 (coefficient = -1.658, t = -7.25) are important categories for a lower industry-adjusted leverage ratio according to the two-year and three-year regression results, respectively. Model (2) shows that FAC4 (coefficient = -0.228, t = -3.52 for two-year regression) and FAC5 (coefficient = -0.168, t = -3.08 for two-year regression, and coefficient = -0.203, t = -4.84 for three-year re-gression) are significant for lower interest rates of firms.23) Both book-based measures
are negatively associated with FAC5, consistent with the argument of Park et al. (2005) that signaling by increasing dividends may lead lower cost of capital in the long run. That means paying dividends provide a good signal of future earnings to debtholders, thereby decreasing the information asymmetry and perceived default risk (Ross, 1978; Bhattacharya, 1979; Miller and Rock, 1985). In addition, paying dividends can force firms with high growth opportunities to the external capital mar-kets, in which they are subject to additional monitoring (Easterbrook, 1984). Divi-dends can also reduce management’s opportunity to invest the firm’s free cash flow in
22) For the 2001 period, the data set was classified into four categories because FAC3 and FAC5 were not separable. Thus, only a yearly regression was run for 2001.
23) Further, it is examined whether dividend policies element effect differs systematically between firms with large cash flow and firms with small cash flow. The result is robust.
Table 6. Regression results of the costs of debt capital on corporate governance categories (1) ADJ_LEV1 INT_RATE (2) 2003~2004 2002~2004 2003~2004 2002~2004 CGSCORE -0.340 (-2.87) *** -0.264 (-3.38) *** -0.012 (-0.72) (-3.73)-0.057 *** FAC1 -0.892 (-2.37) ** -0.333 (-1.51) (0.75)0.028 (-0.05)-0.001 FAC2 -0.139 (-0.27) (0.22)0.033 (3.37)0.105 *** 0.007 (0.22) FAC3 -0.954 (-1.53) (-1.05)-0.256 (-0.68)-0.033 (-1.17)-0.044 FAC4 0.629 (1.18) (1.63)0.465 (-3.52)-0.228 *** -0.029 (-0.53) FAC5 -1.310 (-1.14) (-7.25)-1.658 *** -0.168 (-3.08) *** -0.203 (-4.84) *** Adj_R2 0.2701/ 0.2717 0.2424/0.2791 0.1298/0.1732 0.1267/0.1490 F-test† 8.29*** 15.49*** 6.23*** 2.05* Wald-test†† 5.74 65.66*** 3.65 40.51*** N of Obs. 729 1,207 664 1,118 (3) WRATING WSPREAD(4) 2003~2004 2002~2004 2003~2004 2002~2004 CGSCORE -5.194 (-2.96) *** -3.999 (-2.98) *** -0.013 (-1.51) (-1.27)-0.018 FAC1 -6.336 (-1.33) (-0.45)-1.808 (-1.84)-0.047 * 0.0003 (0.01) FAC2 -11.914 (-2.40) ** -3.651 (-1.07) (0.75)0.019 (0.27)0.011 FAC3 -4.227 (-0.46) (-1.91)-8.010 * -0.071 (-1.28) (-1.42)-0.077 FAC4 8.129 (1.24) (0.37)1.980 (-0.84)-0.029 (-1.16)-0.072 FAC5 -3.629 (-0.31) (-1.47)-7.732 (1.27)0.066 (0.61)0.042 Adj_R2 0.6611/ 0.6608 0.6185/0.6162 0.4934/0.4967 0.1621/0.1564 F-test† 2.28* 2.05* 0.75 1.32 Wald-test†† 4.44 2.87 5.80 2.66 N of Obs. 150 252 145 239
Table 6 shows the summary of the two-year and three-year regressions for models (1) through (4). See Table 2, Table4, and Table 5 for the variable and model definitions. The t-statistics are reported in parentheses. ***, **, and * denote the significance of the parameter estimated at the 0.01, 0.05, and
0.10 levels, respectively, based on the heteroscedasticity-consistent covariance matrix following White (1980). † The F-statistics for the F-test (FAC1 = FAC2 = FAC3 = FAC4 = FAC5=0) are
re-ported. The F-test examines the significance of any additional explanatory power that corporate governance categories collectively add to the model. †† The F-statistics for the Wald-test show