Technische Universität München
KfW Stiftungslehrstuhl für Entrepreneurial Finance Univ.-Prof. Dr. Dr. Ann-Kristin Achleitner
Structure and determinants of financial covenants
in leveraged buyouts
Florian T. Tappeiner
Vollständiger Abdruck der von der Fakultät für Wirtschaftswissenschaften der Technischen Universität München zur Erlangung des akademischen Grades eines
Doktors der Wirtschaftswissenschaften (Dr. rer. pol.) genehmigten Dissertation.
Vorsitzender: Univ.-Prof. Dr. M. Moog
Prüfer der Dissertation: 1. Univ.-Prof. Dr. Dr. A.-K. Achleitner 2. Univ.-Prof. Dr. G. Friedl
Die Dissertation wurde am 30.09.2010 bei der Technischen Universität München ein-gereicht und durch die Fakultät für Wirtschaftswissenschaften am 15.12.2010 ange-nommen.
TABLE OF CONTENTS
1 INTRODUCTION ... 1
1.1 Relevance and Objectives ... 1
1.2 Structure of Analysis ... 5
2 CHARACTERISTICS OF LEVERAGED BUYOUTS ... 8
2.1 Introductory Remarks ... 8
2.2 Private Equity and Leveraged Buyouts ... 8
2.3 Capital Structure ... 9 2.3.1 Theoretical Considerations ... 11 2.3.2 Empirical Description ... 14 2.3.3 Equity Parties ... 18 2.3.4 Debt Parties ... 23 2.4 Research Model ... 25 3 THEORETICAL FRAMEWORK ... 27 3.1 Introductory Remarks ... 27
3.2 The Conflict View - Agency Theory ... 27
3.2.1 Agency Conflict between Debt and Equity Holders ... 27
3.2.1.1 Asset Substitution ... 30
3.2.1.2 Underinvestment ... 34
3.2.1.3 Claim Dilution ... 36
3.2.2 Agency Costs of Debt ... 36
3.2.3 Agency Theory of Covenants ... 37
3.3 The Control View – Financial Contracting Theory ... 40
3.3.1 Contractual Incompleteness ... 40
3.3.2 The Aghion-Bolton Model ... 42
3.3.3 The Rajan-Winton Model ... 55
3.3.4 Additional Functions of Financial Covenants ... 60
3.3.5 Excursus: Signaling Theory of Financial Covenants ... 60
3.4 Summary ... 62
4.1 Introductory Remarks ... 64
4.2 The Conflict View – Action-restricting Covenants ... 64
4.2.1 Covenants limiting Asset Substitution ... 65
4.2.2 Covenants limiting Underinvestment ... 66
4.2.3 Covenants limiting Claim Dilution ... 68
4.3 The Control View – Financial Covenants ... 69
4.3.1 Types of Financial Covenants ... 70
4.3.2 Construction ... 73
4.3.3 Measure of Restrictiveness ... 78
4.3.4 Effectiveness of Financial Covenants ... 81
4.4 Covenants in Leveraged Buyouts ... 82
4.5 Summary ... 86 5 HYPOTHESES ... 91 5.1 Introductory Remarks ... 91 5.2 Literature Review ... 91 5.3 Hypotheses Development ... 97 5.3.1 Target related ... 98 5.3.1.1 Firm Size ... 98 5.3.1.2 Growth ... 100 5.3.1.3 Profitability ... 102 5.3.1.4 Firm Risk ... 102 5.3.1.5 Tangibility ... 103 5.3.2 Transaction related ... 104 5.3.2.1 Leverage ... 104 5.3.2.2 Interest Costs ... 105 5.3.2.3 Maturity ... 106
5.3.2.4 Share of Bank Debt ... 107
5.3.2.5 Creditor Rights Dilution ... 108
5.3.3 Sponsor related ... 108
5.3.3.1 Sponsor Reputation ... 108
5.3.3.2 Banking Relationship ... 110
5.3.4 Lead Arranger related ... 113
5.3.4.1 Organization ... 113
5.3.4.2 Final Hold ... 113
5.4 Summary ... 117 6 EMPIRICAL STUDY ... 119 6.1 Introductory Remarks ... 119 6.2 Datasets ... 119 6.2.1 LBO Sample ... 119 6.2.2 Benchmark Sample ... 131
6.3 Financial Covenants in Sponsored versus Non-sponsored Loans ... 133
6.3.1 Types and Combinations of Financial Covenants ... 133
6.3.2 Financial Covenant Thresholds ... 141
6.4 Descriptive Statistics ... 144
6.4.1 Covenant Restrictiveness ... 144
6.4.2 Financial Covenant Pecking Order ... 149
6.4.3 Explanatory Variables ... 152
6.4.3.1 Target related ... 152
6.4.3.2 Transaction related ... 155
6.4.3.3 Sponsor related ... 158
6.4.3.4 Lead Arranger related ... 162
6.4.3.5 Macroeconomic related ... 163
6.5 Determinants of Financial Covenant Restrictiveness ... 163
6.5.1 Difference in Means ... 163
6.5.2 Multiple Regression Analysis ... 165
6.5.2.1 Target related ... 169
6.5.2.2 Transaction related ... 171
6.5.2.3 Sponsor related ... 173
6.5.2.4 Lead Arranger related ... 175
6.5.2.5 Macroeconomic related ... 175
6.5.3 Robustness ... 175
6.5.3.1 Fixed Effects ... 175
6.5.3.2 EBITDA Definition ... 176
6.5.3.3 Endogeneity of Headroom and Creditor Rights Dilution177 6.5.3.4 Endogeneity of Leverage and Financial Covenants ... 180
6.5.3.5 Accounting Manipulation ... 181
6.5.3.6 Analysis on Pecking Order of Financial Covenants ... 182
6.6 Summary of Hypotheses Testing ... 186
7 CONCLUSION ... 191
7.1 Summary of Results ... 191
7.2 Implications for Research ... 196
LIST OF FIGURES
Figure 1: Structure of analysis ... 7
Figure 2: Classification of private equity and buyouts ... 9
Figure 3: Involved parties in a typical LBO ... 10
Figure 4: Role of private equity groups ... 21
Figure 5: Principal agent relationships in LBOs ... 26
Figure 6: Neoclassical cost of capital with risky debt ... 28
Figure 7: Payoff characteristics of equity and debt claims ... 31
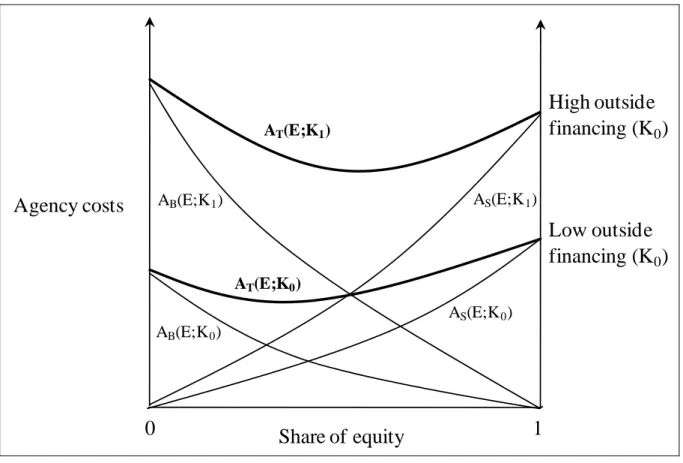
Figure 8: Agency cost functions for different levels of outside financing ... 34
Figure 9: Technological characteristics of project timeline ... 43
Figure 10: Overview of different signals obtained by the investor ... 56
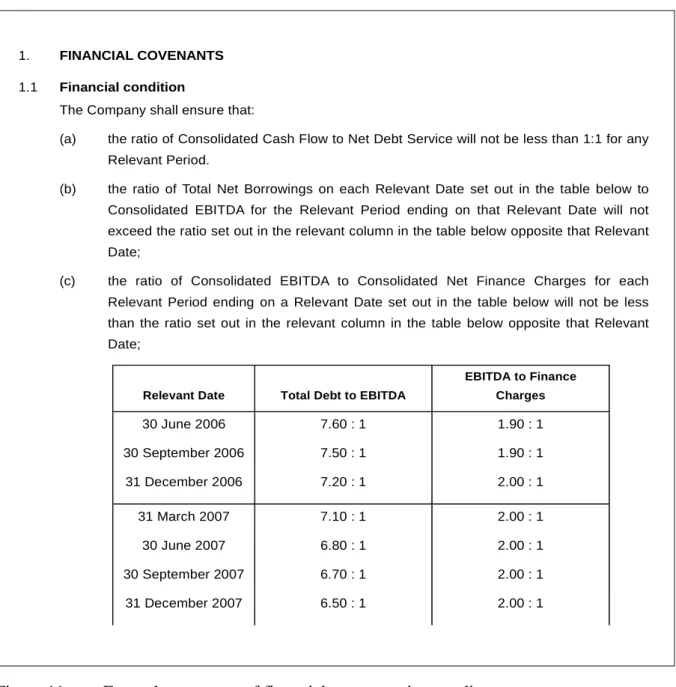
Figure 11: Exemplary excerpt of financial covenants in a credit agreement ... 74
Figure 12: Conceptional covenant construction ... 76
Figure 13: Systematization of covenants in credit agreements ... 87
Figure 14: Covenants in public, private, corporate and LBO debt ... 89
Figure 15: Determinant categories of financial covenant restrictiveness ... 98
LIST OF TABLES
Table 1: Typical LBO financing structure and characteristics ... 15
Table 2: Types of financial covenants in private credit agreements ... 72
Table 3: Financial covenants in a credit agreement ... 77
Table 4: Literature overview I/II ... 93
Table 5: Literature overview II/II ... 94
Table 6: Hypotheses on the restrictiveness of financial covenants ... 118
Table 7: Sample coverage and benchmarking ... 123
Table 8: Size, pricing and capital structure of the sample over time ... 126
Table 9: Terms of the debt tranches I/II ... 129
Table 10: Terms of the debt tranches II/II ... 130
Table 11: Characteristics of sponsored and non-sponsored loans ... 133
Table 12: Covenants in sponsored and non-sponsored loans (term loans) I/II .... 135
Table 13: Covenants in sponsored and non-sponsored loans (term loans) II/II .. 136
Table 14: Conditional probabilities of covenant inclusion ... 137
Table 15: Covenant combinations in sponsored and non-sponsored loans ... 138
Table 16: Covenants in sponsored and non-sponsored loans (matched term loans) ... 140
Table 17: Covenant thresholds of sponsored and non-sponsored loans I/II ... 142
Table 18: Covenant thresholds of sponsored and non-sponsored loans II/II ... 143
Table 19: Covenant thresholds over time ... 147
Table 20: Covenant headrooms over time ... 148
Table 20: Headroom comparison of the typical LBO covenants ... 151
Table 21: Descriptive statistics for target related variables ... 154
Table 22: Descriptive statistics for transaction related variables ... 156
Table 23: Composition of the creditor rights dilution index over time ... 158
Table 24: Descriptive statistics for sponsor related variables ... 159
Table 26: Descriptive statistics for macroeconomic related variables ... 163
Table 27: Mean comparison test of D/EBITDA covenant restrictiveness ... 165
Table 28: Determinants of D/EBITDA headroom I/II ... 167
Table 29: Determinants of the D/EBITDA headroom II/II ... 168
Table 30: Endogeneity of D/EBITDA headroom and creditor rights dilution .... 179
Table 31: Determinants of the CashFlowCoverage headroom ... 185
Table 32: Summary of hypothesis testing ... 187
Table 33: Beta coefficients of regressions on the determinants of D/EBITDA headroom ... 201
LIST OF ABBREVIATIONS
ATC Agency theory of covenants
bps Basis points
BVK Bundesverband Deutscher
Kapitalbeteiligungsge-sellschaften
CAPM Capital asset pricing model
Capex Capital expenditures
CDO Collateralized debt obligation
Cf. Confer
CLO Collateralized loan obligation
CMBOR Centre for Management Buy-Out Research
E Equity
EBITDA Earnings before interest, tax, depreciation, and
amortization
EURIBOR European Interbank Offered Rate
EV Enterprise value
FISD Fixed Investment Securities Database
FCF Free cash flow
GHM Grossman-Hart-Moore approach
GP General partner
HLT Highly leveraged transaction
HR Headroom I Interest
IFRS International Financial Reporting Standards
IPO Initial public offering
KKR Kohlberg Kravis & Roberts
LMA Loan Market Association
LP Limited partner
LPC Loan Pricing Corporation
M&A Mergers & acquisitions
MBO Management buyout
Newco New company
NPV Net present value
P2P Public-to-private
PE Private equity
PEF Private equity funds
PE group Private equity group
PIK Payment-in-kind PIPE Private-investments-in-public-equity
S&P Standard & Poors
SIC Standard industry classification
TLa Term loan A
TLb Term loan B
TVE Thomson Venture Economics
US United States (of America)
US-GAAP United States Generally Accepted Accounting
Principles
VC Venture capital
1 Introduction
1.1 Relevance and Objectives
In his seminal paper ‘The eclipse of the public corporation’, JENSEN (1989) foresaw that private equity owned businesses would become the dominant organizational form in the business world. His conclusion was based on superior corporate governance of private equity backed firms as opposed to public corporations. Particularly, he argued, leveraged buyouts (LBOs) impose a more efficient capital structure, better incentivize management and concentrate ownership with active investors. This prediction did not fulfill in the near future as the LBO market slowed down considerably during the early 1990s. KAPLAN (1997) concluded that public corporations adopted the typical private equity governance mechanisms such as more efficient capital structures, more active ownership and improved incentive structures, compensating the competitive disad-vantages of corporate governance structures in the 1980s.
However, the private equity industry has again grown tremendously in the past decade, in terms of value, number of transactions, and its geographic reach. STRÖMBERG (2008) estimates the total aggregated global value of firms acquired by private equity since 1970 at $3.6 trillion, of which the substantial part ($2.7 trillion) was transacted in the period from 2001 to 2007.1 It is estimated that private equity deals constituted 20% of the global mergers & acquisition (M&A) market in 2006, up from 3% in 2000.2 Pri-vate equity expanded from a US phenomenon to a global organizational form. The European private equity market even grew larger than its US counterpart: The relative European global market share in terms of number increased from 38.8% in the period 1970 to 2000 to 49.9% in the period 2001 to 2007.3 In 2008 the credit crisis evaporated the debt financing for LBOs globally and slowed down the fund raising of private eq-uity groups (PE groups). Still, private eqeq-uity groups had around $1.0 trillion in 2009 to
1 Cf. Strömberg (2008), p. 4. 2 Cf. Axelson, et al. (2010), p. 1. 3 Cf. Strömberg (2008), p. 16.
invest during the next years indicating the persistent economic importance of private equity.4
Given the relevance of the private equity industry, it is essential to understand the eco-nomic dynamics in private equity transactions. Academic discussion particularly ad-dresses two fundamental questions in this area.
First, in comparison to peer companies, do private equity investors create value for their portfolio companies? Current academic research suggests that private equity cre-ates superior performance on company level; however, after accounting for related fees and carried interest, fund level performance is reduced to or to below capital mar-ket returns.5
Second, what measures do private equity firms apply to create value in their portfolio companies? Research shows that private equity firms apply governance (I), operational (II), and financial (III) engineering to their portfolio companies, creating economic value.6 In terms of governance mechanisms (I), private equity brings in new manage-ment members, creates stronger incentives for managemanage-ment, and monitors the buyout company actively and efficiently.7 In terms of operational engineering (II), private eq-uity investors increase productivity per employee, reduce capital expenditures improve the innovation process, however the effect on employment remains ambiguous and evidence is heterogeneous.8 In terms of financial engineering (III), private equity in-vestors, being corporate finance experts, structure LBOs in a way that maximizes
4
Cf. Prequin press release 30th July 2009, see
http://www.preqin.com/docs/press/PE%20returns%20down,%20dry%20powder%20high,%20comp limentary%20benchmarks%20launched.pdf
5
For deal level analysis see for example Ljungqvist/Richardson (2003), Nikoskelainen/Wright (2005), Guo/Hotchkiss/Song (2010), Acharya/Hahn/Kehoe (2010), Achleitner, et al. (2010). For fund level analysis see Kaplan/Schoar (2005), Gottschalg/Phalippou (2009), Diller/Kaserer (2009), Driessen/Phalippou/Tse-Chun (2009).
6
Cf. Kaplan/Strömberg (2009), p10f.
7
See for example Gertner/Kaplan (1996), Nikoskelainen/Wright (2005), Acharya/Hahn/Kehoe (2010).
8
See for example Lerner/Sorensen/Strömberg (2008), Steven, et al. (2009), Acharya/Hahn/Kehoe (2010), and Lutz/Achleitner (2009) for a survey on private equity and employment.
shareholder wealth and reduces financing costs.9 However, academic research regard-ing the capital structure of LBOs is still premature and the existregard-ing studies primarily focus on leverage and interest costs. Certain important elements of corporate finance such as the characteristics of debt contracts have been largely disregarded in academia. Private equity groups finance LBOs with a mixture of equity and debt. The equity component is primarily provided by funds managed by the private equity group. The debt component is typically provided in the form of a syndicated loan that is provided by banks and institutional investors to an acquisition vehicle that is ‘sponsored’ by the PE group. These syndicated loans contain financial covenants that require the borrow-er – in this context the buyout company – to maintain a threshold level of cborrow-ertain fi-nancial ratios. For example, a typical fifi-nancial covenant, particularly used in LBOs, is a covenant limiting the maximum ratio of the debt to earnings before interest, tax, de-preciation, and amortization (D/EBITDA). Each quarter the bank compares the real-ized D/EBITDA ratio with the allowable D/EBITDA threshold. If the buyout company fails to maintain the D/EBITDA threshold, the loan is in technical default providing the creditor with the option to terminate the loan. However, in most cases of covenant violation the creditor does not call the loan but renegotiates the contract terms result-ing in potential limitations of capital expenditures, higher interest costs, waiver fees or more restrictive covenants.10 Hence, financial covenants are an integral element of the credit agreement and their restrictiveness is of considerable value for lenders.
The LBO boom from 2005 to mid 2007, with its increased LBO activity and elevated debt levels11, in combination with the subsequent 2008/09 severe recession, endan-gered many buyout firms to violate their financial covenants and face technical de-fault. Not surprisingly, financial covenants in LBOs received increasing attention in
9
See for example Jensen (1986), Axelson, et al. (2010), Demiroglu/James (2010b), Ivashina/Kovner (2010).
10
See for example Chen/Wei (1993), Sweeney (1994), Beneish/Press (1995), Dichev/Skinner (2002), Chava/Roberts (2008).
11
the media during this period.12 PricewaterhouseCoopers (2010) reports that 75% of the private equity respondents in their survey had to deal with financial covenant breaches of their portfolio companies or were otherwise required to enter renegotiations with financing banks in 2009.13
Interestingly, little is still known about the determinants of restrictiveness of financial covenants in LBOs. The research setting in LBOs seems particularly interesting: First, LBOs concentrate ownership and control creating an interesting setting for capital structure decisions which are less distorted by agency conflicts between managers and owners as the capital structure is negotiation between the private equity group and the bank with little involvement of management.14 Second, the negotiations about the capital structure in LBOs without already existing equity or debt holders and their as-sociated claims provides a clear view on the influence of shareholders and debt holders on financial covenants. Third, LBOs constitute a setting with intense conflicts of inter-est between equity and debt holders given the significant amount of leverage in these transactions and the incentive structure for private equity managers.
Insights from LBO structures might be important for broader corporate finance re-search as buyouts are executed by knowledgeable professionals, i.e. the private equity group professionals, who utilize sophisticated financial structures to maximize share-holder wealth.15 However, the scarce data availability16and the limited quality of da-ta17 – even in the United States – have been impeding academic research on financial covenants in LBOs. This thesis aims to reduce this gap in the body of knowledge, an-swering the following two primary research questions:
12
For instance see the NY Times article ‘Analysts will be watching loan covenants in 2009’, by Na-talie Harrison and Jane Baird, November 302008.
13
See http://www.pwc.de/fileserver/RepositoryItem/Pr_Equity_Trend_Report_2010.pdf?itemId= 13602751 Last visited on 30th of September 2010.
14
Additionally, managers typically own part of the business reducing potential conflicts of interest.
15
Cf. Axelson, et al. (2010), p. 1.
16
As already noted by Gretchen Morgenson, ‘Why the Secrecy About Financial Covenants?’ NY Times, October 12, 2003.
17
Cf. Demiroglu/James (2010b) obtains only the number of financial covenants and Ivashina/Kovner (2010) limit their analysis on the covenant threshold.
How does the covenant menu in terms of individual covenant types and combinations differ in sponsored compared to non-sponsored loans?
What are the determinants of financial covenant restrictiveness in LBOs? The first question will be addressed mainly in an empirical manner, comparing a pro-prietary dataset of LBOs with datasets of traditional corporate loans. In order to an-swer the second question, theoretical arguments are combined with existing empirical findings on covenants to formulate hypotheses. These hypotheses will then be tested in an empirical analysis using the proprietary dataset of LBOs.
1.2 Structure of Analysis
This dissertation contains seven chapters. The structure and contents of the chapters are illustrated in Figure 1. After giving an introduction to the research questions in Chapter 1, the thesis presents essential characteristics of leveraged buyouts (LBOs) in Chapter 2. Following the introductory remarks in Chapter 2.1, Chapter 2.2 classifies LBOs in the broader category of private equity. Chapter2.3 introduces the characteris-tics of the LBO capital structure, i.e. explains theoretical differences between LBOs and public companies, describes the typical capital structure and lays out the roles of the involved parties. Chapter2.4 reduces the complex LBO structure to a simple mod-el of equity and debt holders that serves as the basis for the theoretical framework. Chapter 3 builds the theoretical framework that provides the economic rationale for the utilization of covenants in credit agreements. Chapter 3.1 explains the dichoto-mous concept, conflict and control view, of the following theoretical framework. Chapter 3.2 explains the agency conflict between debt and equity holders (conflict view) leading to agency costs that in turn might be reduced by writing action-restricting covenants in credit agreements. Chapter 3.3 extends the conflict view using financial contracting theory (control view) to explain the economic rationale for finan-cial covenants. Chapter3.4 gives a summary of the theoretical framework.
The dichotomous theoretical framework is then used in chapter4 to explain and classi-fy different types of action-restricting and financial covenants, also describing the cov-enant setting in LBOs. Chapter 4.1 conceptualizes the analysis of the different types of
covenants. Chapter4.2 defines and classifies action-restricting covenants according to their theoretically motivated conflict between equity and debt holders (conflict view). Chapter 4.3 gives an overview of types of financial covenants, explains how financial covenants are constructed and how to measure their restrictiveness, as well as discuss-es the effectivendiscuss-ess of financial covenants. Chapter 4.4 investigates the setting of fi-nancial covenants in LBOs, i.e. sponsored loans, as opposed to public debt and non-sponsored loans. Chapter4.5 summarizes the findings of this chapter.
Chapter 5 formulates hypothesis on the relationships between potential determinants and the restrictiveness of financial covenants. After Chapter 5.1 gives an overview of the conceptual structure, Chapter 5.2 presents the existing streams of covenant litera-ture and classifies the most important studies. Chapter 5.3 uses theoretical arguments and empirical findings to derive hypotheses on potential determinants of financial cov-enant restrictiveness in leveraged buyouts. Chapter5.4 summarizes the hypotheses. Chapter 6 presents the empirical evidence of the study. Chapter 6.1 gives an overview of the following empirical analysis. Chapter 6.2 describes the LBO dataset and the benchmark sample. Chapter 6.3 compares the financial covenants used in LBO loans, i.e. sponsored loans, to financial covenants in traditional corporate loans, i.e. non-sponsored loans. Chapter 6.4 presents descriptive statistics for financial covenants, gives empirical evidence on a hierarchy of financial covenants and describes the char-acteristics of explanatory variables. Chapter 6.5 uses univariate and regression analy-sis to empirically test the hypotheses and checks the results for robustness. Chapter 6.6 summarizes the results of the hypotheses testing. Chapter 6.7 further tests the pecking order argument using multiple regression analysis. Chapter 6.8 discusses some limita-tions of the analysis.
Chapter 7 concludes by summing up the results (chapter 7.1) and giving implications for research (chapter 7.2) and practice (chapter 7.3).
Figure 1: Structure of analysis
Source: Author
1. INTRODUCTION
2. CHARACTERISTICS OFLEVERAGEDBUYOUTS
3. THEORETICALFRAMEWORK
5. HYPOTHESES
6. EMPIRICALSTUDY
7. CONCLUSION
Releva nce and Objectives Structure of Ana lysis
Priva te Equity a nd Leveraged Buyouts
The Conflict View – Agency Theory The Control View – Fina ncia l Contra cting
Litera ture Review Hypotheses Development
Fina ncia l Covena nts in Sponsored a nd Non-sponsored Loa ns
Determina nts of Fina ncia l Covena nt Restrictiveness
Da ta sets
Summa ry of Hypotheses Testing
4. CLASSIFICATION AND TYPES OF COVENANTS
The Conflict View – Action-restricting Covena nts
The Control View – Fina ncia l Covena nts
Descriptive Sta tistics
Capita l Structure Research Model
Covena nts in Levera ged Buyouts
Limita tions of the Ana lysis
2 Characteristics of Leveraged Buyouts 2.1 Introductory Remarks
The following sections present the characteristics of leveraged buyouts (LBOs). The first section classifies LBOs in the broader category of private equity (PE). The second section introduces some theoretical considerations why the capital structure in LBOs should be different from public companies. The third section lays out the structure of LBOs, i.e. explains the capital structure and the associated equity and debt parties. Fourth, the complex LBO structure is reduced to a simple institutional model including two parties – equity holders and debt holders –, which is used to explain the economic foundations of covenants.
2.2 Private Equity and Leveraged Buyouts
KASERER et al. (2007) define private equity in the broader sense as equity invest-ments in private companies – in contrast to investinvest-ments in public companies.18 Private equity in the broader sense can then be classified (see Figure 2) into equity invest-ments in early stage companies (‘venture capital’) and later stage companies, i.e. es-tablished, mature companies (‘private equity in the narrower sense’). Later stage in-vestments comprise minority inin-vestments and majority inin-vestments, referring to the share of common equity.19
Generally, one or more private equity groups (PE groups) in the narrower sense target the majority of common equity to gain control over the established business. In this context a buyout is defined as the acquisition of a controlling stake of funds managed by a PE group in an established company from its owners for a limited time, financed through a combination of equity and debt.20
18
Cf. Kaserer, et al. (2007), p. 14.
19
Cf. Kaserer, et al. (2007), p. 15. For an exploratory study on minority investments see Achleit-ner/Schraml/Tappeiner (2008).
20
Buyouts can be categorized according to the reason for the sale (like succession buy-out, going private buyout etc.) or to the type of acquirer (management buybuy-out, institu-tional buyout etc.).21 However, whenever a large amount of debt is utilized – although the exact level of debt is not defined – to finance the acquisition of the target company the buyout is labeled ‘leveraged buyout’.22
Figure 2: Classification of private equity and buyouts
Source: KASERER et al. (2007), p. 14
This thesis follows the classifications and definitions just outlined, but also includes investments in public equity, i.e. public-to-private (P2P) transactions and private-investments-in-public-equity (PIPE). This definition is in line with the one formulated by KAPLAN/STRÖMBERG (2009).23
2.3 Capital Structure
In a typical leveraged buyout (LBO) a private equity group (PE group) will form a new company (‘newco’) specifically for the purpose to acquire a controlling stake in the target company (for a graphical illustration of the LBO structure see Figure 3).
21
For a detailed categorization of buyouts see Klöckner (2009), p. 25 or Geidner (2009), p. 7f.
22
Cf. Kaserer, et al. (2007), p. 15.
23
This definition is also in line with the private equity definition in the report ‚The Global Economic Impact of Private Equity Report 2008’, which was compiled for the World Economic Forum 2008. Cf. Lerner/Gurung (2008), Executive Summary, p. vii.
Private Equity in the Broader Sense
Venture Capital
i.e. Investments in Early Stage Companies
Private Equity in the Narrower Sense i.e. Investments in Established Companies
Minority Investments Majority Investments i.e. Buyouts
Figure 3: Involved parties in a typical LBO
Source: Author
The newco is credible because it is ‘sponsored’ by one or more PE groups that interact frequently with capital markets. To finance the acquisition, this newco is funded with equity and debt. The main equity component is typically provided by a fund, managed by a PE group.24 However, usually the buyout management contributes to the equity as well and sometimes the vendor provides funds, too.
24
Note that this constitutes the simple case. A leveraged buyout may include several funds from one PEG or even more PEGs.
Private Equity Fund(s) Management Equity Instruments (20-40%) Syndicate Participants Institutional Investors Vendor Debt Instruments (60-80%) Lead Arranger Final Hold Newco Capital Structure
Private Equity Group sets up equity fina ncing a nd sponsors newco
Lead Arranging Bank commits to debt pa cka ge ne go tia te Capital Providers Intermediaries
Besides the equity component, debt financing is essential to LBOs. Private equity groups primarily utilize debt financing to increase the expected return on equity, i.e. to create a leverage effect.25 In order to obtain debt financing for the capitalization of the newco, the PE group presents the potential buyout to banks. If the bank commits to fund the newco with debt, it becomes the lead arranger of the transaction. In case the transaction is unsuccessful, the newco is unwound and the debt component lapses. The lead arranger typically does not provide the entire debt financing but syndicates parts of the debt to other, so called participating, banks or institutional investors.26 Typical institutional investors are collateralized debt obligation (CDO) funds, hedge funds, mutual funds and insurance companies.27 The following sections explain the capital structure in more detail and present the role of the involved parties with a pri-mary focus on the intermediaries in Figure 3, i.e. the PE group and the lead arranger.
2.3.1 Theoretical Considerations
Before going into the empirical details of observed capital structures in LBOs, it is essential to explain basic theoretic considerations on the capital structure in LBOs. As there is a comprehensive literature on the capital structure of public firms, it is crucial to explain arguments why the capital structure in LBOs, including the utilization of covenants, should be any different from public firms.28
AXELSON/STRÖMBERG/WEISBACH (2009) base their capital structure theory of LBOs on the conflict of interest between the General Partners (GPs), i.e. fund manag-ers, and Limited Partners (LPs), i.e. fund investors.29 Their model evaluates the capital structure of LBOs. They consider the combination of two sources: ex ante financing defined as the funds provided by LPs at the beginning of the fund and ex post
25
For a fundamental description of the leverage effect see Modigliani/Miller (1958).
26
This overview is an aggregation of Schell (2006), §1.04, Axelson, et al. (2010), p. 7f., Kaplan/ Strömberg (2009), p. 124f.
27
For a good survey on institutional investors in the leveraged loan market see Ivashina/Sun (2009).
28
Cf. Axelson, et al. (2010) p. 10-14 for an overview.
29
The description for GP and LP is simplified in this section to avoid distraction. For further details on the role of GPs and LPs see section 2.3.3.
ing, provided in the form of debt for respective LBOs.30 The optimal capital structure is defined as the capital structure that maximizes the value of aggregated investments by minimizing the value of negative net present value (NPV) investments while reduc-ing ignored good investments. Their model shows that it is optimal to use a mix of ex ante and ex post financing. The share of the ex ante capital in the transaction (the equi-ty component) preserves the GP’s incentives to avoid bad deals in good times31 and the ex post component (debt) prevents the GP to undertake bad investments in bad times.32 However, at a more general level, the incentive structure of private equity funds pro-vides the GP with an option-like stake in the fund, which induces them to lever each deal as much as possible. In this context, leverage also increases the pricing of LBOs as the pricing is set by the GP who also determines leverage. In public markets, even if the manager of a public firm has similar incentives to lever the firm, the price is set by independent investors.33
Additionally, AXELSON et al. (2010) argue that bankruptcy costs are lower for pri-vate equity backed companies than for public companies. They name two reasons for this hypothesis. First, if an LBO is in financial distress the sponsor can inject equity from its funds into the company whereas public companies have to issue new poten-tially dilutive equity (see also section 4.3.4).34 The second argument leads back to the long-term relationship between the PE group and the bank or the debt market. This relationship should facilitate any renegotiation, which in turn reduces distress costs.35 Reduced distress costs should consequently lead to potentially higher optimal lever-age.36
30
Cf. Axelson/Strömberg/Weisbach (2009), p. 1553.
31
The rationale behind this effect is that the compensation of the GP depends upon the performance of the entire fund and not single investments. Since bad deals will contaminate his stake in good deals the GP has less of incentives to invest in bad deals. Cf. Axelson/Strömberg/Weisbach (2009), p. 1551. 32 Cf. Axelson/Strömberg/Weisbach (2009), p. 1551. 33 Cf. Axelson, et al. (2010), p. 14. 34 Cf. Axelson, et al. (2010), p. 11. 35 Cf. Gertner/Scharfstein (1991). 36 Cf. Axelson, et al. (2010), p. 11.
Another argument for differences in the optimal capital structure for LBO firms and public companies is the value of the tax shield. In public firms the total tax effect in-cludes corporate tax rates as well as personal tax rates.37 Since the personal tax rates of the shareholders are unobservable for the firm, MILLER (1977) concludes that it is difficult to apply the tradeoff theory of MYERS (1984), in which the capital structure is chosen where marginal tax advantages and marginal bankruptcy costs are identical. By contrast, since the typical investors in private equity funds, e.g. pension funds, are tax-exempt, the tax shield effect should be more observable in LBOs.38
Additionally, LIU (2009) looks at the conflict of interest between PE groups and man-agers in private equity-backed companies. His model shows that a capital structure including long-term debt is a mechanism to reduce agency problems.39 The different capital structure of public firms and LBOs can be explained by different time horizons and concentrated ownership. First, the PE group has full control rights on the capital structure, whereas public firm shareholders face many constraints in making capital structure decisions. Second, in contrast to the public firm, the finite ownership of pri-vate equity does not allow a repeated game or long-term relationship with manage-ment.40
Finally, COTTER/PECK (2001) argue that private equity groups play an important role in the governance of the post-LBO firm. Private equity owned businesses benefit from the consequent monitoring and from the financial expertise of the GP. This con-stellation equips the buyout company with a higher debt capacity.
Overall, these theories predict that leverage in private equity backed companies is higher than in public companies. The study of AXELSON et al. (2010) provides first comprehensive empirical evidence confirming this notion.
37
Cf. Miller (1977), p. 267.
38
For a more detailed description see Axelson, et al. (2010), p. 10-11.
39
In his model, agency problems cannot be solved by compensation. Cf. Liu (2009), p.4.
40
2.3.2 Empirical Description
Having explained the theoretical deviations between capital structures in public firms and LBOs, this section describes the typically observed detailed capital structure in LBOs, starting with the equity component followed by the debt part. Private Equity Groups structure LBOs using a wide variety of financial instruments that range across several levels of seniority from common equity to senior debt. Table 1 presents the detailed funding structure of a typical LBO. Additionally, Table 1 attributes the most important characteristics for the utilized financing instruments, specifies the usual lender base and gives a practical example. In general, LBOs are financed with equity sourced by the PE group (20-40% of capital) and several senior and subordinated debt tranches, typically provided in the form of syndicated loans underwritten by lead ar-ranging banks (60-80%).41
The equity component in LBOs is primarily provided through funds managed by the PE group. The PE group structures the equity component in a way that optimizes equi-ty returns and management incentives. A widely utilized instrument is the shareholder loan that is constructed to be tax deductible and to allocate common equity of 5 to 20% to management, although management actually only contributes a small fraction of the overall equity component.42 The ratio between the value of the common shares and the actual injected capital of management is known as ‘envy ratio’ and typically ranges from four to six. This construction leads to increased performance incentives for the LBO management as it receives a large payoff for a successful LBO.43
41
Cf. Axelson, et al. (2010), Demiroglu/James (2010b), Ivashina/Kovner (2010).
42
Cf. Eilers/Koffka/Mackensen (2009), p. 317, Jonsson (2005), p. 51, Mittendorfer (2007), p. 31.
43
Table 1: Typical LBO financing structure and characteristics
Source: Author, Kwik-Fit example taken from AXELSON et al. (2010), p. 33
Type of
Financing Seniority Tranche Debt category Purpose Repayment terms
Spread (over EURIBOR) Credit agre ement (CA) Lender base / Final investor Kwik-Fit 2005 example* (m£) % of Uses Sources
Debt (syndicated loan)
Ia a 1st lien senior Term A Pro rata debt Acquisition Amortizing, 7 years 225bps Senior CA Commercial banks 140.0 18.1%
Ia b 1st lien senior Term B Institutional debt Acquisition Bullet, 8 years 275bps Senior CA Institutional investors 135.0 17.5%
Ia c 1st lien senior Term C Institutional debt Acquisition Bullet, 9 years 325bps Senior CA Institutional investors 135.0 17.5%
Ia d 2nd lien senior 2nd lien debt Acquisition Bullet, 9.5 years 500bps Senior CA Institutional investors 75.0 9.7%
II Mezzanine Mezzanine debt Acquisition Bullet, 10 years 450bps cash +
500bps PIK
Subordinated CA
Institutional investors &
specialist mezzanine funds 97.5 12.6%
Total debt 582.5 75.3%
Equity Acquisition 191.0 24.7%
Total sources 773.5 100.0% Contingent facilities (part of the syndicated loan)
Ib a 1st lien senior Revolving facility Pro rata debt Contingent Amortizing 225bps Senior CA Commercial banks 40.0 NM
Ib b 1st lien senior Capex/acquisition
facility Pro rata debt Contingent Amortizing 225bps Senior CA Commercial banks 50.0 NM
Another possible source of equity are funds provided by the vendor of the company. This form of financing is primarily used when buyer and seller have different price expectations. Although the economic nature of this financing form is similar to pre-ferred shares, it is misleadingly labeled vendor ’loan’ since their interest component might be tax deductible for the buyout company. Vendor loans reduce the financing volumes the PE group has to provide and are typically used when credit markets are restrictive with LBO financing, as was the case during the credit crisis.44
While the PE group originates the equity component, debt financing is typically ar-ranged by banks in the form of syndicated loans. In contrast to bonds, syndicated loans can be arranged within a few days, which is essential to complete an LBO successful-ly.45
In general, LBO debt structures are very homogenous and non-trivial in terms of debt layers and debt instruments. Syndicated loans used for LBO financing typically in-clude senior (see number I in Table 1) and subordinated debt (II) tranches. Senior debt can be divided into several different tranches. The lion’s share of the tranches is used by the PE group to pay the acquisition price (Ia) and the remainder can be drawn of the LBO company during the holding period (so called contingent facilities (Ib) like re-volving or capex facilities). A typical LBO contains three different term loans, Term A (Iaa), Term B (Iab) and Term C (Iac) loans. While Term A is amortizing, Term B and C pay interest-only with a final bullet principal repayment. The Term A tranche usual-ly matures after seven years while Term B and C tranches repay after eight and nine years respectively. Spreads are usually homogeneous in the cross section and based on EURIBOR, with Term A typically paying 250 bps, Term B and C 300 bps and 350 bps, respectively.46 44 Cf. Mittendorfer (2007), p. 138. 45 Cf. Axelson, et al. (2010), p. 8. 46
Sometimes misleading, Term loan ‘A’ (or TLa) may also describe amortizing loans, while Term loan ‘B’ (or TLb) may stand for bullet payments, which typically have the tranche letters B and C. Cf. Miller/Chew (2009), p. 13-14.
Besides these financing instruments that are consumed for the acquisition of the target company, the senior credit agreement contains contingent facilities which are provided by banks and paid out when the borrower draws down the funds. The typical sort of contingent facility is the revolving credit line (Iba) which is undrawn at the time of transaction but may be drawn to finance working capital needs or other short-term cash needs. The contingency may also depend on certain capital expenditures (Ibb) or pre-specified acquisitions. The terms and conditions for the contingent facilities typi-cally mirror the terms of the Term A tranche. This conformity is due to the identical lender base of Term A loans and the contingent facilities (together also known as ‘pro rata debt’) that are funded by commercial banks, whereas Term B and C is also called ‘institutional’ senior debt because the investor base primarily consists of institutional investors.47
The high demand for LBO loans and the strive for higher returns for senior loans dur-ing the boom periods in the 1980ies and from 2004 to 2007, induced PE groups and lead arrangers to structure loans, which are included in the senior credit agreement but junior to the aforementioned tranches. This form of senior loan is known as 2nd lien tranche (Iad) because they are junior to the 1st lien tranche of the senior credit agree-ment. In Europe, 2nd lien tranches typically pay spreads of 500-700 bps over EURI-BOR and are structured as bullet payment after nine to ten years. European 2nd lien tranches are protected by the financial covenants in the senior credit agreement, i.e. exhibit the same covenant protection as 1st lien tranches.48 The investors of 2nd lien loans are typical institutional debt purchasers such as mezzanine funds and hedge funds.
Besides senior debt, PE groups utilize subordinated debt (II), which is also included in the syndicated loan package. Subordinated debt typically takes the form of mezzanine that is primarily funded by institutional investors. Mezzanine debt usually exhibits longer maturities than term loans and pays back at the end of maturity. Interest costs
47
Cf. Rosenbaum/Pearl (2009), p. 183, Polenberg/Lukatsky/Gupte (2010), p. 14.
48
This is different in the US where 2nd lien loans also typically have less restrictive covenant pack-ages in which headrooms are looser. Cf. Polenberg/Lukatsky/Gupte (2010), p. 15.
are higher and more heterogeneous than term loan spreads, paying 1000-1250 bps over EURIBOR. In the past it was also quite common to include bridge financing that is later substituted by a public bond. However, bonds were replaced by the increasing demand for leveraged loans from institutional investors through collateralized loan obligations (CLOs) or in its direct form.49
2.3.3 Equity Parties
Private Equity investments are typically made by funds that are commonly organized as limited partnerships. These Private Equity Funds (PEFs) are raised to accumulate capital in order to make equity investments in portfolio companies from limited part-ners (LPs) and are managed by general partpart-ners (GPs), the so called Private Equity Groups (PE groups).50 The LPs, mainly large institutional investors or wealthy indi-viduals, as well as the GPs have capital commitments51 for specific amounts and are obligated to make capital contributions as needed for investments during the invest-ment period of the fund.52
The lifetime of PEFs depends on the structure of the fund which can be either open end or closed end. Open end funds, so called evergreen funds, do not have an explicit lifetime and cash flows from investments are not paid out but reinvested. By contrast, the more prominent type fund, the closed end fund, has a fixed lifetime of around ten years.53 Regarding distributions of closed end funds, cash flows from investments are paid out to fund investors.
Given the potential conflicts between LPs and GPs the economics of the partnership agreements are essential to align interests between investors and fund managers,
49
The information above was derived and summarized from Kaplan/Stein (1993), Axelson, et al. (2010), Demiroglu/James (2010b), Achleitner/Braun/Tappeiner (2010), Brinkhuis/De Maeseneire (2009), Ivashina/Kovner (2010), Kühn (2006) and Eilers/Koffka/Mackensen (2009).
50
Cf. Sahlman (1990), p. 487, Fenn/Liang/Prowse (1995), p.1, Axelson/Strömberg/Weisbach (2009), p. 1550.
51
Metrick/Yasuda (2010) define committed capital as the sum of capital to be invested, lifetime fees plus establishment cost. Establishment cost is related to set up costs of the fund.
52
Cf. Schell (2006), § 1.04[2], Metrick/Yasuda (2010), p. 2.
53
ly through explicit performance incentives. The partnership agreement defines the ex-pected payments to GPs typically consisting of a fixed component, i.e. the manage-ment fee and a variable component, primarily the carried interest. MET-RICK/YASUDA (2010) mention that transaction and monitoring fees are potential additional variable components. Given their relative lower importance, this thesis does not explicitly explain these variable components.54
The management fee is meant to cover the actual cost of managing the fund and typi-cally ranges form 1.5 to 2.5%. METRICK/YASUDA (2010) report that out of 144 funds raised between 1992-2006, 74 charged less than 2.0% management fee, 59 charged 2.0% and 11 charged more than 2.0%. To arrive at the fee amount that has to be paid to GPs, the management fee is multiplied with a certain fee base. During the investment period, the fee base is equal to committed capital but changes to invested capital after the investment period. METRICK/YASUDA (2010) show that 84% of funds change their fee basis after the investment period.55 The management fee is in-dependent from the performance and may induce the PE group to exert lower effort during the investment stage.
To ensure that the GP exerts the maximum effort, the partnership structure typically includes a considerable variable component: the carried interest. The carried interest, or also ‘carry’, is the GP’s share of the limited partnership’s return, i.e. the combined profits of the pooled investments. The calculation of the carried interest based on fund level returns replaced the calculation on a deal-by-deal basis. The reason for the re-placement of the deal-by-deal approach is that it creates incentives for the GP to max-imize the risk of individual investments.56 Profit sharing arrangements for GPs are nonlinear and concave in relation to the fund performance: LPs first receive all their cash flows until they reach a specific level. Typically, the committed capital com-pounded with a ‘preferred return’ or ‘hurdle rate’, then the GP receives 100% of prof-its until he ‘catches up’ to LPs; beyond this point GPs receive the carried interest and
54
For further details see Metrick/Yasuda (2010), p. 25.
55
For a similar European study see Feinendegen/Schmidt/Wahrenburg (2003).
56
LPs the remainder.57 The typical hurdle rate is 8.0% and the carried interest is usually set to 20.0%.58 The carried interest is therefore an option-like claim on the fund profits and may consequently lead to an excessive risk taking by GPs, especially during the later phase of the fund which is also known as ‘end-period gaming’.59
One mitigating factor of the conflict of interest between GPs and LPs is that deals are done with a combination of the ‘ex ante’ financing, i.e. fund commitments, and ‘ex post’ financing, i.e. debt that is raised for each deal separately in LBOs. This debt fi-nancing is an external control mechanism for the state of the industry and the quality of the investment, reducing the possibility of excessive risk taking by GPs.60 AXEL-SON/STRÖMBERG/WEISBACH (2009) also construct a theoretical model that shows the optimality of the ‘real world’ incentive structure of private equity funds. Having explained the structure and explicit economic terms of Private Equity Funds, it is essential to understand the role and incentives of Private Equity Groups that manage these funds as General Partners.
Figure 4 illustrates the role of the PE group. This includes fundraising (I), investing of the fund capital in the equity of portfolio companies (II), and divesting the invest-ments, distributing the resulting cash flows to investors (III).61 This thesis focuses on number II, i.e. the investment activities of the PE group. This function encompasses three stages, namely selecting the portfolio companies (IIa), structuring the transaction (IIb) and initiating value adding activities in portfolio companies (IIc).62 Again, given the focus of this thesis on financial structures and financial covenants in LBOs, this section concentrates on the role of the PE group during the second stage, i.e. the finan-cial structuring of the transaction (IIb).
57
Cf. Axelson/Strömberg/Weisbach (2009), p. 1571.
58
Cf. Metrick/Yasuda (2010), table II, Gompers/Lerner (1999), p.15, For a European study with simi-lar results see Feinendegen/Schmidt/Wahrenburg (2003), p. 1178.
59
Cf. Axelson/Strömberg/Weisbach (2009), p. 1573.
60
Cf. Axelson/Strömberg/Weisbach (2009), 1549 f.
61
For a detailed description see Gompers/Lerner (2004).
62
This classification is similar to Wright/Robbie (1998) but extends the last step from monitoring to execute value adding activities.
Figure 4: Role of private equity groups
Source: ACHLEITNER (2002), p. 748
Having selected a company to acquire, the PE group is responsible to capitalize the newco (see Figure 3) with sufficient funds, i.e. equity and debt, to pay the price for the shares of the target company and redeem pre-LBO debt holders. The final bid for a target company typically includes an equity commitment letter from the Private Equity Group and debt commitment letter from the lead arranger.63
On the equity side, the PE group allocates funds from its PEFs and/or syndicates a share to funds managed by other PE groups. Deals including more than one PE group are called ‘club deals’. In order to increase the purchase price and the equity share, PE groups often – especially during times of restricted debt supply – try to convince ven-dors to grant loans to the LBO company.64 Depending on the personal wealth of the company’s management, PE groups typically demand that management co-invests a certain amount to align incentives with the PE group (see also 2.3.1 and Figure 3).65 On the debt side, the PE group is responsible to attract banks to underwrite the debt commitment.66 After the PE group has identified a target company, it sends prelimi-nary information to potential lead arranging banks. Based on the provided information, lead arrangers decide on whether to submit a term sheet to the PE group. The term sheet typically includes rough estimates of the debt package including interest mar-gins, debt package, maturity as well as types and restrictiveness of financial covenants.
63 Cf. Dennis/Mullineaux (2000), p. 408. 64 Cf. Eilers/Koffka/Mackensen (2009), p. 300. 65
See also section 2.3.1.
66
For a detailed description of the debt providing perspective see 2.3.4.
Fundraising (I) Selecting (IIa) Structuring (IIb) Monitoring (IIc) Divesting / exiting (III) Investing (II)
Based on due diligence results67 the PE group negotiates the financing case, i.e. the financial projections for the buyout company, with the lead arranging bank. The fi-nancing case serves as the fundament to determine the explicit debt package and in-struments.68 Finally, the PE group negotiates the detailed terms and conditions of the credit agreement with the lead arranging bank.
In terms of incentives, PE groups have explicit stimuli in the form of carried interest but are also incentivized by implicit measures, related to the ability to raise future funds. This implicit incentive of PE groups is known as the reputational conservation effect. The incentives to conserve the benefits derived from reputation reduce conflicts of interests between LPs (i) but also lenders (ii). Regarding the relationship between PE groups and LPs (i), CHUNG et al. (2010) formalize the implicit incentive for GPs based on the LP’s assessment of the GP’s performance and behavior to allocate capital to the PE group’s next fund. They find that the implicit incentives from future fund-raising are about the same as explicit incentives from the current fund’s carried inter-est.69
Regarding the relationship between PE groups and lenders (ii), PE groups benefit from their reputation as reputation facilitates ex post deal-by-deal debt financing. DIA-MOND (1989) shows how borrower reputation mitigates conflicts of interests between lenders and borrowers. As successful track records lead to better lending terms, bor-rowers benefit from their good reputation. PE groups that have proven to be overly successful and plan to raise future funds, implying a future debt raising amount of two to three times70 the amount of the targeted fund sizes, have considerable incentives to avert excessively risky projects.
67
Due diligence efforts aim to critically assess risks for the buyout company and includes financial, legal, tax and commercial components. For a more detailed description see Eilers/Koffka/Macken-sen (2009), p. 34f.
68
For a detailed description of the process see 4.3.2.
69
Cf. Chung, et al. (2010), p. 9 and p. 23.
70
2.3.4 Debt Parties
The debt financing for LBOs is typically provided in the form of syndicated loans and normally include senior as well as subordinated debt tranches.71 A syndicated loan is provided to a borrower by a group of financial institutions. Syndicated loans represent a hybrid of private and public debt.72 BOOT/THAKOR (2000) describe a syndicated loan as a mixture between ‘relationship loans’ and ‘transaction loans’.73 Syndicated loans typically contain both structural elements of loan financing: the lead bank screens and monitors the borrower in a relationship-like context; however, these loans also contain elements of a capital-market-like environment as the lead arranging bank sells and/or underwrites a certain share of the loan or the entire loan.74 The following paragraph explains the role of the lead arranging bank in the process to originate a syndicated loan for an LBO, a so called leveraged loan.
In a leveraged loan, the PE group submits preliminary information on the lending op-portunity to several banks. Banks then submit a term sheet that broadly defines cove-nants, fees, loan amount and interest rates. Based on the term sheet as well as reputa-tional and relationship aspects, the PE group mandates one or more bank(s) to be the lead arranger(s). The PE group and the lead arranger sign a preliminary loan agree-ment (‘mandate or commitagree-ment letter’).75 The bank may commit to fund the entire loan package or a portion of it with a promise to use best effort to arrange financing from other lenders.76
After signing the commitment letter, the lead arranger – in close collaboration with the PE group – conducts due diligence on the potential buyout company, forms its own view of the company’s development, translates these expectations into financial pro-jections, and finally determines the offered debt package and the financial instruments.
71
See also section 2.3.1.
72
Cf. Dennis/Mullineaux (2000), p. 404.
73
Cf. Boot and Thakor (2000), p. 685, but also Sufi (2007), p. 641.
74 Cf. Dennis/Mullineaux (2000), p. 405. 75 Cf. Sufi (2007), p. 632. 76 Cf. Dennis/Mullineaux (2000), p. 408.
To attract other financial institutions to join the syndicate, the lead arranger prepares an ‘information memorandum’, also known as ‘bank book’, containing important de-scriptive and financial information regarding the business prospects of the buyout company.77 The addressees for pro rata debt, i.e. Term A and contingent facilities, are banks whereas institutional senior loans, 2nd lien and subordinated debt is advertised to institutional investors.78 During this process the lead arranger coordinates and drafts all the loan documents (senior and subordinated) in direct negotiation with the PE group. Syndicate participants may provide comments and suggestions prior to signing but are generally not involved in the negotiations with the PE group.79 Once the loan amount is allocated to the syndicate lenders – including the take of the lead arranger, also known as final hold –, the loan agreement is signed by all parties.80 After the loan has been provided for the LBO, the lead arranger acts as the ‘agent’ managing the loan, i.e. acting as the middleman for cash flows between senior and subordinated lenders and borrowers.
The Loan Market Association (LMA), the European trade association for the syndicat-ed loan market, summarizes the functions of the agent as follows81:
Point of Contact: representing the views of the syndicate towards the bor-rower
Monitor: monitoring the compliance of the borrower with the credit terms
Postman and Record-keeper: borrower gives notice to agent
Paying agent: agent collects payments from borrower and distributes them to syndicate members
The agent also takes the lead in negotiating waivers and is permitted to declare the de-fault of a loan. To limit the powers of the agent, the loan agreement contains an 77 Cf. Dennis/Mullineaux (2000), p. 408. 78 Cf. Demiroglu/James (2010b), p. 307, Polenberg/Lukatsky/Gupte (2010), p. 14f. 79 Cf. Dennis/Mullineaux (2000), p. 408. 80 Cf. Sufi (2007), p. 633. 81
cy section’ that formulates the conditions for the removal of the agent. Typically, lead arrangers are released from any potential liability to syndicate members except for ‘gross negligence or misconduct’. In return for their service, the lead arranger is com-pensated in form of fees, typically as a percentage of the entire syndicated loan.82
2.4 Research Model
This section reduces the complex structure of a typical LBO to a basic model that will be used in the theoretical framework to explain the foundations of covenants in general and financial covenants in particular.
In theory, whenever a person or institution (the principal) engages another person or institution (the agent) to perform decision making on behalf of the principal, there ex-ists a principal agent relationship.83 The unit of analysis in principal agent relation-ships is the contract between the principal and the agent.84 In an LBO there are two levels of principal agent relationships (see Figure 5).
On the first level relationship, debt holders invest their money in a buyout company but delegate decision making and control rights to equity holders. The equity holders then decide how to allocate the debt amount.
82 Cf. Steffen (2008). 83 Cf. Jensen/Meckling (1976), p. 308. 84 Cf. Eisenhardt (1989), p. 59.
Figure 5: Principal agent relationships in LBOs
Source: Author
On the second level, i.e. inside the groups of debt and equity holders there are again a number of principal agent relationships. For example in the group of equity holders, the LP commits his money to the PEF which is managed by the PE group which in turn invests the funds in companies and delegates the decision making over the asset to a management team.
As this thesis analyzes the contract between debt and equity holders, the following theoretical framework focuses on the first level principal agent relationship and pro-vides economic rationales for the inclusion of covenants in credit agreements.
Lead arranging bank Syndicate Participants Institutional Investors Private Equity Group Limited Partners Buyout Management
Equity holders*
Debt holders
First LevelPrincipal Agent Relationship
Second Level
Principal Agent Relationships Second Level
Principal Agent Relationships
3 Theoretical Framework 3.1 Introductory Remarks
This section introduces a theoretical dichotomous85 taxonomy for the rationale of cov-enants that is in line with economic considerations following TIROLE (2006) and fo-cuses on the relationship between equity and debt holders. The first economic rationale for covenants, the ‘conflict view’, has its foundation in the principal agent theory and explains the usage of action-restricting covenants. The second economic rationale for covenants, the ‘control view’, is based on financial contracting theory86 and explains the usage of financial covenants as well as the combination of financial and action-restricting covenants in credit agreements. Both constructs belong to the capital struc-ture theory of new institutional economics.87 The area of new institutional economics is based on following assumptions: methodological individualism (i), individual utility maximization (ii), individual rationality (iii), opportunistic behaviour of individuals (iv), institutional environment (v), and existence of governance structures (vi).88
3.2 The Conflict View - Agency Theory
3.2.1 Agency Conflict between Debt and Equity Holders
MODIGLIANI/MILLER (1958) show that under certain neoclassical assumptions89 the choice of the capital structure does not impact the cost of capital of the firm. In a
85
This classification of covenants is not common in literature. In general the existing literature tends to distinguish between positive and negative covenants. Positive covenants prescribe certain actions the borrower must take. Negative covenants restrict managerial decisions. Since a positive covenant might also be formulated the opposite way thus being classified as a negative covenant, this classi-fication is not meaningful. This line of argument follows Tirole (2006) who gives an example: the positive covenant, maintaining assets in good repair and working order, can be formulated as the prohibition of letting the assets wear and tear, which is a negative covenant. Cf. Tirole (2006), p. 84.
86
Note that financial contracting also builds upon the theoretical construct of agency theory.
87
Cf. Rudolph (2006) chapter 5, p. 117-161. The field of new institutional economics comprises the property-rights-theory, the transaction-cost-theory, the principal agent theory, and the theory of in-complete contracts.
88
Cf. Richter/Furubotn (1999), p. 2-9.
89
The assumptions are: (i) perfect capital market without taxes or transaction costs; (ii) institutions and individuals borrow at the same risk-free rate; (iii) firms finance themselves with risk-free debt
continuative work, STIGLITZ (1974) demonstrates that the total cost of capital is also independent from the distribution of the firm’s risk on equity and debt holders, as shown in Figure 6. If the cost of debt (denoted kCoD) is not constant but increases after a certain degree of leverage because debt holders share part of the firm’s risk, the cost of equity (denoted kCoE) decreases proportionally because risks are transferred to debt holders. However, the overall cost of total capital (denoted kTC) remains constant. In this world there would not be any rationale for covenants as the capital structure does not affect the value of the firm.
Figure 6: Neoclassical cost of capital with risky debt
Source: Author on the basis of RUDOLPH (2006), p. 96
LELAND (1994) analyzed the impact of the inclusion of covenants90 on the value of corporate debt and the optimal capital structure. He finds that the value of debt with
and risky equity; (iv) homogenous expectations of market participants regarding the distribution of future cash flows.
90
Leland (1994) assumes long-term debt with financial covenants, a positive net worth covenant in particular. He notes that this structure is not common in debt agreements but proxies a roll-over process which is common in practice. Cf. Leland (1994), p. 1234.
Share of equity
Cost of capital
kTC=const. kCoE
covenants (protected debt) may be lower than the value of debt without covenants (un-protected debt) when bankruptcy costs are greater than zero, which is a realistic case.91 This follows because bankruptcy, and also the related cost, occurs more frequently when debt includes covenants. Indicatively, this seems irritating as this would imply that covenants do not have an economic rationale. However, LELAND (1994) then moves on to the agency problems between equity and debt holders developed by JEN-SEN/MECKLING (1976), abandoning the assumption of the new classical view.92 Migrating from the neoclassical view of firms as production functions to the new insti-tutional view, firms are seen as institutions that aggregate the individual interests of economic agents who have different stakes in the institution.93 In their seminal paper on the effect of capital structure on the firm value, JENSEN/MECKLING (1976) view the firm as a ‘legal fiction’ that serves as a nexus for contracting relationships.94 The firm contains divisible claims on future cash flows of the organization (including those of asset disposal).95 These claims are held by individuals (some may be other organiza-tions) which might have conflicting interests. JENSEN/MECKLING (1976) define a principal agent relationship (also known as agency relationship) as a contract, under which a principal delegates some decision making authority to an agent.96 Principal and agent are trying to maximize their individual utility, which suggests that the agent will not always act in the best interest of the principal. JENSEN/MECKLING (1976) discuss two agency relationships that might result in conflicts and consequently costs for the firm:
91 Cf. Leland (1994), p. 1235f. 92 Cf. Leland (1994), p. 1243f. 93 Cf. Rudolph (2006), p. 119. 94
The work of Jensen/Meckling (1976) mainly builds on property rights literature from Coase (1937) and on agency literature from Ross (1973).
95
Cf. Jensen/Meckling (1976), p. 314.
96
Agency costs of outside equity97
are costs that arise for the firm due to con-flicts of interest between outside owners (shareholders as principals) and in-side owners (managers as agents).
Agency costs of debt98
relate to costs that might occur to the firm based on potential conflicts between debt holders and shareholders (or managers act-ing on behalf the shareholders).
Since covenants in credit agreements are concerned with regulating the relationship between debt holders and shareholders this thesis concentrates on the conflicts related to agency costs of debt. The existence of debt within a firm leads to incentive effects associated with its inherent payoff characteristics. These properties induce the debtor to undertake actions that transfer wealth from creditors to themselves. The seminal works of JENSEN/MECKLING (1976), MYERS (1977) and SMITH/WARNER (1979) show three different incentive effects of shareholders inducing them to take actions that expropriate creditors, i.e. the value of debt is reduced.
3.2.1.1 Asset Substitution
The following section explains why shareholders of leveraged firms are likely to en-gage in asset substitution, i.e. in actions that increase the risk of the firm, in order to increase their wealth and expropriate debt holders.99 Due to the characteristics of the convex equity claim according to BLACK/SCHOLES (1973), the equity holder has incentives to make higher-risk investments. Following BLACK/SCHOLES (1973), owning the equity of a firm is identical to the option to buy the firm paying the face value of debt, i.e. the principal amount, to debt holders at expiration date (see Figure 7). It shows that the value of equity has a limited downside and an unlimited upside. In this model the value of equity (S) is:
negatively related to the face value of debt , i.e. 0,
97 Cf. Jensen/Meckling (1976), p. 315-340. 98 Cf. Jensen/Meckling (1976), p. 345-358. 99 Cf. Jensen/Meckling (1976), p. 345-350.