JavaScript using the W3C performance object
Tom Barker
(
[email protected]
)
Director of Software Development and Engineering
Comcast
11 March 2014
When looking at web performance metrics, the ideal numbers to focus on are real user metrics
harvested from your own users. The most popular method is to consume your machine data
with a tool such as
Splunk
, which enables you to analyze and visualize your access and
error logs. With these tools, you can glean some aspects of performance data, such as file
I/O times for reading assets and access times of API requests. However, you are still left to
extrapolate client-side performance data, put beacon calls at certain high-level checkpoints,
or just run synthetic testing with tools like WebPagetest. Now, the W3C has standardized an
API that makes it possible to capture and report out in-browser performance data by using the
Performance
object, an object native to the Windows® object in all modern browsers.
API to capture and report in-browser performance data
In late 2010, the World Wide Web Consortium (W3C) created a new working group, the
Web Performance Working Group
, to provide methods for measuring aspects of application
performance of user agent features and APIs. The group has developed an API that enables
browsers to expose to JavaScript, key web performance metrics.
In this API, the working group created a number of new objects and events that quantify
performance metrics and optimize performance. At a high level, these objects and interfaces are:
•
Performance
object — Exposes several objects, such as
PerformanceNavigation
,
PerformanceTiming
, and
MemoryInfo
, as well as the capability to record high resolution time
for sub-millisecond timing.
•
Page Visibility
API — Enables you to determine whether a given page is visible or hidden,
so as to optimize memory use for animations, or to optimize network resources for polling
operations.
Use these objects and interfaces to capture and visualize in-browser performance metrics.
Performance object
If you type
window.performance
in a JavaScript console, it returns an object of type
Performance
•
window.performance.timing
for type
PerformanceTiming
•
window.performance.navigation
for type
PerformanceNavigation
•
window.performance.memory
for type
MemoryInfo
(Chrome browser only)
Figure 1 shows a screen capture of the
Performance
object expanded to show the
PerformanceTiming
object with its properties.
Figure 1.
Performance
object
The
Performance
object is shown in the console with the
PerformanceTiming
object expanded.
PerformanceTiming
object
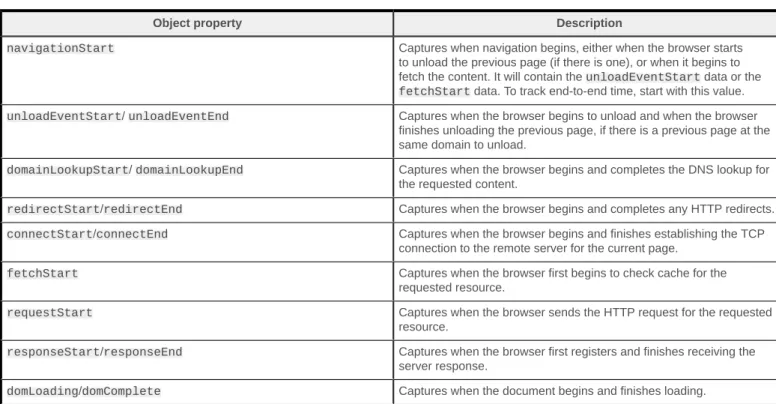
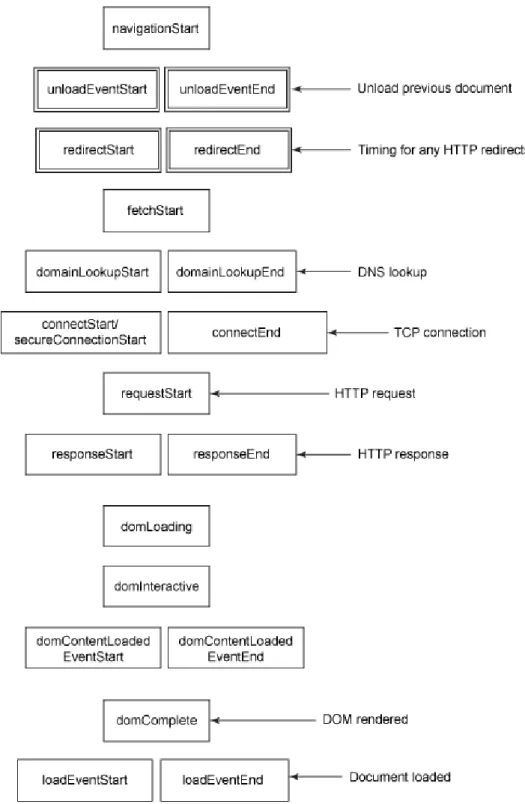
The
PerformanceTiming
object exposes, as public properties, key metrics for the steps that the
browser goes through to retrieve and render content. Table 1 shows what each property in the
PerformanceTiming
object corresponds to.
Table 1.
PerformanceTiming
object properties
Object property Description
navigationStart Captures when navigation begins, either when the browser starts to unload the previous page (if there is one), or when it begins to fetch the content. It will contain the unloadEventStart data or the fetchStart data. To track end-to-end time, start with this value. unloadEventStart/ unloadEventEnd Captures when the browser begins to unload and when the browser
finishes unloading the previous page, if there is a previous page at the same domain to unload.
domainLookupStart/ domainLookupEnd Captures when the browser begins and completes the DNS lookup for the requested content.
redirectStart/redirectEnd Captures when the browser begins and completes any HTTP redirects. connectStart/connectEnd Captures when the browser begins and finishes establishing the TCP
connection to the remote server for the current page. fetchStart Captures when the browser first begins to check cache for the
requested resource.
requestStart Captures when the browser sends the HTTP request for the requested resource.
responseStart/responseEnd Captures when the browser first registers and finishes receiving the server response.
domContentLoadedEventEnd/ domContentLoadedEventStart Captures when the document's DOMContentLoaded begins and finishes loading, which corresponds to when the browser has completed loading all of the content and running all of the included scripts on the page.
domInteractive Captures when the page's Document.readyState property changes to interactive, which causes the readystatechange event to be fired.
loadEventStart/loadEventEnd Captures right before when the load event is fired and right after the load even is fired.
Performance navigation
Figure 3 shows the
Performance
object with the
PerformanceNavigation
object expanded.
Figure 3.
PerformanceNavigation
object
Note that the navigation object has two read-only attributes:
redirectCount
and
type
. The
redirectCount
attribute is exactly what the name implies: the number of HTTP redirects that the
browser follows to get to the current page.
HTTP redirects are a significant contributor to web performance because they cause a complete
HTTP round trip for each redirect. The original request is returned from the web server as a 301
or a 302 with the path to the new location. The browser must then initialize a new TCP connection
and send a new request for the new location. This extra step adds additional latency to the original
resource request.
The
redirectCount
property is shown in Listing 1.
Listing 1. Accessing the
redirectCount
property
>>> performance.navigation.redirectCount 0
The other attribute of the navigation object is
type
. The
navigation.type
attribute is one of four
values represented by the following constants:
•
TYPE_NAVIGATE
with the value of 0 indicates that the current page was navigated to by clicking
a link, by submitting a form, or by entering the URL directly in the address bar.
•
TYPE_RELOAD
with the value of 1 indicates that the current page was arrived at through a
reload operation.
•
TYPE_BACK_FORWARD
with the value of 2 indicates that the page was navigated to by using the
browser history, either the back or forward buttons or programmatically, through the browser's
history object.
•
TYPE_RESERVED
with the value of 255 is a catch-all indication for any other navigation type.
Put it all together
To use these objects to capture and visualize client-side performance metrics, create a JavaScript
library that collects the
PerformanceTiming
data and sends it to an endpoint for collection and
The perfLogger.js script uses the
Performance
object. Create a namespace called
perfLogger
and declare locally scoped variables to hold values extrapolated from the
PerformanceTiming
properties.
You can calculate times by using these examples and following these patterns:
• To calculate perceived time — Subtract the current time from
timing.navigationStart
.
• To calculate how long it took to traverse all of the redirects needed to get to the page —
Subtract
timing.redirectEnd
from
timing.redirectStart
.
• To get the time it took to do the DNS lookup — Subtract
timing.domainLookupEnd
from
timing.domainLookupStart
, to get the time it took the page to be rendered subtract the
current time from
xs
.
After you declare and initialize the locally scoped variables, expose them from the namespace by
using public getter functions, as shown in Listing 2.
Listing 2. Expose the locally scoped variables for the public
getter
functions
var perfLogger = function(){
var serverLogURL = "/lib/savePerfData.php", loggerPool = [],
_pTime = Date.now() - performance.timing .navigationStart || 0, _redirTime = performance.timing.redirectEnd - performance.timing.redirectStart || 0, _cacheTime = performance.timing.domainLookupStart - performance.timing.fetchStart || 0, _dnsTime = performance.timing.domainLookupEnd - performance.timing.domainLookupStart || 0, _tcpTime = performance.timing.connectEnd - performance.timing.connectStart || 0, _roundtripTime = performance.timing.responseEnd - performance.timing.connectStart || 0,
_renderTime = Date.now() - performance.timing .domLoading || 0;
//expose derived performance data perceivedTime: function(){ return _pTime; }, redirectTime: function(){ _redirTime; }, cacheTime: function(){ return _cacheTime; }, dnsLookupTime: function(){ return _dnsTime; }, tcpConnectionTime: function(){ return _tcpTime; }, roundTripTime: function(){ return _roundtripTime; }, pageRenderTime: function(){ return _renderTime; }, }
From the namespace you can access the properties, as shown in Listing 3.
Listing 3. Access the properties from our namespace
perfLogger.pageRenderTime perfLogger. roundTripTime perfLogger. tcpConnectionTime perfLogger. dnsLookupTime perfLogger. cacheTime perfLogger. redirectTime perfLogger. perceivedTime
Within the namespace, the function
logToServer
writes the metrics back to an endpoint you define
in the variable
serverLogURL
, as shown in Listing 4.
Listing 4.
logToServer
function
function logToServer(id){
var params = "data=" + JSON.stringify(jsonConcat (loggerPool[id],TestResults.prototype));
console.log(params)
var xhr = new XMLHttpRequest(); xhr.open("POST", serverLogURL, true); xhr.setRequestHeader("Content-type", "application/x-www-form-urlencoded"); xhr.setRequestHeader("Content-length", params.length); xhr.setRequestHeader("Connection", "close"); xhr.onreadystatechange = function() {
if (xhr.readyState==4 && xhr.status==200) { console.log('log written'); } }; xhr.send(params); }
The perfLogger.js library also has benchmarking capabilities, where you can test ad-hoc blocks of
JavaScript and even run a set test
N
amount of times for true benchmarking.
The complete source code of the perfLogger.js library can be seen in Listing 5.
Listing 5. The complete source code of the perfLogger.js library
var perfLogger = function(){
var serverLogURL = "/lib/savePerfData.php", loggerPool = [],
_pTime = Date.now() - performance.timing.navigationStart || 0, _redirTime = performance.timing.redirectEnd - performance.timing.redirectStart || 0, _cacheTime = performance.timing.domainLookupStart - performance.timing.fetchStart || 0, _dnsTime = performance.timing.domainLookupEnd - performance.timing.domainLookupStart || 0, _tcpTime = performance.timing.connectEnd - performance.timing.connectStart || 0, _roundtripTime = performance.timing.responseEnd - performance.timing.connectStart || 0,
_renderTime = Date.now() - performance.timing.domLoading || 0;
function TestResults(){}; TestResults.prototype.perceivedTime = _pTime; TestResults.prototype.redirectTime = _redirTime; TestResults.prototype.cacheTime = _cacheTime; TestResults.prototype.dnsLookupTime = _dnsTime; TestResults.prototype.tcpConnectionTime = _tcpTime; TestResults.prototype.roundTripTime = _roundtripTime; TestResults.prototype.pageRenderTime = _renderTime; function jsonConcat(object1, object2) {
for (var key in object2) { object1[key] = object2[key]; } return object1; } function calculateResults(id){ loggerPool[id].runtime = loggerPool[id].stopTime - loggerPool[id].startTime; } function setResultsMetaData(id){ loggerPool[id].url = window.location.href; loggerPool[id].useragent = navigator.userAgent; } function drawToDebugScreen(id){
var debug = document.getElementById("debug") var output = formatDebugInfo(id)
if(!debug){
var divTag = document.createElement("div"); divTag.id = "debug"; divTag.innerHTML = output document.body.appendChild(divTag); }else{ debug.innerHTML += output } } function logToServer(id){
var params = "data=" + JSON.stringify(jsonConcat( loggerPool[id],TestResults.prototype));
console.log(params)
var xhr = new XMLHttpRequest(); xhr.open("POST", serverLogURL, true); xhr.setRequestHeader("Content-type", "application/x-www-form-urlencoded"); xhr.setRequestHeader("Content-length", params.length); xhr.setRequestHeader("Connection", "close"); xhr.onreadystatechange = function() {
if (xhr.readyState==4 && xhr.status==200) { //console.log(xhr.responseText); } }; xhr.send(params); } function formatDebugInfo(id){ var debuginfo = "<p><strong>"
+ loggerPool[id].description + "</strong><br/>"; if(loggerPool[id].avgRunTime){
debuginfo += "average run time: " + loggerPool[id] .avgRunTime + "ms<br/>";
}else{
+ "ms<br/>"; }
debuginfo += "path: " + loggerPool[id].url + "<br/>";
debuginfo += "useragent: " + loggerPool[id].useragent + "<br/>";
debuginfo += "Perceived Time: " + loggerPool[id].perceivedTime + "<br/>"; debuginfo += "Redirect Time: " + loggerPool[id].redirectTime + "<br/>"; debuginfo += "Cache Time: " + loggerPool[id].cacheTime + "<br/>";
debuginfo += "DNS Lookup Time: " + loggerPool[id].dnsLookupTime + "<br/>";
debuginfo += "tcp Connection Time: " + loggerPool[id].tcpConnectionTime + "<br/>"; debuginfo += "roundTripTime: "+ loggerPool[id].roundTripTime + "<br/>"; debuginfo += "pageRenderTime: " + loggerPool[id].pageRenderTime + "<br/>"; debuginfo += "</p>"; return debuginfo } return {
startTimeLogging: function(id, descr,drawToPage ,logToServer){
loggerPool[id] = new TestResults(); loggerPool[id].id = id; loggerPool[id].startTime = performance.now(); loggerPool[id].description = descr; loggerPool[id].drawtopage = drawToPage; loggerPool[id].logtoserver = logToServer }, stopTimeLogging: function(id){ loggerPool[id].stopTime = performance.now(); calculateResults(id); setResultsMetaData(id); if(loggerPool[id].drawtopage){ drawToDebugScreen(id); } if(loggerPool[id].logtoserver){ logToServer(id); } },
logBenchmark: function(id, timestoIterate, func, debug, log){ var timeSum = 0;
for(var x = 0; x < timestoIterate; x++){
perfLogger.startTimeLogging(id, "benchmarking "+ func, false, false); func(); perfLogger.stopTimeLogging(id) timeSum += loggerPool[id].runtime } loggerPool[id].avgRunTime = timeSum/timestoIterate if(debug){ drawToDebugScreen(id) } if(log){ logToServer(id) } },
perceivedTime: function(){ return _pTime; }, redirectTime: function(){ _redirTime; }, cacheTime: function(){ return _cacheTime; }, dnsLookupTime: function(){ return _dnsTime; }, tcpConnectionTime: function(){ return _tcpTime; }, roundTripTime: function(){ return _roundtripTime; }, pageRenderTime: function(){ return _renderTime; }, showPerformanceMetrics: function(){
this.startTimeLogging("no_id", "draw perf data to page" ,true,true); this.stopTimeLogging("no_id"); } } }(); performance.now = (function() { return performance.now || performance.mozNow || performance.msNow || performance.oNow || performance.webkitNow ||
function() { return new Date().getTime(); }; })();
Implementation and visualization
To use the perfLogger.js script to visualize in-browser performance, you can embed it on a page,
and on the page's
onload
event you can push the performance data back to an endpoint to save to
a flat file. The
perfLogger
project in GitHub comes with a PHP script, named savePerfData.php, to
handle just this functionality. The source code of this file can be seen in Listing 6.
Listing 6. Source code for the savePerfData.php
<?php require("util/fileio.php"); $logfile = "log/runtimeperf_results.txt"; $benchmarkResults = formatResults($_POST["data"]); saveLog($benchmarkResults, $logfile); function formatResults($r){ print_r($r); $r = stripcslashes($r); $r = json_decode($r); if(json_last_error() > 0){ die("invalid json");
}
return($r); }
function formatNewLog($file){
$headerline = "IP, TestID, StartTime, StopTime, RunTime, URL, UserAgent, PerceivedLoadTime, PageRenderTime, RoundTripTime, TCPConnectionTime, DNSLookupTime, CacheTime, RedirectTime"; appendToFile($headerline, $file);
}
function saveLog($obj, $file){ if(!file_exists($file)){ formatNewLog($file); }
$obj->useragent = cleanCommas($obj->useragent);
$newLine = $_SERVER["REMOTE_ADDR"] . "," . $obj->id .","
. $obj->startTime . "," . $obj->stopTime . "," . $obj->runtime . "," . $obj->url . "," . $obj->useragent . $obj->perceivedTime . "," . $obj->pageRenderTime . "," . $obj->roundTripTime . "," . $obj->tcpConnectionTime . "," . $obj->dnsLookupTime . "," . $obj->cacheTime . "," . $obj->redirectTime; appendToFile($newLine, $file); } function cleanCommas($data){
return implode("", explode(",", $data)); }
?>
This PHP essentially saves the POST data sent by perfLogger.js into a flat file formatted as in
Listing 7.
Listing 7. POST data sent by perfLogger.js
IP, TestID, StartTime, StopTime, RunTime, URL, UserAgent,
PerceivedLoadTime, PageRenderTime, RoundTripTime, TCPConnectionTime, DNSLookupTime, CacheTime, RedirectTime
75.149.106.130,page_render,1341243219599,1341243220218,619 ,http://www.tom-barker.com/blog/?p=x,Mozilla/5.0 (Macintosh; Intel Mac OS X 10.5; rv:13.0) Gecko/20100101
Firefox/13.0.1790,261,-2,36,0,-4,0
At this point, you can see that there are some great data points to look at, such as:
• The average load time by user agent
• On average, what part of the HTTP transaction process has the most time spent
• The general load time distribution
Within the GitHub repository, there is also an R script, named runtimePerformance.R, that ingests
this log file you are generating, and crafts some data visualizations (see Listing 8).
Listing 8. R script named runtimePerformance.R
dataDirectory <- "/Applications/MAMP/htdocs/lab/log/" chartDirectory <- "/Applications/MAMP/htdocs/lab/charts/" testname = "page_render"
perflogs <- read.table(paste(dataDirectory, "runtimeperf _results.csv", sep=""), header=TRUE, sep=",")
perfchart <- paste(chartDirectory, "runtime_",testname, ". pdf", sep="") loadTimeDistrchart <- paste(chartDirectory, "loadtime_distribution.pdf", sep="") requestBreakdown <- paste(chartDirectory, "avgtime_inrequest.pdf", sep="") loadtime_bybrowser <- paste(chartDirectory, "loadtime_bybrowser.pdf", sep="")
pagerender <- perflogs[perflogs$TestID == "page_render",] df <- data.frame(pagerender$UserAgent, pagerender$RunTime) df <- by(df$pagerender.RunTime, df$pagerender.UserAgent, mean) df <- df[order(df)]
pdf(perfchart, width=10, height=10) opar <- par(no.readonly=TRUE) par(las=1, mar=c(10,10,10,10)) barplot(df, horiz=TRUE) par(opar) dev.off() getDFByBrowser<-function(data, browsername){ return(data[grep(browsername, data$UserAgent),]) } printLoadTimebyBrowser <- function(){
chrome <- getDFByBrowser(perflogs, "Chrome") firefox <- getDFByBrowser(perflogs, "Firefox") ie <- getDFByBrowser(perflogs, "MSIE")
meanTimes <- data.frame(mean(chrome$PerceivedLoadTime), mean(firefox$PerceivedLoadTime), mean(ie$PerceivedLoadTime)) colnames(meanTimes) <- c("Chrome", "Firefox",
"Internet Explorer")
pdf(loadtime_bybrowser, width=10, height=10)
barplot(as.matrix(meanTimes), main="Average Perceived Load Time\nBy Browser", ylim=c(0, 600), ylab="milliseconds")
dev.off() }
pdf(loadTimeDistrchart, width=10, height=10)
hist(perflogs$PerceivedLoadTime, main="Distribution of Perceived
Load Time", xlab="Perceived Load Time in Milliseconds", col=c("#CCCCCC"))
dev.off()
avgTimeBreakdownInRequest <- function(){ #expand exponential notation
options(scipen=100, digits=3) #set any negative values to 0
perflogs$PageRenderTime[perflogs$PageRenderTime < 0] <- 0 perflogs$RoundTripTime[perflogs$RoundTripTime < 0] <- 0
perflogs$TCPConnectionTime[perflogs$TCPConnectionTime < 0] <- 0 perflogs$DNSLookupTime[perflogs$DNSLookupTime < 0] <- 0
#capture avg times
avgTimes <- data.frame(mean(perflogs$PageRenderTime),
mean(perflogs$RoundTripTime), mean(perflogs$TCPConnectionTime), mean(perflogs$DNSLookupTime))
"TCPConnectionTime", "DNSLookupTime") pdf(requestBreakdown, width=10, height=10) opar <- par(no.readonly=TRUE)
par(las=1, mar=c(10,10,10,10))
barplot(as.matrix(avgTimes), horiz=TRUE, main="Average Time Spent\nDuring HTTP Request", xlab="Milliseconds")
par(opar) dev.off() }
printLoadTimebyBrowser() avgTimeBreakdownInRequest()
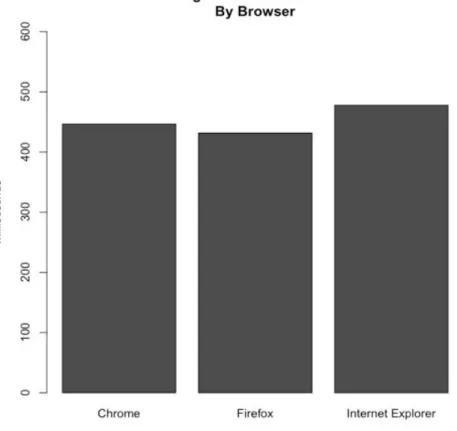
This R script comes with some built-in functions, such as
printLoadTimebyBrowser
and
avgTimeBreakdownInRequest
. Figure 4 is a screen capture of the
printLoadTimebyBrowser
output.
Figure 4. Output for
printLoadTimebyBrowser
Figure 5. Output for
avgTimeBreakdownInRequest
code
After you have the performance data loaded into your R session, all ingested metrics are stored in
a data frame named
perflogs
, so you can access individual columns as shown in Listing 9.
Listing 9. Ingested metrics are stored in a data frame named perflogs
perflogs$PerceivedLoadTime perflogs$ PageRenderTime perflogs$RoundTripTime perflogs$TCPConnectionTime perflogs$DNSLookupTime perflogs$UserAgent
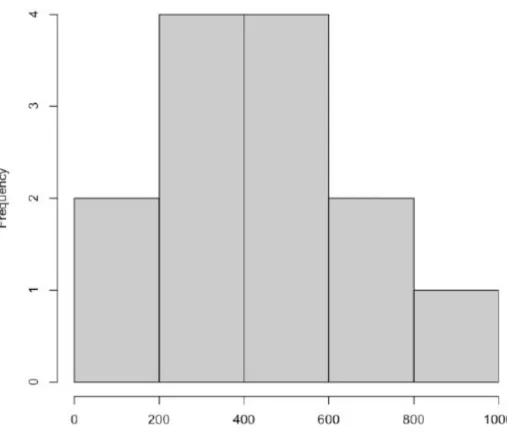
This code enables you to start doing some exploratory analysis of the data, such as creating
histograms to see the distribution of perceived load times for your userbase, as shown in see
Listing 10.
Listing 10. The perceived load times of the user base
hist(perflogs$PerceivedLoadTime, main="Distribution of
Perceived Load Time", xlab="Perceived Load Time in Milliseconds", col=c("#CCCCCC"))
dev.off()