Report prepared for
Australian Council of Deans of Science
Australian Council
of Deans of Science
Wh o’ s T eac hi ng Sc ienc e?Meeting the demand for qualified science teachers in Australian secondar
y schools
Australian Council of Deans of Science
Who’s Teaching Science?
Meeting the demand for qualified science
teachers in Australian secondary schools
16???-CSHE.ScienceCover 11/3/05 4:52 PM Page 1Who’s Teaching Science?
Meeting the demand for qualified science
teachers in Australian secondary schools
Report prepared for
Australian Council of Deans of Science
Kerri-Lee Harris, Felicity Jensz and Gabrielle Baldwin
Centre for the Study of Higher Education
The University of Melbourne
ISBN 0 7340 3069 X
ISBN 0 7340 3070 3 (electronic/internet copy)
© Centre for the Study of Higher Education, University of Melbourne 2005. Except as provided by the Copyright Act 1968, no part of this publication may be reproduced, stored in a retrieval system or transmitted in any form or by any means without the prior written permission of the publisher. This report was commissioned by the Australian Council of Deans of Science.
Contents
Foreword ... vii
Executive summary ... ix
Acknowledgements ... xii
Chapter 1: Context of the study ... 1
Chapter 2: The study’s purpose and method... 2
2.1 Purpose... 2
2.2 Methodology ... 2
2.2.1 Heads of science departments survey ... 3
2.2.2 Science teachers survey ... 3
Chapter 3: The demographics and qualifications of science teachers... 5
3.1 Location and sector representation ... 5
3.2 Gender and age representation... 6
3.3 Employment histories ... 6
3.3.1 Years of employment ... 6
3.3.2 Previous employment... 7
3.4 Tertiary qualifications... 8
3.4.1 Overview ... 8
3.4.2 Subjects studied at university level ... 8
3.5. The teachers of junior, middle and senior school science classes... 10
3.5.1 Overview ... 10
3.5.2 Demographics and qualifications of junior school science teachers... 11
3.5.3 Demographics and qualifications of middle school science teachers ... 13
3.5.4 Demographics and qualifications of senior school teachers... 14
3.6 Summary... 17
Chapter 4: Staffing science departments – the issues for schools... 18
4.1. The profile of science departments represented in the dataset ... 18
4.1.1 States, sectors and ARIA locations of responding schools ... 18
4.1.2 Size of science departments in responding schools... 19
4.1.3 Subjects taught at Year 11 and Year 12 levels in responding schools ... 19
4.2. The ‘supply and demand’ of qualified science teachers... 22
4.2.1 What constitutes an appropriate qualification to teach science? ... 22
4.2.2 How well is the current demand for appropriately qualified science teachers being met? ... 23
4.2.2.1 Overview ... 23
4.2.2.2 The demand for Chemistry and Physics teachers ... 24
4.2.2.3 The demand for Biology teachers... 24
4.2.2.4 The demand for Geology teachers ... 26
4.2.2.5 Availability of teachers for short-term positions ... 26
4.2.3 Heads of departments’ satisfaction with the qualifications of their existing staff... 26
4.3 Summary... 28
Chapter 5: Retaining science teachers... 29
5.1 The factors attracting the teachers in this study to a career in science teaching. ... 29
5.2 Retention of science teachers in secondary schools... 31
5.2.1 Retaining science teachers in secondary schools – the views of department heads ... 31
5.2.2 The career plans of science teachers in secondary schools – an overview ... 33
5.2.3 Comparison of the profiles of teachers with different career plans for 2009... 33
5.3 Summary... 40
Chapter 6: Attracting suitably qualified science teachers... 41
6.1 Increased salary... 42
6.2 Changing community attitudes toward science and teaching... 44
6.3 Workload issues... 45
6.4 More supportive school environment ... 46
6.5 Ongoing professional development ... 47
6.6 Summary... 48
Chapter 7: Conclusions ... 49
Appendices ... 52
List of Tables and Figures
Chapter 2: The study’s purpose and method
Box 1: Definitions of selected terms as applied within this report ... 4
Chapter 3: The demographics and qualifications of science teachers Table 3.1 Number of secondary school science teachers responding to the Science Teachers survey ... 5
Figure 3.1 Age distribution of teachers in the sample ... 6
Figure 3.2 Years of secondary school science teaching experience ... 7
Table 3.2 Average age of science teachers... 7
Table 3.3 Highest science-related tertiary qualifications held by teachers responding to this study... 8
Table 3.4 Frequencies and percentages of science teachers to have studied each of four subjects at tertiary level (for at least one year of study)... 9
Figure 3.3 Highest level of university study attained by subject... 9
Figure 3.4 Percentage of teachers in each age group to have attained at least a minor at university (for each of 3 subjects: Biology, Chemistry and Physics). ... 10
Table 3.5 Percentage of Bachelor of Education graduates studying within a Science or Education Faculty ... 10
Table 3.6 The number of respondents teaching the various combinations of junior, middle and senior school science, their average age and years of teaching experience ... 11
Figure 3.5 The percentage of teachers with either no tertiary science background or no background beyond first-year study ... 12
Table 3.7 Disciplinary backgrounds of the junior school science teachers ... 13
Table 3.8 Disciplinary backgrounds of the middle school science teachers ... 14
Figure 3.6 Age distribution of senior school Biology, Chemistry and Physics teachers. ... 15
Table 3.9 Teaching responsibilities for teachers of senior school Biology, Chemistry, Physics and Geology ... 15
Table 3.10 Disciplinary backgrounds of the senior school science teachers ... 16
Chapter 4: Staffing science departments – the issues for schools Table 4.1 Number of secondary school science departments responding to the heads of science departments survey . ... 19
Table 4.2 Number of people teaching science at the responding schools ... 20
Figure 4.1 Comparison of the average number of science teachers per school in the dataset (this survey), and nationally ... 21
Figure 4.2 Percentage of schools teaching specific science subjects in senior years. ... 21
Table 4.3 Responses from heads of secondary school science departments to the question: In your opinion, what is the minimum level of science that ought to be completed by teachers of various classes?... 23
Table 4.4 Schools reporting difficulty recruiting suitably qualified science teachers ...24
Table 4.5 Proportion of schools teaching senior school science that reported difficulty recruiting suitably qualified teachers in specific discipline areas. ...25
Table 4.6 Proportion of schools teaching senior school science that report difficulty recruiting suitably qualified Chemistry and Physics teachers, by sector. ...25
Table 4.7 Heads of secondary school science departments’ levels of satisfaction with the science qualifications of teachers at their schools ...27
Chapter 5: Retaining science teachers Table 5.1 Responses of science teachers to the question: What attracted you to the profession of teaching?...30
Figure 5.1 Schools reporting difficulty in retaining science teachers, by ARIA category ...32
Figure 5.2 Schools reporting difficulty in retaining science teachers, by sector ...32
Figure 5.3 The career plans for 2009 of teachers responding to this survey ...33
Table 5.2a Profile of the group of 626 teachers who intended to continue science teaching until at least 2009 ...34
Table 5.2b Profile of the group of 188 teachers who intended to leave the profession before 2009...34
Table 5.2c Profile of the group of 366 teachers who were undecided about their career paths ...34
Table 5.3 Career plans of respondents to the survey of science teachers, analysed by ARIA category ...35
Table 5.4 Career plans of respondents to the survey of science teachers, analysed by subjects taught ...35
Table 5.5 Responses of science teachers to the following question: What do you see as the negative aspects of your job?...37
Chapter 6: Attracting suitably qualified science teachers Table 6.1 Responses of science teachers to the question: What could be done to attract other well-qualified people to science teaching?...42
Table 6.2 Responses of heads of secondary school science departments to the question: What could be done to attract well-qualified people to science teaching?...43
Appendices Table A.1 Number of secondary school science departments responding to the heads survey ...52
Foreword
Call to Action:
The data presented in this report highlight a number of serious problems that will inhibit the growth of Australia, both economically and culturally. It is imperative that all
governments and education authorities implement rigorous workplace planning for teaching of science in schools as a matter of urgency, in order to remedy the current situation and prevent its reoccurrence. Such planning should be focused at the discipline level and not simply at the generic area of “science”. It must involve upgrading the discipline background of science teachers along with their pedagogical skills. It should be across sectors and states.
Background:
Previous commissioned surveys by the Australian Council of Deans of Science (ACDS) reported a continuing decline in enrolments in the enabling sciences and mathematics at the secondary and tertiary levels of education1. Furthermore, it is recognised that very few science graduates are selecting a teaching career 2. The Council feared that the nation was entering a cycle with the only possible outcome being a dearth of graduates with qualifications in the enabling sciences and mathematics. Certainly there would be insufficient graduates skilled in science to support the development of a knowledge-based economy.
Australia suffers from an absence of comprehensive data on the age profile of secondary school science teachers, their qualifications in the discipline areas they are required to teach and their views regarding the teaching profession. This lack of information hampered the review by Professor Kwong Lee Dow titled Australia’s Teachers:
Australia’s Future3 which looked at, among other things, future workplace needs. The ACDS strongly believes that the future of science is too important for this paucity of data to continue. Hence it commissioned this report.
Anecdotal evidence abounds concerning the number of teachers who are unqualified to teach science in particular discipline areas, but are required to do so for various reasons. The ACDS recognizes the enormous contribution of science and mathematics teachers in our schools – both at primary and secondary level. The ACDS sees this report as a basis for providing them with further support. The report should also further link science as taught at university with science as taught in the school sector.
While a preliminary attempt was made in this study to include mathematics, a number of contributing factors prevented this. It is the intention of the Council to consider
commissioning a second study concentrating on mathematics teaching once the full impact of the data reported here is realized.
The ACDS is particularly concerned about the teaching situation for the enabling
disciplines of chemistry and physics. It is clear from this study that, compared relatively to the situation for chemistry and physics, the position of biology teaching in schools is strong. Biology, and probably geology, are not far from a complete coverage by suitably qualified teachers in the senior years. This bodes well for the important and rapidly developing fields of biotechnology, nanoscience and molecular science. It is the case however, that these fields and many others in the biological sciences also require a strong foundation in chemistry and physics. The data in this report will provide a reference point to ensure the relatively benign state of biology teaching continues.
1Science at the Crossroads? A Study of trends in university science from Dawkins to now: 1989-2002 ACDS
Occasional Paper No 4, available at: http://www.acds.edu.au
2Why do a Science Degree? ACDS Occasional Paper No 2,
available at: http://www.acds.edu.au
Geology is not taught widely within Australian high schools and the information presented here confirms this. The limited availability of geology at school level may well in part be related to the demise of a number of university geology departments in the country.
Key Findings:
• Nearly 43 per cent of senior school physics teachers lacked a physics major, and one in four had not studied the subject beyond first-year. This, coupled together with the reported difficulties in attracting physics teachers (40 per cent of schools surveyed), paints an alarming picture. No matter how good their
pedagogical skills, teachers who lack knowledge in their discipline are manifestly unprepared.
• Among senior school chemistry teachers, one in four lacked a chemistry major, whereas 14 per cent of senior school biology teachers lacked a biology major.
• There is a clear preference among heads of secondary school science departments for staff with a university degree in science supplemented by an education qualification, rather than a university degree in teaching with some study in science.
• There is agreement among heads of secondary school science departments that, in future, teachers of senior science should have at least a major in the
appropriate discipline area – a view supported by the ACDS.
• There is a relatively high percentage of Year 7/8 teachers with no university exposure to any of the four surveyed disciplines: even at the senior years of schooling, up to 6 per cent of teachers have not studied these subjects beyond first year at university, if at all.
• There is concern of the heads of secondary school science departments at the difficulty in recruiting suitably qualified staff, especially in light of the age profile of existing staff: more than one third of male science teachers are at least 50 years of age.
• There is a need for early career teachers to have effective mentoring.
Recommendations:
The Australian Council of Deans of Science calls on State and Federal governments, as well as secondary and tertiary education authorities to:
1. take note of this report;
2. implement rigorous workplace planning to ensure that sufficient numbers of suitably qualified teachers of science disciplines are available to nurture future generations of school students;
3. cooperate across sectorial, State and Territory boundaries to develop a national science teacher workforce plan;
4. work with the university sector to develop international best practice in science teacher education programmes;
5. adopt minimum standards, focused on science as well as pedagogy, of qualifications for science teachers at the various levels of secondary school education;
6. in the medium term, introduce a meaningful accreditation mechanism for science teachers, involving minimum qualification levels in science as well as pedagogy.
Professor Tim Brown (President), Professor David Finlay and Professor Bill MacGillivray (Past Presidents)
Executive summary
This report examines the characteristics of teachers currently teaching science in Australian secondary schools, focussing on their level of university education in science, their age profile and their present attitudes towards their careers. The objective is to examine issues associated with the quality and supply of science teachers.
The project’s findings are based on a national survey of science teachers and heads of secondary school science departments. The survey was conducted within a carefully stratified sample of secondary schools chosen to ensure representativeness across all states and territories and across all school sectors. The project received 1207 responses from science teachers, a response rate of 40 per cent. This sample is estimated to be nine per cent of the nation’s science teachers. The project also received 266 responses from heads of science departments, a response rate of 42 per cent.
The four science disciplines examined most closely were biology, chemistry, physics and geology/earth science.
The age distribution and tertiary qualifications of science teachers
• The age profile for teachers shows a bulge of ‘baby-boomers’ in the 45-54 year age bracket that is particularly prominent for males. With the impending retirement of this generation of teachers, a shortfall in teacher supply seems likely.
• Over one third of the respondents indicated that they had been employed elsewhere before embarking on a teaching career, and one in seven had previously been employed as scientists.
• 93 per cent of the teachers surveyed were university trained, with the majority (90%) having studied science subjects in a Science Faculty rather than an Education Faculty. Heads of science departments expressed a preference, on balance, for teachers who had been prepared by Science Faculties.
• Chemistry and Biology were the most commonly and extensively studied university subjects. Far fewer respondents had studied Physics and
Geology/Earth Sciences, particularly beyond first year. This pattern was most pronounced among younger teachers.
• Fourteen per cent of respondents lacked a minor in any of the four subjects Biology, Chemistry, Physics and Geology. These teachers formed sixteen per cent of all teachers of junior school science, twelve per cent of middle school science teachers and nearly six per cent of senior school science teachers.
• Nearly eight per cent of all respondents had not studied any of the four subjects Biology, Chemistry, Physics and Geology at university. These teachers formed eight per cent of all teachers who were teaching junior science, five per cent of all teachers of middle school science and less than two per cent of all teachers of senior school science.
• Generally, the heads of science departments were satisfied with the science qualifications of the staff teaching science in their schools, but the levels of satisfaction were markedly lower for junior and middle school science than for senior school science.
Discipline-specific qualifications of senior school science teachers
• Most (90%) heads of secondary school science departments defined the minimum qualification necessary to teach senior school science classes as an undergraduate university degree with a major in the relevant discipline.
• Senior school Biology teachers were the most highly trained in their discipline. Eighty-six per cent had a major in Biology and almost 27 per cent had studied Biology to fourth-year. Only four per cent of Biology teachers had no tertiary background in the subject.
• Nearly forty-three per cent of senior school Physics teachers lacked a Physics major, and one in four had not studied the subject beyond first-year.
• One in four teachers of senior school Chemistry lacked a Chemistry major.
• Geology teachers had the lowest levels of discipline-specific qualifications. More than half of these teachers had not studied any Geology at a tertiary level.
• Compared to their older colleagues, younger teachers were more likely to have studied Biology and less likely to have studied Physics.
Supply of science teachers
• Thirty per cent of schools reported difficulty in filling vacancies for Chemistry teachers, while forty per cent had difficulty recruiting suitably qualified Physics teachers. Shortages were most acutely experienced when schools had short-term (e.g. six month) vacancies to fill.
• Catholic schools experienced the shortage of suitably qualified senior school Chemistry and Physics teachers most acutely, with two-thirds reporting difficulty recruiting Physics teachers and more than half reporting difficulty recruiting Chemistry teachers.
• Many heads of secondary school science departments believed replacing retiring staff in Chemistry and Physics would become increasingly difficult.
Retaining science teachers in the secondary school system
• One-quarter of the heads of secondary school science departments surveyed reported difficulty retaining science teachers. This difficulty was most frequently mentioned by Government schools: more than one in three heads from
Government schools expressed concern about their schools’ ability to retain staff.
• Teachers themselves reported considerable uncertainty about their career plans. This was especially true of early-career teachers and senior school Biology teachers. Nearly forty per cent of teachers with fewer than five years teaching experience and more than fifty per cent of senior school Biology teachers were unsure if they would still be teaching in five years time.
• When asked if there were aspects of the profession that they found
unsatisfactory, the overwhelming response from teachers concerned the long hours and high workloads involved. This was of particular concern to female teachers. In addition, lack of motivation on the part of students frustrated many teachers, particularly male teachers and teachers in Government schools.
Attracting new people to a career in science teaching
• The desire to share their love of science with young people was the most commonly cited motivational factor attracting the teachers surveyed to the profession of secondary school science teaching.
• Both teachers and heads of science departments believed that increased salaries were necessary in order to attract suitably qualified people to a career in science teaching. Specifically, many respondents highlighted the need for schools to offer salaries that were competitive with industry if they were to attract Science
graduates to teaching.
• One in four respondents believed that the ‘low status’ of the teachers in the wider community was a negative factor affecting recruitment of people to the teaching profession.
Conclusions
The results of this study highlight the growing need to attract more people to the study of Chemistry and Physics at tertiary level, and to provide these students with both the training and incentives to pursue teaching careers in secondary schools. Secondary schools report current and increasing difficulty in attracting and retaining suitably qualified teachers in both these disciplines. Indeed, a large proportion of current teachers of senior school Chemistry and Physics lack a major in the discipline – the minimum level of qualification deemed satisfactory by most heads of secondary school science departments. The shortage of suitably qualified science teachers is likely to be exacerbated in the coming years as the bulge of ‘baby boomers’ approach retirement age.
More broadly, the study’s findings reveal a high level of disillusionment among science teachers, evident in the ambivalence of many towards remaining in the profession. The science teachers who responded to this study had a common love of science and a desire to share this enthusiasm with young people. However, for many this commitment was being tested by long hours and high workloads. The evidence from this study is that teaching science in schools is currently considered to be a less glamorous alternative than working in industry and certainly a less financially rewarding one. This problem may well be characteristic of the teaching profession as a whole, but is perhaps of particular significance in the field of science where the lure of the opportunity to work on leading-edge developments in well-resourced environments is strong. Part of the sector’s challenge, therefore, is to raise the appeal of teaching and of teaching science in particular.
Acknowledgements
This report was prepared by Kerri-Lee Harris, Felicity Jensz and Gabrielle Baldwin of the Centre for the Study of Higher Education at the University of Melbourne. Gabrielle Baldwin directed the project. We would like to thank our CSHE colleagues Anna-Maritza Martin and Richard James for the support they have given the project and express particular gratitude to Professor David Finlay (Dean of Science, Technology and Engineering, La Trobe University), Professor William MacGillivray (Dean of Sciences, University of Southern Queensland) and Professor Tim Brown (Dean of Science, Australian National University) for their input as representatives of the nation’s Deans of Science.
The CSHE is grateful to the Australian Council for Educational Research for its selection of the national sample of schools used in the project survey. The research team would also like to thank the Australian Science Teachers Association, particularly its Executive Director Deborah Crossing, for feedback provided during the development of the questionnaires.
Special thanks must be given to the State and Territory Education Departments, Catholic Dioceses and Independent Schools who granted us permission to conduct the research. Finally, we wish to thank the science teachers and the heads of science departments in schools who took time from their busy schedules to respond to our invitation to
participate in the survey. We recognise the many demands on teachers and are indebted to the many teachers who responded to the survey with comprehensive and thoughtful comments.
Kerri-Lee Harris Felicity Jensz Gabrielle Baldwin January 2005
Chapter 1: Context of the study
In recent years there has been concern with the downturn in the number of young Australians interested in studying science and the apparent decline in the appeal of careers in science. The concern arises not only from the role that highly qualified science graduates will play in Australia’s economic, technological and social advancement, but also from the importance of ensuring a suitably high level of understanding of science within the Australian community.
The quality of science teaching in Australian secondary schools is central to nurturing scientific understanding, inquiry and enthusiasm and to laying the foundations for the education and training of future generations of Australian scientists and researchers. The importance of well qualified, committed science teachers in motivating and inspiring students hardly needs reiterating, nor does the importance of ensuring appropriate conditions and resources for the teaching of science in schools.
The academic qualifications and future supply of science teachers are now national issues. This is evident in the 2003 report Australia’s Teachers: Australia’s Future commissioned by the Department of Education, Science and Training (DEST 2003a, 2003b) and the report prepared by the Science Teachers Association of Western Australian in 2000, Review of the Quality and Supply of Science Teachers (STAWA 2000). Both reports made recommendations for ways in which the quality and supply of teachers could be improved. One suggestion was that more detailed information on the working lives of teachers and their intentions for the future should be collected (DEST 2003b, p17). With this objective in mind, and using the report prepared by the Science Teachers Association of Western Australian (STAWA 2000) as a guide, the present study sought to gather data from teachers in all states and territories, and across all school sectors.
As the present report reveals, Australia’s science teachers are a rapidly greying workforce. The projected number of retirements in the next 5-10 years and the limited flow of incoming and early career science teachers, especially in the physical sciences, are matters that require coordinated policy action. The contribution of this study is new information on the characteristics, expectations and attitudes of science teachers that might assist in the training, recruitment and retention of future teachers. The project’s findings are presented around three themes:
• the demographics and qualifications of the teachers currently teaching science in secondary schools (Chapter 3);
• the growing issues for schools in staffing science subjects (Chapter 4), and;
• the difficulties faced by schools in attracting and retaining science teachers (Chapter 5).
Chapter 2: The study’s purpose and method
2.1 Purpose
The aims of this research project were to investigate whether or not shortages exist in the availability of science teachers in Australia, to explore the future of secondary science teaching in light of the supply and demand of science teachers, and to examine the circumstances that are needed to attract and retain suitably qualified science teachers.
The study was informed by the recent review, Australia’s Teachers: Australia’s Future, chaired by Professor Kwong Lee Dow, that called for the collection of comprehensive statistics relating to teachers, teacher workforce trends and teacher education, noting in particular a gap in the information available on specific fields (DEST 2003a, p96). The review recommended that research be undertaken on the working lives of teachers, their intentions and motivations, and the ways in which conditions of schooling and
employment might enhance the attractiveness of careers in teaching. The current study, through the information collected from heads of secondary school science departments and science teachers, contributes important new information on these issues.
The project examined the following questions:
1. To what extent are secondary science subjects being taught by teachers appropriately qualified in those disciplines?
2. Do the age profile and career plans of current science teachers provide any indications about the supply of appropriately qualified teachers in the future? 3. What factors influence teachers positively or negatively about science teaching
as a profession?
4. What are the opportunities for attracting people to a career in science teaching?
2.2 Methodology
The methodology of the study involved two questionnaire-based surveys that were mailed to:
• heads of science departments in secondary schools
• science teachers in secondary schools
Data from the returned surveys were coded and analysed using SPSS. Responses to the open questions were also coded and are incorporated as direct quotes in the report as appropriate. Further details of the methodology, including details of sample selection, design of the questionnaire, and comments on methodological issues, are included as appendices to this report.
Permission to approach schools was requested in writing from the relevant governing bodies of schools within each state, territory or diocese. All governing bodies, with the exception of the Education Policy and Planning Section of the ACT, granted permission to survey their staff. Independent schools were approached individually.
Schools were selected from a stratified random sample of secondary schools across Australia. The specification of the sampling method, prepared by the Australian Council for Educational Research, included all eight states and territories, all geographical areas (highly accessible, accessible, moderately accessible, remote and very remote), the three school sectors (Government, Catholic and Independent) and all socioeconomic
sectors (high, medium and low socio-economic regions as defined by the ABS postcode classification).
2.2.1 Heads of science departments survey
The survey of the heads of science departments was designed to elicit information on:
• the number of science teachers in the school;
• the science units offered and, if appropriate, the reasons for not offering units;
• the heads’ views on the appropriateness of the science qualifications of the science teachers at their school;
• the heads’ views on the minimum level of university science background that a teacher ought to have completed to be equipped to teach science at various year levels;
• the perceived differences, if any, between teachers prepared by Education Faculties and by Science Faculties;
• the recruitment and retention of science teachers, and
• views and suggestions on strategies and possibilities for attracting appropriately qualified people to science teaching.
The questionnaires were individually tailored to include the specific science subjects taught within the curriculum of each state and territory. Specifically, each science subject taught at the year 11 or 12 level within a particular state or territory was listed on the questionnaire for that state or territory. However, the overall structure of the
questionnaires was the same for all states and territories.
The initial letters of invitation to participate in the survey were sent to the heads of science departments via the Principals of their schools. Permission for involvement of the school was then assumed if the Principal passed the questionnaire on to the Head of the science department.
The overall response rate to the questionnaires mailed to the heads of science departments was 42.3 per cent (n=266/629).
2.2.2 Science teachers survey
As with the survey of the heads of science departments, the questionnaires for the science teachers were tailored to reflect the science curriculum of each state or territory, resulting in eight distinct questionnaires. However, the overall structure of the
questionnaires was again the same for all states and territories. The survey was designed to elicit information on:
• the science subjects taught by the respondent;
• the highest tertiary education qualifications of the respondent;
• the specific science subjects studied at university and whether these subjects were taught by Science or Education Faculties;
• sex and age;
• previous employment;
• number of years experience as a secondary school teacher;
• career plans for 2009 (i.e. five years from the date of the survey);
• initial factors that attracted the respondent to the profession;
• any dissatisfying aspects of their teaching position, and
• views on the possible ways for attracting appropriately qualified people to science teaching.
Box 1: Definitions of selected terms as applied within this report
School: a school or college within the secondary education sector.
Year groups within secondary schools
Junior school: year levels 7 and 8
Middle school: year levels 9 and 10
Senior school: year levels 11 and 12
Teachers
Junior school teachers: teachers of junior school science classes (who may also teach
science at other year levels)
Middle school teachers: teachers of middle school science classes (who may also teach
science at other year levels)
Senior school teachers: teachers of senior school classes in Biology, Chemistry,
Physics or Geology (who may also teach other year levels and/or other senior school subjects)
School subjects
Biology: All curricula included a subject called ‘Biology’. Additional biology-related
subjects (e.g. Human Biology in Western Australian schools; Psychology in Victorian schools)
were not included in this study’s analysis of Biology teaching.
Physics: All curricula included a subject called ‘Physics’. Additional physics-related
subjects (e.g. Physical Science in Tasmanian schools) were not included in this study’s analysis of Physics teaching.
Chemistry: All curricula included a subject called ‘Chemistry’. Additional
chemistry-related subjects (e.g. Environmental Science in Tasmanian schools) were not included in this study’s analysis of Chemistry teaching.
Geology: Most curricula included an earth science related subject called ‘Geology’,
‘Earth Science’ (QLD) or ‘Earth & Environmental Science’ (NSW), and these are collectively referred to as ‘Geology’ in this study. The curricula of Victoria and Tasmania, however, included no such subjects. ‘Environmental Science’ (Vic, Tas) was not included in this study’s analysis of Geology teaching.
Physical science(s) refers collectively to Chemistry, Physics and Geology as defined
above. Qualifications
Qualification: the highest science-related post-secondary academic qualifications
attained by the respondent.
Minor: a subject area studied to and including second-year level at university, but not
beyond.
Major: a subject area studied to and including third-year level at university, or further (e.g. Honours).
The definitions of minor and major apply to all university qualifications, irrespective of whether the respondent studied the science subjects within a Science Faculty or an Education Faculty.
Chapter 3: The demographics and qualifications of science teachers
This chapter presents an overview of the demographic characteristics of the 1207 teachers who responded to the survey. After presenting data on the distribution of age and gender (Section 3.2), number of years of teaching experience (Section 3.3) and the tertiary qualifications of the respondents (Section 3.4), Section 3.5 describes the level of science qualifications obtained by teachers in the subject areas for which they have responsibility. Much of the analysis is based on the distinction between the three school levels described previously (Box 1; ‘junior’, ‘middle’ and ‘senior’), with some analysis of differences across state/territories and by school sector.
3.1 Location and sector representation
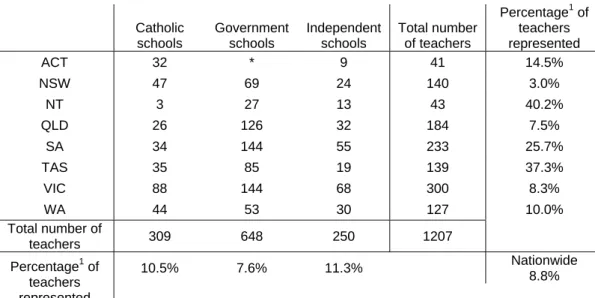
Response to the survey of teachers was received from all eight states and territories (Table 3.1). The three sectors (Catholic, Government and Independent) were included, with the exception of the ACT Government school sector where permission to survey the schools was declined by the Territory government. The 1207 respondents represent nearly nine per cent of all science teachers in Australia.
There was significant variation in the proportion of representation from different states and territories, ranging from three per cent of NSW teachers to forty per cent of those in the Northern Territory (Table 3.1). This was due to the sampling strategy employed, a strategy designed to ensure adequate representation from the smaller states/territories
(see Appendix 1). The sample was more evenly distributed across sectors, ranging from 7.6 per cent of Government schools to 11.3 per cent of Independent schools (Table 3.1).
Table 3.1 Number of secondary school science teachers responding to the Science Teachers survey, grouped by state and sector.
Catholic schools Government schools Independent schools Total number of teachers Percentage1 of teachers represented ACT 32 * 9 41 14.5% NSW 47 69 24 140 3.0% NT 3 27 13 43 40.2% QLD 26 126 32 184 7.5% SA 34 144 55 233 25.7% TAS 35 85 19 139 37.3% VIC 88 144 68 300 8.3% WA 44 53 30 127 10.0% Total number of teachers 309 648 250 1207 10.5% 7.6% 11.3% Nationwide 8.8% Percentage1 of teachers represented
*ACT Government declined permission for the involvement of government schools in this study
1
estimate, based on ACER figures for the total number of teachers in each state or sector
A large majority of respondents (90%) worked within schools that were classified as either ‘highly accessible’ or ‘accessible’ on the ARIA coding system for geographical locations (see Appendix 2). This is in accordance with the pattern of population distribution across Australia, as 94 per cent of the nation’s population reside within these locations.
3.2 Gender and age representation
Nationally, male respondents outnumbered female respondents (53.5% and 46.5% respectively). However, there were differences in the gender-balance of responses by state and territory. Females formed two-thirds of the ACT and Northern Territory cohorts, but only around forty per cent of the respondents from each of South Australia and Western Australia. Nor did responses from the three sectors match the overall pattern, with female respondents forming 54 per cent of the Catholic school sample (Chi-square: 7.22 P<0.05).
The mean age of respondents was 41 years with no difference between the three sectors. Between states there was a slight difference in age distribution, with teachers from the ACT and Tasmania being the eldest at an average age of 44 years. Teachers from Queensland and Western Australia were on average 40 years of age.
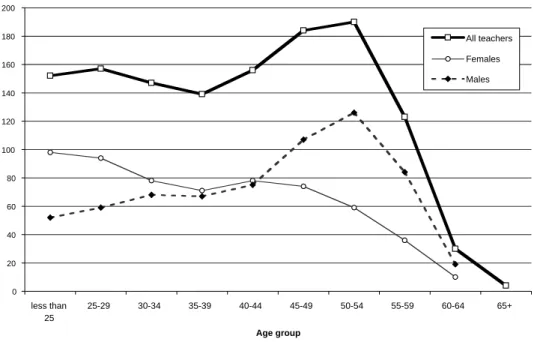
The male respondents were typically older than female respondents (mean ages of 44 and 39, respectively; Fig. 3.1). Thirty-seven per cent of male respondents were at least fifty years of age, compared to nineteen per cent of female respondents in this age bracket. Conversely, one-quarter of all female respondents were less than 30 years of age, compared to only thirteen per cent of males in this youngest age group.
0 20 40 60 80 100 120 140 160 180 200 less than 25 25-29 30-34 35-39 40-44 45-49 50-54 55-59 60-64 65+ Age group Number of teachers All teachers Females Males
Figure 3.1 Age distribution of teachers in the sample (overall and by sex)
The ‘less than 25’ and ‘65+’ age groups have been adjusted to take account of the differing width of these age bands.
3.3 Employment histories
3.3.1 Years of employment
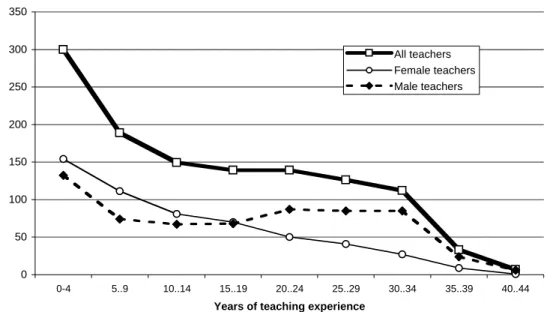
The science teachers in the sample had taught, on average, for 15 years. The mean period of service for male teachers was 17 years, which was five years longer than the average period of teaching for female teachers (Fig. 3.2). The average period of service for teachers in ‘highly accessible’ and ‘accessible’ areas was on par with the national average. However, teachers from less accessible locations had taught for only 11 years on average. Although there was no difference between sectors, there was a difference in
the average length of service between states. Teachers in Tasmania and New South Wales had taught on average the longest at 17 years, with teachers in the Northern Territory being slightly under the national average at 12 years of service.
0 50 100 150 200 250 300 350 0-4 5..9 10..14 15..19 20..24 25..29 30..34 35..39 40..44
Years of teaching experience Number of teachers
All teachers Female teachers Male teachers
Figure 3.2 Years of secondary school science teaching experience
In the first ten years of employment, female teachers were slightly younger than their male colleagues (Table 3.2), suggesting that males start teaching at a later age than females.
Table 3.2 Average age of science teachers (by years employed and gender)
Average age (years)
<3 yrs exp. 3-4 yrs exp. 5-9 yrs exp. 10-14 yrs exp. 15-19 yrs exp. 20-24 yrs exp. 25-29 yrs exp. 30-34 yrs exp. 35-39 yrs exp. >39 yrs exp. Overall mean age All teachers 30 33 35 39 43 49 51 54 58 62 41 Female teachers 28 31 34 39 43 48 51 55 58 62 39 Male teachers 32 33 36 39 44 49 51 54 58 62 44 3.3.2 Previous employment
Over one third of the respondents (n=430/1207) indicated that they had been employed elsewhere before embarking on a teaching career. Forty per cent of these teachers had been employed as scientists, with no significant gender difference (48.2% females and 51.8% males). The remainder listed non-professional employment (33%), engineering (6%) or one of a range of other professions (20%) as their previous occupation.
3.4 Tertiary qualifications
3.4.1 Overview
The overwhelming majority (93%) of the respondents were university trained. Of those who specified the institution, the majority (78%) were graduates from Australian universities. Only nine per cent of the university-trained teachers had studied for their degrees at an overseas institution.
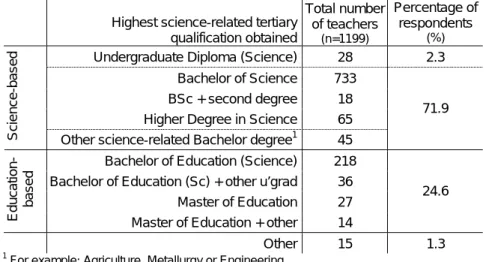
Most respondents held ‘science-based’ degrees (72%). Only a small proportion (5%) had completed postgraduate study in the Sciences (Table 3.3). ‘Bachelor of Education’ graduates were also well represented in the study (21%), with a further four per cent holding Masters degrees in Education. This pattern was consistent across gender and across the three sectors (Catholic, Government and Independent), with the exception that teachers with higher degrees in Science were concentrated in the Independent school sector. While Independent-school teachers represented only 21 per cent of the sample, they employed 33 per cent of those with higher degrees in science (Chi-square: 8.27 P<0.05).
Table 3.3 Highest science-related tertiary qualifications held by teachers responding to this study.
Highest science-related tertiary qualification obtained Total number of teachers (n=1199) Percentage of respondents (%)
Undergraduate Diploma (Science) 28 2.3
Bachelor of Science 733 BSc + second degree 18 Higher Degree in Science 65
Scienc
e-bas
ed
Other science-related Bachelor degree1 45
71.9
Bachelor of Education (Science) 218 Bachelor of Education (Sc) + other u’grad 36
Master of Education 27
Educati
on-base
d
Master of Education + other 14
24.6
Other 15 1.3
1
For example: Agriculture, Metallurgy or Engineering
3.4.2 Subjects studied at university level
The majority of respondents to the survey (85%) held either a minor or major in at least one of the following subject areas: Biology, Chemistry, Physics or Geology.
Chemistry and Biology were the subjects most commonly included in the tertiary degrees of respondents (78% and 71% respectively) (Table 3.4; Fig. 3.3), with more than sixty per cent of respondents having studied both disciplines. Physics was studied by more than sixty per cent of the survey group, but half of these teachers had only studied the subject in first year (Table 3.4). Figure 3.3 illustrates this pronounced difference between discipline-specific qualifications when the level of study is also considered. Forty-five per cent of all teachers surveyed held a major in Biology, and one in three held a major in Chemistry. In contrast, just 17 per cent of the teachers surveyed were similarly qualified in Physics. Geology was studied by still fewer respondents (Table 3.4; Fig. 3.3). Only one in four of the teachers surveyed had studied any tertiary-level Geology, and just eight per cent had studied the subject beyond second year.
Table 3.4 Frequencies and percentages of science teachers to have studied each of four subjects at tertiary level (for at least one year of study).
Number and percentage of respondents
(teachers; n=1207) to have studied each of four principal subject areas at university
Biology Chemistry Physics Geology Number of teachers 861 945 736 311 Percentage of sample (%) 71.3 78.3 60.1 25.8 0% 10% 20% 30% 40% 50% 60% 70% 80% 90%
Subject studied at university Proportion of teachers (n=1207) four+ years three years two years one year four+ years 14.0% 9.0% 5.7% 2.0% three years 31.2% 24.5% 11.2% 6.2% two years 8.8% 18.0% 12.3% 3.8% one year 17.3% 26.7% 31.7% 13.8%
Biology Chemistry Physics Geology
Figure 3.3 Highest level of university study attained by subject
Eight per cent of respondents had studied none of these four subjects at tertiary level. Of this group, most (90%) taught junior and/or middle school science only (discussed further in Section 3.5).
Compared to their older colleagues, younger teachers were more likely to have studied Biology and less likely to have studied Physics (Fig. 3.4). Of the 231 respondents under the age of thirty years, more than sixty per cent had studied Biology to at least second year at university and nearly fifty per cent held a Biology major. However, only sixteen per cent of the teachers under 30 years of age had studied Physics beyond first year at university. In contrast, less than half the 345 respondents over fifty years of age had studied Biology beyond first year, while almost one third of these older teachers had studied Physics to second year or beyond.
Most of the tertiary science subjects studied by the surveyed teachers were taught within Science Faculties (90%). However, those teachers with Bachelor of Education
qualifications were less likely to have studied in Science Faculties (Table 3.5). More than one-third of the science subjects studied by this group were taught within Education Faculties.
0% 10% 20% 30% 40% 50% 60% 70% <30 30 to 39 40 to 49 50 or more years of age
percentage of age group
Biology Chemistry Physics
Figure 3.4 Percentage of teachers in each age group to have attained at least a minor at university (for each of 3 subjects: Biology, Chemistry and Physics).
Table 3.5 Percentage of Bachelor of Education graduates studying within a Science or Education Faculty (over four science subjects)
3.5. The teachers of junior, middle and senior school science classes
3.5.1 Overview
This section provides a description of the science teachers surveyed, grouped on the basis of the year levels that they taught: junior, middle and/or senior school (Table 3.6; Figs. 3.5a, 3.5b). As the discipline-specific analysis is confined to four principal subject areas (see Section 2.1), the senior school category includes only four ‘subjects’: Biology, Chemistry, Physics and Geology.
Faculty Biology (n=149) % Chemistry (n=130) % Physics (n=108) % Geology (n=63) % Science 55.0 56.9 50.0 54.0 Education 34.9 36.2 38.0 41.3 Science & Education 10.1 6.9 12.0 4.8
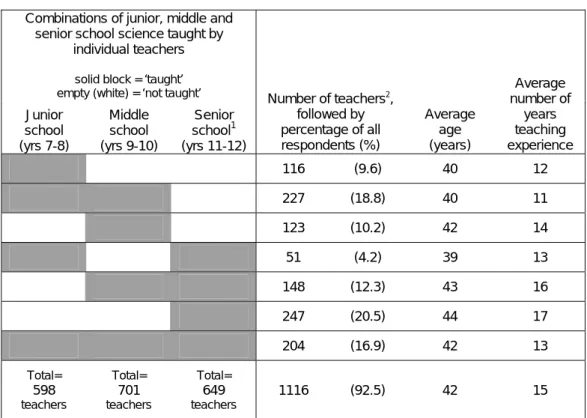
Table 3.6 The number of respondents teaching the various combinations of junior, middle and senior school science, their average age and years of teaching experience
Combinations of junior, middle and senior school science taught by
individual teachers
solid block = ‘taught’ empty (white) = ‘not taught’
Junior school (yrs 7-8) Middle school (yrs 9-10) Senior school1 (yrs 11-12) Number of teachers2, followed by percentage of all respondents (%) Average age (years) Average number of years teaching experience 116 (9.6) 40 12 227 (18.8) 40 11 123 (10.2) 42 14 51 (4.2) 39 13 148 (12.3) 43 16 247 (20.5) 44 17 204 (16.9) 42 13 Total= 598 teachers Total= 701 teachers Total= 649 teachers 1116 (92.5) 42 15 1
Four subjects only were included: Biology, Chemistry, Physics and Geology.
2
The 91 respondents who taught only senior school science subjects other than Biology, Chemistry, Physics or Geology were not included in this table.
3.5.2 Demographics and qualifications of junior school science teachers
Nearly half of the respondents taught junior school science (Table 3.6) and 52% of this group were female, a significant difference to the overall gender distribution of the survey group (Chi-square: 10.71 P<0.01). The average age of those teaching junior school was the same as the group as a whole, but these teachers were on average slightly less experienced (13 years, compared to 15 years; Table 3.6).
The qualifications of the junior school science teachers were similar to those of teachers overall, with 61 per cent having attained a Bachelor of Science degree, 19 per cent a Bachelor of Education and 7 per cent a science-related degree. Twenty of the junior school science teachers held a Higher Degree in Science.
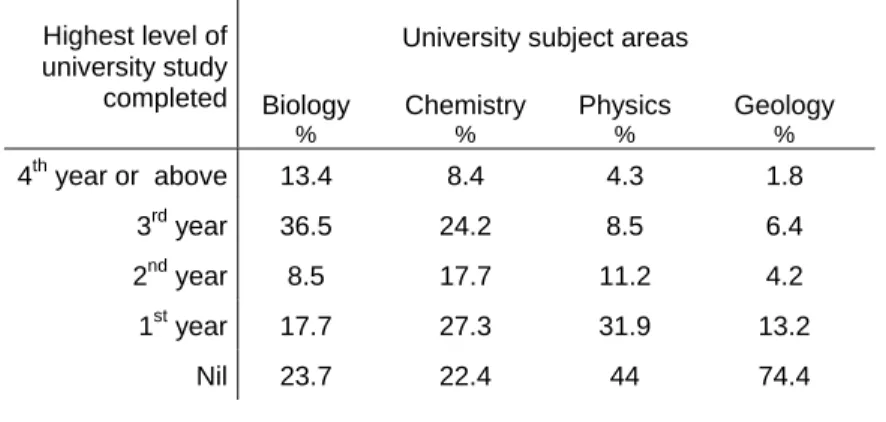
Biology and Chemistry were the predominant disciplinary backgrounds among the junior school science teachers (Table 3.7). Half the teachers held a major in Biology, while one-third held a major in Chemistry. Fifteen per cent had both qualifications. In contrast, only a minority of the teachers had studied Physics or Geology beyond first year (24% and 12%, respectively).
Sixteen per cent of the junior school science teachers had not studied any of the four science disciplines discussed beyond first year at university, and half of these teachers had not studied the subjects at university at all (Fig. 3.5a).
0.0% 5.0% 10.0% 15.0% 20.0% 25.0% 30.0% 35.0% 40.0%
Combination of year levels taught
Percentage
With only first year science* subjects at tertiary level
With no science* subjects at tertiary level
With only first year science* subjects at tertiary level
12.9% 8.4% 11.4% 2.0% 2.0% 4.0% 5.9%
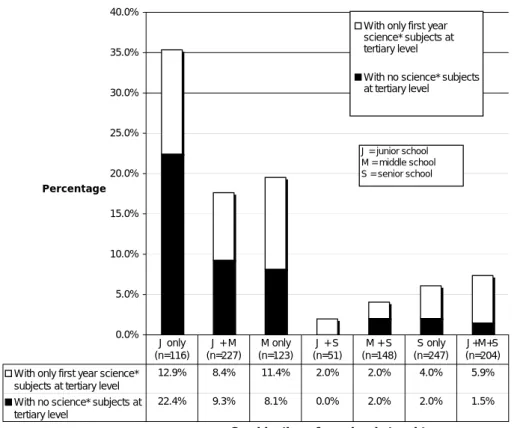
With no science* subjects at tertiary level 22.4% 9.3% 8.1% 0.0% 2.0% 2.0% 1.5% J only (n=116) J + M (n=227) M only (n=123) J + S (n=51) M + S (n=148) S only (n=247) J+M+S (n=204) J = junior school M = middle school S = senior school
Figure 3.5a The percentage of teachers with either no tertiary science* background or no background beyond first-year study, presented as all, junior, middle and senior school science teachers.
* ‘Science’ here refers only to the four subjects Biology, Chemistry, Physics and Geology.
0.0% 2.0% 4.0% 6.0% 8.0% 10.0% 12.0% 14.0% 16.0% 18.0%
Year level taught
Percentage
With only first year science* subjects at tertiary level *With no science subjects at tertiary level
With only first year science* subjects at tertiary level
6.5% 7.9% 6.8% 4.0% With no science* subjects at
tertiary level 7.8% 8.4% 5.3% 1.7% Overall (n=1207) Junior school (n=598) Middle school (n=701) Senior school (n=649)
Figure 3.5b The percentage of teachers with either no tertiary science* background or no background beyond first-year study, presented by the combination of year levels taught. * ‘Science’ here refers only to the four subjects Biology, Chemistry, Physics and Geology.
Table 3.7 Disciplinary backgrounds of the junior school science teachers (n=598)
University subject areas Highest level of university study completed Biology % Chemistry % Physics % Geology % 4th year or above 13.4 8.4 4.3 1.8 3rd year 36.5 24.2 8.5 6.4 2ndyear 8.5 17.7 11.2 4.2 1styear 17.7 27.3 31.9 13.2 Nil 23.7 22.4 44 74.4
Nearly ten per cent of all respondents to the survey of teachers taught only junior school science (Table 3.6). The gender and experience profile of this group was significantly different to the national average. Females were over-represented (56%, compared to <47% overall; Chi-square: 3.87 p<0.05) and almost one third of the group had been teaching for fewer than three years. Nearly one in four had not studied Biology,
Chemistry, Physics or Geology at university (Fig. 3.5b) and a further thirteen per cent of the group had studied one or more of these subjects, but only to first year level.
3.5.3 Demographics and qualifications of middle school science teachers
The demographics of Years 9 and 10 science teachers closely resembled those of the sample overall (Table 3.6). The average age of these 701 respondents was 41 years and the average number of years they had been employed as teachers was 14. The gender distribution was 52 per cent male and 46 per cent female.
The qualifications of this group also most closely matched those of the sample overall (see Table 3.3). Nearly seventy per cent held a Bachelor of Science degree, and twenty per cent a Bachelor of Education. Another six per cent of the group held Bachelor degrees in other, science-related disciplines. Seven per cent had obtained a
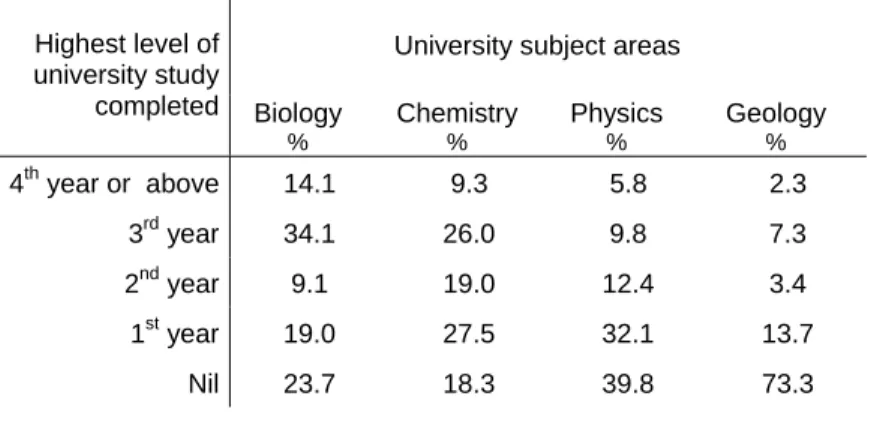
postgraduate degree in Science. The majority (88%) held either a minor or major in at least one of the following four subject areas: Biology, Chemistry, Physics or Geology. Almost half of middle school science teachers had a major in Biology, one third a major in Chemistry and just over 15 per cent a major in Physics (Table 3.8). Less than ten per cent of the middle school teachers had a major in Geology.
Twelve per cent of the middle school teachers had not studied any of the four science disciplines discussed beyond first year at university, and nearly half of these teachers had not studied the subjects at university at all (Fig.3.5a).
Table 3.8 Disciplinary backgrounds of the middle school science teachers (n=701)
University subject areas Highest level of university study completed Biology % Chemistry % Physics % Geology % 4th year or above 14.1 9.3 5.8 2.3 3rd year 34.1 26.0 9.8 7.3 2nd year 9.1 19.0 12.4 3.4 1st year 19.0 27.5 32.1 13.7 Nil 23.7 18.3 39.8 73.3
3.5.4 Demographics and qualifications of senior school teachers
The 649 teachers of senior school Biology, Chemistry, Physics and/or Geology (Table 3.6) were typically male (58%) and both older (43 years of age) and more experienced (16 years experience) than those teachers who taught only Years 7 to 10. Nearly forty per cent of the teachers of senior school science did not teach science in junior or middle school, while another 31 per cent taught at all three ‘year’ levels (Table 3.6).
The age distribution for the teachers of senior school Biology, Chemistry and Physics is presented in Figure 3.6. Although the mean age of Chemistry teachers was just three years above the national average at 44 years of age, there were a large proportion of Chemistry teachers who would soon be retiring (Fig. 3.6). Geology teachers were on average the eldest, with a mean age of 47 years. However, this cohort was small and for this reason is not represented in Figure 3.6.
Most teachers in this group taught in only one of the four senior subjects investigated: Biology, Chemistry, Physics or Geology (Table 3.9). The most ‘restricted’ were the Biology teachers, 83 per cent of whom taught no senior Physics, Chemistry or Geology classes. In contrast, most Geology teachers were less ‘specialised’ in that they were also involved in teaching senior Biology, Chemistry or Physics.
The overall tertiary qualifications of this group was similar to the national average, with 65 per cent holding a Bachelor of Science, 14.5 per cent a Bachelor of Education and 7.5 per cent a Higher Degree in Science.
Nearly six per cent of the senior school teachers had not studied any of Biology, Chemistry, Physics or Geology beyond first year at university. Only eleven of this group (<2%) had not studied these subjects at university at all (Fig. 3.5a).
0 10 20 30 40 50 60 less than 25 25-29 30-34 35-39 40-44 45-49 50-54 55-59 60-64 65+ Age groups Number of teachers Senior Biology Senior Chemistry Senior Physics
Figure 3.6 Age distribution of senior school Biology, Chemistry and Physics teachers.
The ‘less than 25’ and ‘65+’ age groups have been adjusted to take account of the differing width of these age bands.
Table 3.9 Teaching responsibilities for teachers of senior school Biology, Chemistry, Physics and Geology
Biology (n=255 teachers) Chemistry (n=260 teachers) Physics (n=209 teachers) Geology (n=36 teachers) Percentage who taught in none of the other three subject areas 83.1 66.2 74.2 30.1 Both Years 11&12 (%) 36.5 43.5 43.5 44.4 Year 11 only (%) 40.0 29.6 23.0 36.0 Year 12 only (%) 23.5 26.9 33.5 19.4
The teachers of Biology were the most highly trained in their specific discipline (Table 3.10). Eighty-six per cent held a major in Biology and 28 per cent had studied to fourth-year. Only four per cent of Biology teachers had no tertiary background in the subject. Teachers of Chemistry also tended to have a strong background in the discipline, 73 per cent having a major in Chemistry (Table 3.10). As with the Biology teachers, very few teachers of Chemistry lacked any discipline-specific tertiary background.
Physics teachers responding to the survey were less highly qualified in the discipline than were the Biology and Chemistry teachers (Table 3.10). Fifty-seven per cent had a major in Physics, while one in four had not studied the subject beyond first-year at university.
Table 3.10 Disciplinary backgrounds of the senior school science teachers
Subject taught in senior secondary school Biology (n=255) Chemistry (n=260) Physics (n=209) Geology (n=36) Highest level of university study completed Year 11 % (n=195) Year 12 % (n=153) Year 11 % (n=190) Year 12 % (n=183) Year 11 % (n=161) Year 12 % (n=139) Year 11 % (n=23) Year 12 % (n=29) 4th year or above 31.3 27.6 22.1 24.0 23.0 28.1 17.4 13.8 3rdyear 49.2 56.6 52.1 51.9 35.4 33.8 21.7 13.8 2nd year 6.7 4.6 14.7 13.1 17.4 14.4 4.3 3.4 1styear 8.7 6.6 6.8 7.7 15.5 18.7 4.3 13.8 Nil 4.1 4.6 4.2 3.3 8.7 5.0 52.2 55.2
Geology teachers had the lowest levels of discipline-specific qualifications (Table 3.10). More than half of these teachers had not studied any Geology at a tertiary level. The number of teachers teaching Geology, however, is a very small proportion of the total sample.
The overall proportions of ‘suitably qualified’ science teachers
There is no single definition of the discipline-specific science background necessary for teachers of senior school science subjects. However, most of the heads of science departments surveyed defined a major in the discipline as the minimum satisfactory level of tertiary study. A smaller proportion believed that a minor was satisfactory. These results are discussed in more detail in Chapter 4.
If a minor in a subject is taken to be the base level of science desirable for teaching senior school science, then there appear to be significant shortages nationally in the number of suitably qualified Geology teachers (64% of Geology teachers having neither a minor or major in the subject) and Physics teachers (26% of Physics teachers having neither a minor or major in the subject) (Table 3.10). For Biology (13%) and Chemistry (12%) the proportion of not suitably qualified teachers was much smaller.
Alternatively, if a major in a subject is taken to be the base level of science desirable for teaching senior school science (see also Table 4.3), then at least twenty per cent of teachers in all four subjects areas were not adequately qualified to teach at senior school level. Biology teachers were the most suitably qualified group, with only one in five senior school Biology teachers having a minor or less in the area (Table 3.10). More than one-quarter of Chemistry teachers, 43 per cent of Physics teachers, and well over half of Geology teachers had not studied the subject beyond second year at university.
‘Other’ senior science subjects
Aside from the four senior science subject areas that this report focuses upon (Biology, Chemistry, Physics and Geology), there were a range of other science-related subjects offered across the country. For this reason, quite a large number of the teachers surveyed reported teaching senior school science and yet were not included in the preceding analysis. When the full range of senior science subjects are considered, more than two-thirds of all respondents taught at senior school level and almost a third of the all respondents taught only at senior school level. Of this group, 61 per cent were male. The average number of science subjects that senior school teachers taught was 1.8 (n=1447/816, range 1-7).
3.6 Summary
The 1207 respondents to the survey of teachers represent an estimated nine per cent of the nation’s science teachers. Their average age was 41 years and the average number of years employed in the teaching profession was 15 years.
The majority of the cohort was university trained, and over half of the respondents held a Bachelor of Science degree. A further twenty per cent of the group held a Bachelor of Education, and a small proportion (5%) had obtained Higher Degrees in Science. Within their university degrees, the majority of teachers had studied Chemistry and Biology at some level at university. The discipline in which the largest proportion of the respondents had obtained the highest level of study was Biology, with a fifth of the respondents having studied this subject beyond third year at university.
Senior school Biology teachers were the group with the highest tertiary-level qualifications specific to their discipline. In contrast, one quarter of the senior school Physics teachers and well over half the senior school Geology teachers had not studied the respective subjects beyond first year. Ten per cent of the respondents taught Years 7 and 8 Science only, and nearly one-quarter of this group had not studied Biology,
Chapter 4: Staffing science departments – the issues for schools
This chapter examines the views of heads of secondary school science departments regarding the supply and quality of science teachers. It was assumed that at most schools the Head of Department would be in a good position to comment upon the availability of well-qualified teaching staff and so the project asked heads the following questions:
• Doesyour school have difficulty recruiting suitably qualified science teachers?
• Are there any science teachers at your school currently teaching in subject areas other than those for which they are qualified?
We examined how the respondents defined ‘qualified’ by asking them to specify the minimum level of university science study that they believed necessary for teachers of particular year levels.
Section 4.1 of this chapter describes the broad characteristics of school departments represented in the sample.
Section 4.2 examines the supply and qualifications of science teachers. In summary:
• Half of the department heads recognised a distinction between science subjects taught through university Science and Education Faculties. Although there are advocates for each, more heads favoured Science Faculties in terms of suitably preparing graduates for secondary school science teaching.
• There was near consensus that in order to teach senior year science subjects, secondary school teachers must have a strong background (an undergraduate minor or major) in the discipline concerned.
• Chemistry and Physics teachers were in short supply, but there was an adequate supply of Biology teachers.
• Filling short-term positions, such as the vacancies created when staff members take long-service leave, was a prominent concern for heads of science
departments.
Related to the issues of teacher training and availability are the issues of attracting well-qualified people to science teaching in the first place, and subsequently retaining those people within the school system. These topics are explored in Chapter 5.
4.1. The profile of science departments represented in the dataset
4.1.1 States, sectors and ARIA locations of responding schools
Responses to the survey were received from the heads of 266 secondary school science departments. This represents ten per cent of Australian secondary schools, and a response rate of 42 per cent. Each of the eight states and territories were represented (Table 4.1).
There was no significant difference in the response rate between the states. However, representation by state does not directly reflect state population size due to the design of the sample, which was constructed to ensure adequate numbers of responses from the territories and smaller states (see Appendix 1). For example, for New South Wales fewer than four per cent of the state’s schools were sampled (Table 4.1). In contrast, the Northern Territory, Tasmania and South Australia were all somewhat over-represented. Included in the sample were the three recognised sectors of Australian schools: Catholic, Government and Independent. While both Catholic and Independent schools were well represented, more than half of the responses received were from Government schools (Table 4.1). This directly reflects the size of each sector nationally.
Table 4.1 Number of secondary school science departments responding to the heads of science departments survey, grouped by state and sector.
Catholic schools Government schools Independent schools Total number of schools Percentage1 of schools in the state/territory ACT 5 * 2 7 16.7% NSW 8 16 6 30 3.6% NT 1 13 4 18 37.5% QLD 9 30 9 48 10.2% SA 5 32 13 50 23.0% TAS 3 21 6 30 28.0% VIC 10 21 10 41 6.9% WA 10 21 11 42 13.3% Total number of schools 51 154 61 266 10.6% 10.4% 9.1% 10.1% nationwide Percentage1 of schools in the sector
*ACT Government declined permission for the involvement of government schools in this study.
1
based upon ACER figures for the total number of schools in each state or sector
The location indices of schools in the sample loosely reflect the pattern of population distribution across the country (see Appendix 3). Most (82%) of the schools sampled are classified as either ‘highly accessible’ or ‘accessible’ under the ARIA system (see Appendix 2).
4.1.2 Size of science departments in responding schools
The size of science departments represented ranged from single-teacher departments (n=14) to one South Australian school with 30 science teachers (Table 4.2). The average was eight science teachers per school, and three-quarters of the science departments had no more than ten identified science teachers. These figures are fifty per cent higher than the estimates provided by ACER (Fig. 4.1). One possible explanation is that large departments are over represented in the dataset. Alternatively, the definition of ‘science teachers’ used by ACER and that applied by heads of departments might differ. It is worth noting that the concept of a discrete Science Department is not relevant in all school contexts. For example, the respondents from two ‘very remote’ Northern Territory schools commented that at their schools all secondary teachers taught all subjects.
4.1.3 Subjects taught at Year 11 and Year 12 levels in responding schools
Eighty per cent of the 266 schools responding to the survey taught year 11 and year 12 students. Five additional schools offered only one of the two senior years in 2004. Four of these schools were developing their senior school programs and offered only year 11, and the fifth was phasing out senior school teaching and therefore offered only year 12. Collectively, these 219 schools are referred to as ‘senior schools’ in the following analysis.