. IA-UR- gs-zszl
I
-:
INsT~~LITIEs submittedto: > ...., .,, ..t-,’.-1tLosAlamos
NATIONAL LABORATORY RADIATION OUTPUTIN FOIL IMPLOSIONS AND THE EFFECT ON
FI. Oona, D.L. Peterson, J.H. Goforth, M.L. Yapuncich,
C. Findley, E. Lopez, J. Benage~ G. Idzorek,
J.C. Cochrane, B. Anderson, J. SMachter
10th IEEE International Pulsed Power Conference
— .—. —.-—— - —..— —. -_—— .—..-——..—.._ —. _ —.—. ..—. .- —.. ———.—- ..-—-.—.—..’ ...-— —.— -.— -. ..-. -————————— _ —. .=.--—:_ .:=: ; ~-.+- —----——— ---.-.-.—- ——. — .—. — -——————=. ————— -—— - ++a-=-=...=-.---——”-”=——--=.s: _—_..=...=-.—~.-,-TT ----. —-- -: ——. — --.-
.-Los AlarMs National IAorahwy, an aWlrrnativaacXwVequal ~unlty errqztoyer, is qatad by Iha UniversMy of California Ior the U.S. Oaparimenl of Energy
und~.r mnSrad W 7405. ENQ-38. By acz?zptarm of lhts arllds, lha publiahar racqlzes Ihal tlw U .S, Govarnrrml retaim a IWWcludue, m yaky-lraa Ikanaa 10
@lish w re~~~ IIW ~MO~ form ~ Ih;g COIIWUSIOZI, w 10 alh dhm 10 do so !OI US Govarnrmnf ~rpoaaa. The LOS Alarms National Laboratory
rquazits that Ita pubhsher kfadty this ankle as work pmrforti under Ihe IIus@as or Iha U.S. Dspammt of Energy.
Form No 133GM5
INSTABILITIESIN FOIL IMPLOSIONS AND THE EFFECT ON RADIATION OUTPUT’
H. Uon% D.L Peterson, J.H. Goforth , M.L. Yapurrcich, C. Findley, E. LOWZ
J. Benage, G. Idzorek, J.C, Cochrane, B. Anderson, J. Shkcter
IAS Alamos Na,tionai Laboratory Los Alamos , New Mexico, 87545 USA
Introduction
One of the aims of the Athena program at the Los Alamos National Laboratory is the genemtion of a high
fluence of sofl x-rays from the thermalization of an radially imploding foil. IrI the experiments in Athena progrzm, a large axial current is passed through a cylindrical aluminum foil. Under the action of the Lorentz force, the resulting plasma accelerates toward the axis, thermalizes, and produces a fast soft x-ray pulse with a blackbody temperature up to several hundred electron volts. In order that there be the maximum power compression and the highest x-ray fluence and temperature, the plasma stagnation on axis must occur very promptly. This requires that the imploding plasma be as thin and symmetric as possible. A serious problem in the thermalization process is the formation of instabilities in the plasma due to the self-magnetic field that governs the implosion of foil. A large diagnostic effort was developed to capture the details of the implosion and instability growth in several foil implosion experiments.
In this repon we will present visible light images and x-ray data designed to study the effects of foii mass, curreng and initial perturbations on the instability growth during foil implosion. Representative data is presented from several experiments using the Pegasus capacitor bank system and the explosively driven Procyon system. These experiments are labeled Peg 25 md Peg 33 for the Pegasus experiments and PDD1, PDD2 and PRFO for the Procyon experiments. In these experiments, all foils had radii of 5 centimeters but varied in mass and initial conditions. Experimental data from several shots were compared with each other and to a radiation magnetoh ydrodynamic (RMHD) computation and described in a separate paperl. The data obtained from these expedients and the analysis has given us understanding for the physical mechanisms involved and insight for future experiments and has lead us to propose methods for minimiztilg the instability growth and maximizing the radiation output, In particular, we observed that wrinkles and other physical momalics in the initial shape of foil do not appear to contribute to the growth of the instabilities.
TheExperiments
Two systems used at LANL to supply the current to the imploding foil are the Pegasus 11capacitor bank and the explosive flux compression generator of the Procyon system. The Procyon generator produces up to 18 megtt Joules of energy, md from m initial cuxent of 460 kilo Amperes, can supply 22 mega Amperes of current to a 73 nano Henry load, The Pegasus 11capacitor bank3 is an excellent system for studying implosion physics. It is a 4.5 mcga Joule system which supplies approximately 6 mega Amperes into the implosion load,
Diagnostic tools used in the experiments for studying the implosion physics and the generation of instabilities include visible framing cameras and x-ray imaging systems. High-speed visible light timing cameras (Imacons)
were used to obsetve the implosion as the plasma converged and stagnated on axis, Due to the nature of the experiments, the visible images were transferred via minors from the experiment to a location where the cameras were protected. Computer enhancement was used study the details f f the implosion from the images. Time resolved and time integrated x-ray images and the total x-ray output were obtained horn bolometers md x-ray diodes (XRD). The x-ray imaging was done with the cameras attached to the vacuum chamber of the foil load, Previous experiments’ allowed us to develop protection for the x-ray systems so they could survive the shock and debris tlom high explosives in the Procyon experiments.
The thickness of the foil for the experiments were 0.8440 and 0,7380 microns for Peg 25 and Peg 33 respectively and 3,5770, 4.3090 and 4.0320 microns for PDDI, PDD2, and PRFO. [n all experiments, the thin cylindrical foils were turned into plasma shells by the high cument from either the Procyon explosive generator or the Pegasus capacitor bank. The shells imploded under the action of the high magnetic fields prodl~ced by the current,
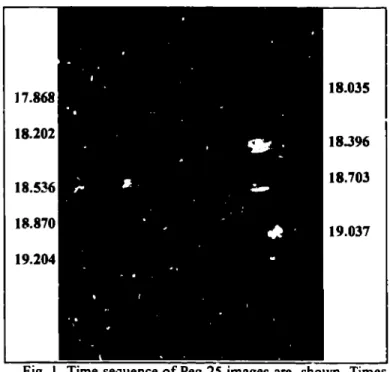
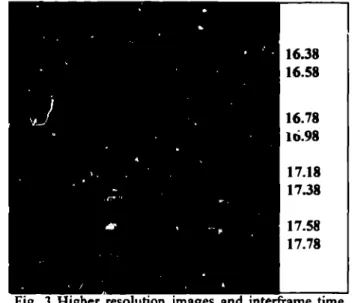
Through the series in Figs. I-3 of radial views from the visible light framing camera, we can observe the chronology of implosion, instability, md radiation production in Peg 25 and Peg 33, The images in Figs, I and 2
18.035
183% 18.703
19.037
Fig. 1 Time sequence of Peg 25 images are shown. Times are given in microsecond and the interfkarne time is 167 ns The implosion on axis takes place at the frame labeled
18.536. Atler the unplosion “Flaps” move from top and
bottom and close off the area.
have an inter-frame time of 167 nanoseconds with an exposure time is 32 nanoseconds. The image in Fig. 3 has an inter-tie time of 100 namseconds and an exposure time is 20 nanoseconds. Figures 8, 9, and 10 give similar
images for PDD 1, PDD2 and PRFO respectively, all with interfiarne times of 167 nanoseconds.
The instabilities and their evolution in both the Pegasus and the Procyon experiments are clearly seen in the images. The common element in all these images is short wavelength mode instabilities that develops in the initial phase of the implosion. The instability evolution and the short wavelength instabilities appear very clearly in the amplified contour plot in Fig. 4 of the foil edge in the two Pegasus experiments. In time, the short wavelength modes satumte and form long wavelength mode imtabilities that vary from experiment to experiment depending on foil mass and current. The long wavelength instabilities are the req.mnsible for destroying the uniform prompt pinch on axis. As discussed in these proceedings], the long wavelength instabilities influence the resulting cument and voltage wave forms and the output x-ray temperahr”e and fluence.
Another, unexpected effect that seems to influence the x-ray radiation output is visible in all the images in Figs. 1-3 and 8-10. This is a “flap”, a feature that moves in the axial direction from the top and bottom sides of the foil. This flap is observed in the images in both Pegasus and Procyon experiments. After the flap appears, it grows to block the view to the center of the implosion region and modifies the mdiation output. The time of the initial appearance of this feature varies with experiment. In some experiments, it appears at pinch time and in others, it appears at much later. On Peg 33, in addition to the visible framing camera images, we were able to take time resolved x-ray pictures which were filtered to observe different x-ray energies. Fig. 5 shows a comparison of a visible framing camera image and an aluminum filtered x-ray picture. These pictures were taken at almost identical times through adjacent ports approximately 12° apart on the load chamber, Remarkably, the images look vkually the same, and the x-ray pictures also show the flaps. Another x-ray image taken with a carbon filter eliminates the view of the flaps. This observation and the fact that aluminum filters will transmit aluminum x-rays suggest that the ilaps are due to radiation from cool rduminunl plasma and may be related to wall effects on the growth of instabilities.
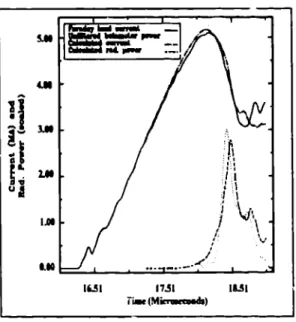
The effect of the flaps on x-ray production can be seen in the two Pegasus experiments. Experimental output and foil behavior were in good agreement with calculations in Peg 25, As shown in Fig 6, the calculated and measured current and bolometer power pulse agree extremely well, Experimenta!ly, we measured 240 kilo Joules total fluence with unfiltered bolometers and 300 kilo Joules with XRDS on Peg 25; pre-shot calculations predicted 250 kilo Joules. On Peg 33, however, we measured only half as much radiation: 135 kilo Joules with bolometers and 175 kilo Joules with XRDS. Observations of the framing camera images, aa seen in Figs. 2 and 3, reveal that the plasma stagnation on axis was much “cleaner” in Peg 25 than in Pep 33. In addition, the flaps, composed of colder fed/wall material, appeared atler the pinch in Peg 25 but roughly at the time of the pinch in Peg 33. The maximum x-ray radiation appears in frame 18.536P sec. in Peg 25 as compared with frames 17.5 p sec. in Peg 33. We suspect the differences are due to the sloppier pinch in Peg 33 and the absorption of the radiation by the flaps. Elimination of the flaps may be possible by modifiing the upper and lower implosion foil glide planes and by providing ari exit for the coder material, An upcoming experiment is designed to address this issue.
]6334 16.668 17.002 17.336 17.670 ig. 2 16.38 16.58 16.78 10.98 17.18 17.38 17.58 17.78 rarne time interfkarne time of 167ns. X-my radiation was
prcd.reed at 17.5 microseconds. Large instabilities prior to pinch are seen, and the’’flaps” have progressed significantly more than in Peg 25,
Fig.4 Foil initiation from separate experiments. The features of the foil edge are amplified horizontally. Total time observed is 800 ns. All experiments show the same eady instabilities.
Fig 6 Comparison of aluminum filtered x-my image (top) and n visible framing image (bottom). Similarities suggest the same regions for x rays and visible light, “Flaps” are seen in both.
—
of I00 ns.on experiment Peg 33. View is fkem a
different mgle. Details of foil initiation md mode evolution are clearly seen. Also, the initiation of “flaps” rms become apparent.
E/en though the main purpose of the framing images is to illuminate the plasma behavior at pinch time, we have observed some other unusual features in the plasma. T%se features, shown in Fig, 7, have appeared in all the experiments. The clearest images were obtained from Peg 33. These late time features persist for several microseconds and mi~t be related !O blow off from the wall. A more interesting explanation is the arrangement of the atoms into domains similar to the magnetization and closure domains that occur in solid state magnetic materials.
Framing camera pictures for the high energy and high current Procyon experiments PDD 1, PDD2, and PRFO are shown in Figs. 8 - 10. Of these experiments, PDDI and PDD2 were physically identical, PRFO was a modified experiment that had the upstream glide plme electrode that protruded into the implosion region. The glide plane electrode generated a high temperature plasma source by creating a plasma jet and forcing it through a hole in rmother downstream glide plane.
The images in Fig, 8 from PDD1 appear weak and disappear completely at pinch time. We discovered later that the Pyrex entrance windows turn dark at the radiation fluence levels of these experiments. The entrance windows were changed to Quartz for PIlD2 and PRFO. Also, due to the iidditional windows and mi-ror~ that are used to transfer the im~ge from the explosive firing table to the bunker, the Procyon images are not M sharp as the images from the Pegasus series. On the other hand, we notice that the amplitude of the instabilities in the Procyon foils are not quite as large as the instabilities in the Pegasus experiments. This may be due to the higher current md rate of change of current
I 1 , WI u la -1, .,. , w . 1.0s -am 1631 1751 1s31 Tii (M”~)
Fig. 6 Comparison of measured and calculated current for Peg 25. Calculated and measured bolometer power pulses are a!so shown. The total flunce vw about 250 kilo Joules.
— [ 53.790 54.124 54.4S8 54.790 ss.~zb Fig. ~ i
time is 167 ns, The pinch in this experiment occurred at 355.46 microseconds. Due to the radiation the Pyrex window turned dark Total of
1,5 mega Joules was produced.
Fig. 7 This is a late time feature that appears in all experiments. It is mainly shovm for curiosity. The total time shown covers 1.3 microsecond after the phch. It may be related to orientation of the pLisma atoms by the high magnetic field into magnetic domains.
in the Procyon experiments. Cment profiles are shown in Fig 11. Additional discussion of these experiments is provided in mother pape~ in these proceedings.
PDD1, the first experiment in the Procyon series, gave a total radiation output measured by bolometers and XRDs of 1.5 mega Joules. This results is in good agreement with the calculated estimate of 1.7 mega Joules. Unfo~ateIy, in this experiment, we did not see the detii~ls of a continuous evolution of the instabilities to @Ch time. in Fig. 8, pinch occurs at frame time 355.46 which is dwk clue to radiation darkening of the Pyrex winciow.
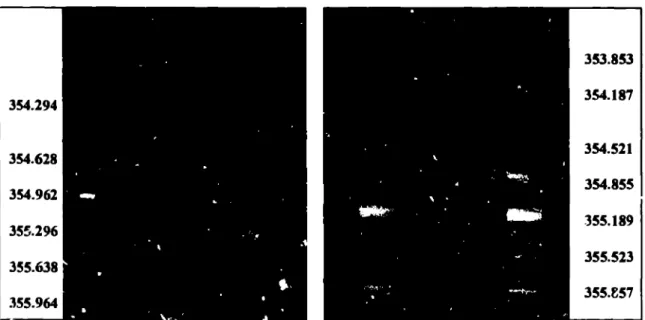
PDD2 images in Fig. 9 show the initiation of the foil and the presence of very large wrinkles. Careful +scrvation of these images suggest that the wrinkles do not have an effect on instnbili~’ growth. This experiment was electrically a more perfect experiment than PDD 1 but it produced significmtly le~~ radiat~on. Bolometers measured 375 kilo Joules. XRDS located on the side opposite the bolometer measured 350 kilo Joules of total raciiation, Another set of XRDS located at right mgle to the bolometer gave a total radiation uf 640 kilo Joules. This suqgests a bad asymmetry or an off center implosion. The visible ~mages show the implosion to be slightly off center. The x-ray pinhole cameras suggest that pinch was about 0.75- 1.0 centimeters from the axis. Since instabilities sometimes generate plasma bubbles that collapse, the radiation in this experiment might have been produced from a small spot of hoi, collapsed plasma with the rest of the plasma remaining cold. Indications of such a scenario is shown in the second image in Fig 12.
The third Procyon experiment, PRFO, had a different purpose but it provided us with information on ways of modifying instability growth and generating a “clean” stagnation on axis. As in the FDD2 experiment, the PRFO foil contained many initial wrinkles that are not related to the growth of instabilities. The images and instabilities, as shown in Fig, 10, evolved in the same way as they did in PDD2. However, at pinch time, the region ~hat normally is full of plasma in earlier experiments appears in PRFO as a clean, narrow pinch on axis. Modification of the glide plane electrode in this experiment forced the location of the pinch to be on axis, md the large hole at the
,. 354.294 354.628 354.962 355.2% 355.638 355.964
Fig. 9 Timing sequence for PDD2. Inerfiame
time is 167 ns. The large wrinkles in the foil are clearly seen. Pinch time is at 355.63 and we notice the “flaps” begiming to obscure the center. Instabilities become noticeable at 355.96.
Ii:
10 had Cummt 5 0 j#l 549 J30 361 )91 3iJ M* JS5 Jsa J37 TIMEQ@Fig. 1 I The current from the generator and at the
353.853 354.187 354.521 354.855 355.189 355.523 355.857
Fig. 10 Experiment PRFO. Large wrkkles are
again apparent. The horizontal striations at
354.521 are instabilities due to the magnetic field. The box indicates pinch time and the extent of the fiarne. A jet is observed at the downstream electrode.
load are shown, The x-ray p[dse from PDD 1 k also shown, The electrical signals in all the Procyon experiments are remarkably reproducible. The curves labeled are: A=PRFO; B=PDD 1; C=PDD2.
PDD1
I’DD2
PRFO
Fig. 12 Comparison of x-ray pinhole camera images. TIE radiating source areas arc very different for each experiment.
downstream electrode helped “clean” out the implosion region. The radiation ffom this experiment was measure to be 640kilo Joules with the bolometers and 5S0 kilo Joules with the XRDS.
Reasons for the different radiation fluences in PDD 1, PDD2 and PRFO are summarized by the x-ray pinhole camera pictiires in Fig 12. These images show from top to bottom PDD 1, PDL)2, and PRFO. Even though physically PDD I and PDD2 are identical experiments, they show di Terent radiating source sizes and hence different fluences. In addkion, PRFOshows a broad radiating source with a hot spot in the center.
. . .
Conclusions
A series of experiments from the explosive Procyon system md the Pegasus c~pacitor bank has provided data for an understanding of radiation lOSSmechanisms during foil implosion. Our papef is composed mainly of self revealing series of foil implosion imnges that provide an understanding of the physical
mechanisms involved. In experimen~ that showed lower than expected radiation fluenccs, the loss of
radiation appears to be due to the absorption of radiation by cold material fi-om the foil or the electrodes, The cold material can be due either to the way that foil instabilities distribute the mass at implosion time or to radiation “blow-off’ from the electrodes. It appears that the majority of the cold material is due to tie distribution of foil mass. Addition katures present in the foil implosion unages are “nmgneto-hydrodynam~c bubbles” which break at implosion time and provide a clear view m the implosion region. Visible light images and time resolved and filtered x-ray imges also show “flaps” that develop from the top and bottom sides of the foi!. From the images we have determined that the tlaps are probably due to cold foil material. Initial foil behavior was similar in both the lower current Pegasus system and the more massive, higher cument Procyon system At later time, however, the Procyon foils imploded more symmetrically and more quickly that the Pegasus foils. We also observed that tie severe initial wrinkles in the foils (initial petitions) do not seem to influence t5e tilitiation of the instabilities that grow.
A discussion of changes in the elec~ode geometry for the Procyon PRFO experiment is explained i.nthe text. We were able to obtain a sequence of pictures showirrg that in this experiment the load region was clear of “other plasma” at implosion time. Future modifications include electrode geome~ies that allow for the colder plasma to escape and minimize the effects of absorb.-:.. Foils made of different materials are akto being considered to tune the system optimally for currentand t!!e rate of change of cument.
We have successfully demonstrated that that we can generate 1.5 rnega Joules of ~adiati~nfiidhave learned how to fme tune the system to provide a high fluence and high temperature implosion by minimizing the presence of colder plasma in the load region. Future experirnen~ wiil aim at reaching iiigher goals of multi-mega Joule and several hundred electron volt temperature radiation sources.
References
1. D. L. Peterson, e(.al., “Comparison of 2-D Simulation Results with Experimental Results from the PEGII-25 Radiation Experiment on the Los P.hunos Pegasus 11Capacitor Bank,” these proceedings. 2. J. Goforth, et al., “P.ocyon: 18-MJ 2-USPulsed Power System,” these proceedings,
3. J. C. Cochrane, et.al., “Plasma Flow Switch and Foil Implosion Experiments on Pegasus II,”Ni,/th IEEE lnterrwtionai Pulsed Power Conference, Albuquerque, NM, June 2 !-23, 1993, pp. 805-307.
4. H. Gon% ?(.al., “Plasma and Electrical Diagnostics for Procycn Experiments,” Eighth lEr5E lrtter~ational Pulsed Power Co,rjerence, San Diego, CA, June 16-19, 1991, ?p. 633-636.