STATUTORY REQUIREMENTS
In accordance with Part V, Chapter 15, Sections 123-125 of the Communications and Multimedia Act 1998, and Part II, Section 6 of Postal Services Act 2012, Malaysian Communications and Multimedia Commission hereby publishes and has transmitted to the Minister of Communications and Multimedia a copy of this Industry Performance Report (IPR) for the year ended 31 December
2014.
MALAYSIAN COMMUNICATIONS AND MULTIMEDIA COMMISSION, 2015
The information or material in this publication is protected under copyright and save where otherwise stated, may be reproduced for non-commercial use provided it is reproduced accurately and not used in a misleading context. Where any material is reproduced, MCMC as the source of the material must be identified and the copyright status acknowledged.
The permission to reproduce does not extend to any information or material the copyright of which belongs to any other person, organisation or third party. Authorisation or permission to reproduce such information or material must be obtained from the copyright holders concerned.
This work is based on sources believed to be reliable, but MCMC does not warrant the accuracy or completeness of any information for any purpose and cannot accept responsibility for any error or omission.
Published by:
Malaysian Communications and Multimedia Commission MCMC Tower 1
Jalan Impact Cyber 6
63000 Cyberjaya, Selangor Darul Ehsan T: +60 3 86 88 80 00 F: +60 3 86 88 10 00 Toll Free: 1-800-888-030
W: www.mcmc.gov.my ISSN 1823 – 3724
This Page Intentionally Left Blank
TABLE OF CONTENTS
CHAIRMAN’S STATEMENT 7
EXECUTIVE SUMMARY 10
LICENSING UNDER CMA 14
Licensing Profile over the Years 14
Roll-out Status in 2014 17
MODULE 1 : ECONOMIC PERFORMANCE OF C&M INDUSTRY 19
C&M Industry vis-à-vis Bursa Malaysia Performance 20
C&M Industry Financial Performance 23
Driving Talent in C&M Industry 25
Telecommunications 26
Capital Expenditure (Capex) 28
Broadcasting 36
ACE Market Overview and Market Performance 39
MODULE 2 : SERVICES AND CONNECTIVITY 43
World Broadband and Internet Comparison 44
Broadband in Malaysia 47
Fixed Broadband 49
Wireless Broadband 50
Wireless Fidelity (Wi-Fi) Hotspots 50
4G Long Term Evolution (4G LTE) Services 52
Fixed Services 55
Direct Exchange Line (DEL) Subscriptions in Malaysia 55
Satellite Services 56
Satellite Services in Malaysia 57
Mobile Services 58
Service Provider Market Shares 60
MVNO Services 62
MODULE 3 : CONTENT SERVICES 65
TV Industry 66
Malaysian TV Services 67
Terrestrial FTA TV 68
Pay TV 70
TV Audience Measurement 74
National Broadcasting Digitalisation Project 78
Malaysia Selected DVB-T2 Standard 78
Common Integrated Infrastructure Provider (CIIP) 78
Roll-out of Digital Terrestrial TV 79
Multimedia Receivers 80
Benefits of DTTB 80
Analogue Switch Off 80
Radio Broadcasting 81
Radio Development 81
Radio in Malaysia 81
Business Strategy to Grow Radio Listener 83
Listenership and Revenue 83
Advertising Expenditure (Adex) 86
Adex in Malaysia 88
MODULE 4 : APPS AND CONTENT DEVELOPMENT 91
Development of Apps 92
Leveraging OTT Apps 96
Other TV and Radio OTT Apps 98
Mobile Apps to Engage Subscribers 99
Mobile App for Branding and Business Promotion 99
Content Development 101
MODULE 5 : QUALITY ASSURANCE AND CONSUMER PROTECTION 107
Consumer Protection 108
Consumer Complaints As Feedback Mechanism 109
Complaints to Industry Forums 113
Challenges in Consumer Protection 115
MCMC Monitoring and Enforcement 118
Service Quality Assurance 122
Enforcement by MCMC 125
Economic Regulation: Dominance in Communications Market 128
MODULE 6 : SECURITY AND TRUST 129
Reliability, Trust and Security 130
Security Threats 130
Authentication of Online Identity 131
All Certification Authorities are WebTrust Certified 131
Public Key Infrastructure (PKI) Development 132
Digital Signature Market 134
Klik Dengan Bijak® Campaign 136
MODULE 7 : POSTAL AND COURIER 137
Postal Service 138
National Postal Strategy (NPS) 138
Pos Malaysia Bhd 139
Postal Access 140
Postal Traffic 142
Philately 144
Courier Industry Licensing and Revenue 146
Courier Traffic 146
Total Revenue of Top 10 Courier Service Providers 148
Mitigating Consumer Complaints 149
MODULE 8 : OUTLOOK 2015 151
C&M industry to remain stable with moderate growth 152
Infrastructure investment for continuing growth 152
Moving Towards the Digital Economy 153
Embarking on digital lifestyle journey 153
Connected living enabled by communication services 153
Security and privacy 153
Conclusion 154
LIST OF ABBREVIATIONS 155
LIST OF FIGURES 159
CHAIRMAN’S STATEMENT
The Industry Performance Report 2014 reflects activities undertaken by both the Commission and the industry during the chairmanship of YBhg Dato’ Mohamed Sharil Tarmizi. I would like to express my appreciation for his commitment and versatility in leading the industry to face new challenges. It is my pleasure to present the Industry Performance Report 2014.
In 2014, our communications and multimedia (C&M) industry performance was stable with overall revenue growth of 3%. With basic mobile phone penetration rate of 150% and household broadband penetration rate at 70%, we are poised for another wave of growth as we focus now on improving the capacity and quality of service for increasingly sophisticated connected consumers.
Notably, the C&M companies’ performance on Bursa Malaysia is encouraging wherein the major companies’ market capitalisation registered a growth of 6.7% and surpassing the RM200 billion mark.
Our immediate target is to further improve quality of service and sustainable growth in enabling other economic sectors to meet our national aspirations towards a developed nation in 2020.
Sustaining Industry Growth
Connectivity has expanded in depth and scope today from fixed, mobile, online or over the Internet including digital broadcasting in an increasingly converging options to deliver content. In 2014, data services reported growth between 25% and 40%. Hence, the investment in continuous roll-out of 4G LTE and increasing throughput over our broadband infrastructure supports data demand growth. As value added communications services can drive competition and sustainability, the C&M industry has a pivotal role to play in providing connectivity in various forms such as sensor networks, machine to machine (M2M) communications and new value chains. Today, we have already seen traditional business models, namely, voice and SMS experiencing declining revenue due to consumer preference for Over-the-Top (OTT) messaging services.
Capturing Opportunities by Intensifying Usage
As new and smart ecosystems of communications services emerge, quality of the network and secure online experience are critical. We are expected to challenge ourselves in investing strategically and develop new business models that meet consumer demand. These necessarily would require knowing the customers as well as leveraging on new applications in content, social media and other digital services. In doing so we also have to ensure that consumer feedback mechanism is intact. In this respect, I would like to commend the efforts undertaken by service providers in instituting proactive measures to improve customer relationship and service experience.
Recently, there is a paradigm shift of viewing behaviour from traditional TV to online and social networking platforms. Hence, content is expected to be intensely stored and distributed online. As a result, broadband network capacity will be driven significantly by intense usage including mobile video, which is expected to grow as much as 45% annually through to 2020.
Adex in Malaysia 88
MODULE 4 : APPS AND CONTENT DEVELOPMENT 91
Development of Apps 92
Leveraging OTT Apps 96
Other TV and Radio OTT Apps 98
Mobile Apps to Engage Subscribers 99
Mobile App for Branding and Business Promotion 99
Content Development 101
MODULE 5 : QUALITY ASSURANCE AND CONSUMER PROTECTION 107
Consumer Protection 108
Consumer Complaints As Feedback Mechanism 109
Complaints to Industry Forums 113
Challenges in Consumer Protection 115
MCMC Monitoring and Enforcement 118
Service Quality Assurance 122
Enforcement by MCMC 125
Economic Regulation: Dominance in Communications Market 128
MODULE 6 : SECURITY AND TRUST 129
Reliability, Trust and Security 130
Security Threats 130
Authentication of Online Identity 131
All Certification Authorities are WebTrust Certified 131
Public Key Infrastructure (PKI) Development 132
Digital Signature Market 134
Klik Dengan Bijak® Campaign 136
MODULE 7 : POSTAL AND COURIER 137
Postal Service 138
National Postal Strategy (NPS) 138
Pos Malaysia Bhd 139
Postal Access 140
Postal Traffic 142
Philately 144
Courier Industry Licensing and Revenue 146
Courier Traffic 146
Total Revenue of Top 10 Courier Service Providers 148
Mitigating Consumer Complaints 149
MODULE 8 : OUTLOOK 2015 151
C&M industry to remain stable with moderate growth 152
Infrastructure investment for continuing growth 152
Moving Towards the Digital Economy 153
Embarking on digital lifestyle journey 153
Connected living enabled by communication services 153
Security and privacy 153
Conclusion 154
LIST OF ABBREVIATIONS 155
LIST OF FIGURES 159
CONTACT US 162
Progressive Regulatory Framework
Indeed, in 2015 we are reviewing the Communications and Multimedia Act 1998. It is also timely to review our processes and regulatory framework to facilitate the changing industry landscape. In tandem, service providers also need to emphasise on product innovation and delivery of affordable and value propositions in their service offerings.
Going forward, we should extract the best synergy that can be obtained from both mobile and fixed networks through strategic infrastructure investments, access framework and collaborations in network sharing. Such strategic focus allows the C&M industry to truly serve as an active and reliable enabler for Malaysian economic sectors to drive towards a smart nation in 2020.
Stimulating Creative Content and Apps Development
Social networks, music and video sharing sites as well as various entertainment apps have fuelled demand to share content. This is both at the individual level and the business angle as apps provide the easy link to sharing content for entertainment and commercial purposes. It is indeed critical at this juncture for Malaysia to reinforce the fundamentals in creative content production to capitalise on growing demand for such content over seamless online and mobile platforms. Note that games, data analytics, online TV, connected health, transport and other functionalities supported by apps or Internet connectivity are emerging trends of our Malaysian digital lifestyle.
Amongst the essentials to realise these are not only to optimise new infrastructure capacity, but also capitalise on latest production technologies, content creation and industrial design skills ranging from script writing to apps development ecosystems. Strategic plans and their implementation can attract local and foreign investment alike, which can further grow the C&M industry.
E-commerce boosts Postal and Courier Services
The rise of social media platforms including mobile apps is also offering vast opportunities for e-commerce and online shopping. Postal and courier services stand to prosper and complement this e-commerce environment by offering logistics and delivery extensions to these vendors for timely product delivery.
The double digit volume growth for domestic parcel services to 16.6 million shows online and home shopping are flourishing. This offers recurring income for service providers. However, service providers must quickly adapt to meet the demands of rapidly growing and evolving market, particularly in global e-commerce. In this case, we note that growth and confidence in the e-commerce system needs a robust payment framework; secured by ID authentication, public key infrastructure including e-identity.
Talent Development as an Engine of Digital Economy
Going forward, the next phase of evolution should not only focus on the development of infrastructure, but also in developing C&M skills and local talents in the industry and cross channel as required. Such an approach can produce value propositions in the Internet of Things environment and enable the nation to work towards a vibrant digital economy. This creates economic value through connected people and connected services.
Indeed, the service providers should capitalise on the convergence of communications and content services as the next wave of breakthrough in innovation and disruptive growth. Let us work together to build the necessary ecosystems that can support the connectivity among people, intelligent machines and integrated value chains in driving towards a smart nation in 2020.
Dato' Sri Dr. Halim Shafie Chairman
Malaysian Communications and Multimedia Commission
EXECUTIVE SUMMARY
In 2014, the C&M industry has performed respectably, recording 3% growth in revenue to RM58.91 billion from RM57.2 billion. This steady performance of the C&M industry was contributed mainly by telecommunications with 78% revenue share, broadcasting 11% and the remaining from postal sector and others including ACE market, digital signature and non-public listed licensees revenue.
In terms of capital market valuation, the C&M industry market capitalisation marked RM208.48 billion in 2014. This is a milestone for the C&M industry to have surpassed RM200 billion market capitalisation. This represents 12.6% of the Bursa Malaysia market capitalisation of RM1,651.17 billion. Although the Malaysian economy faced uncertainties, especially in the last quarter of 2014, the C&M industry remained stable with a growth in market capitalisation by 6.7%.
In 2014, the 12 licensees listed through holding companies on the ACE Bursa Malaysia garnered revenue of RM0.7 billion, with market capitalisation of close to RM2 billion.
Increasing Connectivity
Malaysia achieved 70.2% household broadband penetration rate as at end 2014. Based on The State of Broadband 2014 report by Broadband Commission1, Malaysia ranked 17th from a list of 132 developing countries by household penetration rate in 2013.
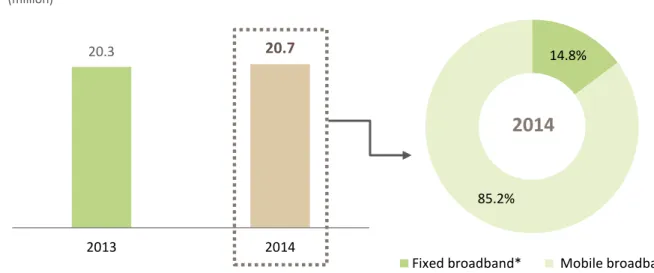
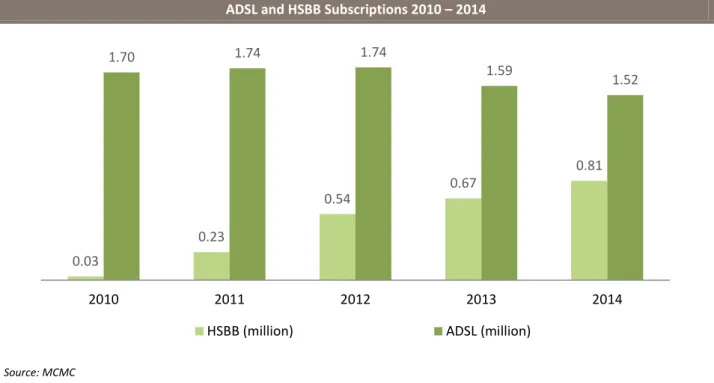
The coverage and connectivity services offered by service providers to date, have enabled consumers to have always on access for various purposes using online means. The public private partnership project, namely, the High Speed Broadband Project (HSBB) has added 142,000 new subscriptions throughout 2014 to a total of 810,000 subscriptions.
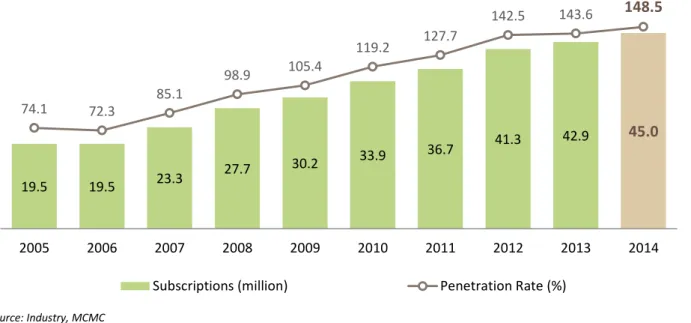
Meanwhile, mobile broadband remains the largest contributor in terms of broadband subscriptions in 2014 with more than 85% of total broadband subscriptions (20.7 million). Existing voice services in terms of fixed telephony service as represented by Direct Exchange Line (DEL) subscriptions, has penetration of 30.3 per 100 households in 2014. However, DEL subscriptions continued to decline over the past years. In contrast, mobile subscription penetration rate is reaching almost 150% in Malaysia. Notably, out of these mobile phone users in Malaysia, about half of them use smartphones.
On mobile subscriptions market share by service providers, Celcom captured 28.9%, Maxis 27.8% and DiGi 25.5% as at end 2014. In comparison, U Mobile registered a total of 9.7% of market share compared with 10.3% in 2013 while MVNOs are gaining more traction by securing 8.2% market share (2013: 6.2%).
1 Broadband Commission, The State of Broadband 2014: Broadband for all, September 2014
EXECUTIVE SUMMARY
In 2014, the C&M industry has performed respectably, recording 3% growth in revenue to RM58.91 billion from RM57.2 billion. This steady performance of the C&M industry was contributed mainly by telecommunications with 78% revenue share, broadcasting 11% and the remaining from postal sector and others including ACE market, digital signature and non-public listed licensees revenue.
In terms of capital market valuation, the C&M industry market capitalisation marked RM208.48 billion in 2014. This is a milestone for the C&M industry to have surpassed RM200 billion market capitalisation. This represents 12.6% of the Bursa Malaysia market capitalisation of RM1,651.17 billion. Although the Malaysian economy faced uncertainties, especially in the last quarter of 2014, the C&M industry remained stable with a growth in market capitalisation by 6.7%.
In 2014, the 12 licensees listed through holding companies on the ACE Bursa Malaysia garnered revenue of RM0.7 billion, with market capitalisation of close to RM2 billion.
Increasing Connectivity
Malaysia achieved 70.2% household broadband penetration rate as at end 2014. Based on The State of Broadband 2014 report by Broadband Commission1, Malaysia ranked 17th from a list of 132 developing countries by household penetration rate in 2013.
The coverage and connectivity services offered by service providers to date, have enabled consumers to have always on access for various purposes using online means. The public private partnership project, namely, the High Speed Broadband Project (HSBB) has added 142,000 new subscriptions throughout 2014 to a total of 810,000 subscriptions.
Meanwhile, mobile broadband remains the largest contributor in terms of broadband subscriptions in 2014 with more than 85% of total broadband subscriptions (20.7 million). Existing voice services in terms of fixed telephony service as represented by Direct Exchange Line (DEL) subscriptions, has penetration of 30.3 per 100 households in 2014. However, DEL subscriptions continued to decline over the past years. In contrast, mobile subscription penetration rate is reaching almost 150% in Malaysia. Notably, out of these mobile phone users in Malaysia, about half of them use smartphones.
On mobile subscriptions market share by service providers, Celcom captured 28.9%, Maxis 27.8% and DiGi 25.5% as at end 2014. In comparison, U Mobile registered a total of 9.7% of market share compared with 10.3% in 2013 while MVNOs are gaining more traction by securing 8.2% market share (2013: 6.2%).
1 Broadband Commission, The State of Broadband 2014: Broadband for all, September 2014
Multiple Platforms and Devices Supporting Content Delivery
Over time, the TV industry is evolving rapidly and is adapting to accommodate wider distribution networks. The future for broadcast includes broadband delivered content. Thus, the broadcasters are enhancing their businesses to include online services which will increase audience size. Currently, all major broadcasters are tapping into the OTT market to cater for and take advantage of audience viewing pattern shifts and simultaneously engaging in digital platform to expand content delivery. Notably, the Digital Terrestrial Television Broadcasting (DTTB) which is scheduled to commission in 4Q 2015 will enable further convergence of video delivery platforms as well as facilitating a whole new enhanced range of digital products and services to be introduced.
The dynamics in TV industry today feature increasing competition among service providers in terms of content offerings. Since content plays an important role towards reaching a wider audience and increase audience loyalty, these service providers are investing substantively in content creation and related activities to capitalise on new value propositions for consumers. These include capacity building and market development activities as well as international co-production.
In terms of Pay TV market, service providers have various approaches to reach their audience such as different basic Pay TV offerings as well as customised TV packages. For example, ASTRO and Telekom Malaysia are offering triple-play services namely, Internet, voice and IPTV packages, while Asian Broadcasting Network is offering TV and Internet packages. This variety of offerings is able to boost audience interests and take-up, which is expected to further stimulate competition in the market.
Consumer Protection and Quality of Service
In 2014, total consumer complaints received by MCMC increased by 20% to a total of 13,663 (2013: 11,395), of which 76% of these complaints lodged were against the service providers. Notably, on average, 23.4% complaints were resolved within 72 working hours. In addition, complaints on new media content continue to be on the rise. There were 2,536 complaints received by MCMC related to new media in 2014. With that, MCMC have taken enforcement action on online offences, which fall under our jurisdiction. In such cases, there is collaboration with other law enforcement agencies such as Polis Diraja Malaysia (PDRM), Kementerian Perdagangan Dalam Negeri, Koperasi dan Kepenggunaan (KPDNKK) and Jabatan Kemajuan Islam Malaysia (JAKIM).
In ensuring the best consumer experience in telecommunications services, MCMC carries out various assessments within telecommunications networks to ensure service providers meet the minimum standards as stipulated in Mandatory Standards on Quality of Service. These include the quality of service for cellular network and in the performance of wired and wireless broadband network. Aside from service quality, the MCMC monitors content and communications equipment for compliance to stipulated standards.
In 2014, MCMC has published the Dominance Report and the Commission Determination on Dominant Position in a Communications Market. This insight into the market serves to ensure that MCMC will be able to act promptly to deal with competition complaints and hence, promote healthy and effective competition in the C&M industry.
In a competitive C&M industry environment where the delivery network and network service are critical to support content and applications services, service providers have invested to
ensure secure network and online safety. For instance, service providers are educating consumers on good practices and constantly improving their customer relationship management and strategies. This serves as a channel for immediate response by consumers and the ratification of issues raised, thereby ensuring consistent quality assurance.
Industry Development Management in 2014
Aside from a regulatory role, MCMC is also involved in industry development, the direction of which is essentially guided by the 10 national policy objectives under the Communications and Multimedia Act (CMA). Towards this end, in promoting the creative content industry, MCMC has allocated RM100 million for the Creative Industry Development Fund from 2011 to 2015. The objectives of the Fund are to enhance the competitiveness of national content industry as an economic growth area and to bring Malaysian content to the international arena. As at end 2014, a total of RM67.14 million was approved for various projects under this Fund.
For 2014, local content has garnered revenue totalling RM145.01 million from international market exploration initiatives. This is a collaboration effort involving National Film Development Corporation Malaysia (FINAS), Multimedia Development Corporation (MDeC) and local companies. The revenue is based on the value of agreements made at the international trade shows such as MIPTV, MIPCOM and Asia Television Forum (ATF).
The Universal Service Provision (USP) programmes continue to assist in narrowing digital divide between urban and underserved communities as they bring Internet access to these communities. Hence, this ensures broadband connectivity is made available in an inclusive manner. As at end 2014, there were 513 1Malaysia Internet Centre (PI1M), 5,652 1Malaysia Wireless Village (KTW1M) and 949 Time 3 telecommunications towers built under USP.
Security and Trust
As at end 2014, the cumulative number of digital certificates issued in Malaysia was 7.4 million, which is an increase of 19.4% compared with 6.2 million in 2013. Digicert Sdn Bhd (Digicert) issued 92% of certificates with the remainder by MSC Trustgate Sdn Bhd (Trustgate). Both Digicert and Trustgate are certifying agencies appointed by MCMC under the Digital Signature Act 1997.
Analysis based on user categories show that 96% of total certificates were issued to the Government sector while the balance 4% was issued to the private sector such as financial institutions, pharmaceutical companies and individuals.
Postal and Courier Services
One major achievement for the National Postal Strategy in 2014 was to transform the industry configurations to meet the new market challenges especially e-commerce demand. The result is evidenced from the revenue and capacity growth in the courier sector signifying the progressive nature required of courier services in handling increasing parcel volumes.
Pos Malaysia recorded total revenue of RM1.52 billion in 2014, an increase of 12.6% from RM1.35 billion in 2013. Its mail segment at RM0.77 billion revenue still remains as the largest contributor to Pos Malaysia, accounting for more than 50% of total revenue in 2014. It is interesting to note that Pos Malaysia courier segment has posted double digit growth of 27.8% to RM0.46 billion in revenue.
As for the courier industry, a total of 91 courier companies were registered with MCMC in 2014. The top 10 courier companies recorded total revenue of RM2.44 billion, representing a growth of 10.2% from 2013.
Outlook 2015
Moving forward, for Malaysia to remain competitive as a nation, there is a need to focus on several key areas for development. Service providers need to continue their investment in infrastructure deployment and provision of quality services. Both mobile and fixed broadband services vis-à-vis 4G LTE and the upcoming HSBB 2 are essential to fulfil demand for higher broadband speed.
Subsequently, wide communications coverage by both mobile and fixed services serve in paving a solid foundation to drive digital lifestyle and businesses towards a digital economy. The ready access to infrastructure and enhanced connectivity services can be further leveraged by the development of local content industry. That is, by cultivating and nurturing development in mobile apps, games, data analytics, mobile health and others. It is opportune to nurture ecosystems and collaborations in content and applications, which are building blocks for enhanced or new revenue streams for C&M industry. Hence, this contributes to increase the nation’s Gross National Income (GNI) towards a developed nation status.
LICENSING UNDER CMA
Under the Communications and Multimedia Act 1998 (CMA), there are two types of licences, namely, Individual and Class. These licences under the CMA are technology neutral and designed to accommodate services in different and distinct markets. There are four categories of licences, namely Network Facilities, Network Services, Applications Services (Class licence only) and Content Applications Service licences2.
Licensing Profile over the Years
As at end 2014, a total of 331 Individual licences were recorded
The number of Individual licences has increased over the years. As at end 2014, there were 331 Individual licences issued under the CMA. The current total comprises 150 NFP (Individual or “I”), 143 NSP (I) and 38 CASP (I) licence holders.
C&M Licence (Individual) 2005 – 2014
Source: MCMC
Figure i C&M Licence (Individual) 2005 – 2014
Details of the infrastructure/services offered by new and renewed licensed service providers in 2014 are shown in Figure ii.
2 NFP – Network Facilities Provider; NSP – Network Service Provider; CASP – Content Applications Service Provider; ASP – Applications Service Provider; I – Individual; C – Class.
55 63 68 80 83 101 112 123 134 150 61 68 75 87 87 103 114 119 131 143 19 20 23 24 24 35 37 38 39 38 2005 2006 2007 2008 2009 2010 2011 2012 2013 2014
NFP (I) NSP (I) CASP (I)
NUMBER OF LICENCE HOLDER
New and Renewed Licences Issued to Service Providers 2014
Infrastructure and/or Services Company NFP (I) NSP (I) CASP (I)
Deploying communications infrastructure and services for broadband Ridaa Associates Sdn Bhd √ √ Elitemac Resources Sdn Bhd √ √ MyKris Asia Sdn Bhd* √ √ LeBlanc Communications (M) Sdn Bhd √ √ LeBlanc Astana Sdn Bhd √ √ KUB Telekomunikasi Sdn Bhd √ √ Pesona Network Engineering Sdn Bhd √ √
Jalur Dimensi Sdn Bhd √ √
ARL Homecomm Sdn Bhd* √ √
Sunway Digital Wave Sdn Bhd √ √ Platinum Core Solutions Sdn Bhd √ √
Permodalan Risda Sdn Bhd √ √
Stealth Broadband Sdn Bhd* √ √ Optical Communications Engineering Sdn Bhd* √ √
VDSL Network Sdn Bhd* √ √
TT dotCom Sdn Bhd* √ √
Deployment of communications towers to support cellular and broadband services
Kenanga Marketing Sdn Bhd √ Arra Solutions Sdn Bhd √ Wasilah Engineering Sdn Bhd √
GTP Network Sdn Bhd √
Provisioning of voice, data, broadband and VOIP services
R & D Solution Sdn Bhd √
REDtone Marketing Sdn Bhd* √
Deployment of communications infrastructure to support cellular and broadband services
Justclick Vision Sdn Bhd √ Setia Haruman Technology Sdn Bhd* √ Jaring Communications Sdn Bhd* √ Airzed Broadband Sdn Bhd* √ Ikhlas Informasi Teknologi Sdn Bhd √ Mustika Teratai Sdn Bhd √
Baycom Sdn Bhd* √
Mobile Virtual Network Operator
(MVNO) Xiddig Cellular Communications Sdn Bhd √
Bandwidth services
OCK Setia Engineering Sdn Bhd √
Premium Radius Sdn Bhd √
Edotco Malaysia Sdn Bhd
(Formerly known as Celcom Services Sdn Bhd) √
Common Tower Technologies Sdn Bhd* √ BT Systems (Malaysia) Sdn Bhd √
AIMS Data Centre Sdn Bhd* √
Telstra Malaysia Sdn Bhd* √
Terrestrial radio broadcasting One FM Radio Sdn Bhd* √
Total 27 26 1
*Renewal Source: MCMC
Figure ii New and Renewed Licence Issued to Service Providers 2014
In 2014, two foreign-owned companies were issued with NSP (I) licences, namely BT Systems (Malaysia) Sdn Bhd and Telstra Malaysia Sdn Bhd (renewal). The breakdown of the shareholding composition by ethnicity/nationality/institution for the Individual licence holders is shown in the figure below.
2005 – 2014
Individual Licence Holder – Shareholding Composition by Types of Licence 2014
Note:
Bumiputera-owned – company that has 51% or more Bumiputera ownership Non-Bumiputera-owned – company that has 51% or more non-Bumiputera ownership GLC – Government-linked company
Foreign-owned – company that has 51% or more shares held by foreign entities or individuals
Others – mixed shareholding, with no particular type of shareholder having a controlling interest in the company Source: MCMC
Figure iii Individual Licence Holder – Shareholding Composition by Types of Licence 2014
Individual Licence Holder – Shareholding Composition by Ethnicity/Nationality/Institution 2012 – 2014
*Others – mixed shareholding, with no particular type of shareholder having a controlling interest in the company Source: MCMC
Figure iv Individual Licence Holder – Shareholding Composition by Ethnicity/Nationality/Institution 2012 – 2014
Between 2012 and 2014, more Bumiputera-owned companies were issued with Individual licence, representing an increase of more than 33% to 157 licences in 2014 from 118 licences in 2012. 118 70 36 43 10 135 46 45 10 68 157 69 53 11 41
Bumiputera Non-Bumiputera GLC Foreign Others*
2012 2013 2014
NUMBER OF LICENCE HOLDER
54% 20%
17% 1% 8%
Bumiputera Non-Bumiputera GLC Foreign Others*
NFP (I)
44% 23% 16% 6% 11%NSP (I)
34% 19% 13% 34%CASP (I)
16
In 2014, two foreign-owned companies were issued with NSP (I) licences, namely BT Systems (Malaysia) Sdn Bhd and Telstra Malaysia Sdn Bhd (renewal). The breakdown of the shareholding composition by ethnicity/nationality/institution for the Individual licence holders is shown in the figure below.
2005 – 2014
Individual Licence Holder – Shareholding Composition by Types of Licence 2014
Note:
Bumiputera-owned – company that has 51% or more Bumiputera ownership Non-Bumiputera-owned – company that has 51% or more non-Bumiputera ownership GLC – Government-linked company
Foreign-owned – company that has 51% or more shares held by foreign entities or individuals
Others – mixed shareholding, with no particular type of shareholder having a controlling interest in the company Source: MCMC
Figure iii Individual Licence Holder – Shareholding Composition by Types of Licence 2014
Individual Licence Holder – Shareholding Composition by Ethnicity/Nationality/Institution 2012 – 2014
*Others – mixed shareholding, with no particular type of shareholder having a controlling interest in the company Source: MCMC
Figure iv Individual Licence Holder – Shareholding Composition by Ethnicity/Nationality/Institution 2012 – 2014
Between 2012 and 2014, more Bumiputera-owned companies were issued with Individual licence, representing an increase of more than 33% to 157 licences in 2014 from 118 licences in 2012. 118 70 36 43 10 135 46 45 10 68 157 69 53 11 41
Bumiputera Non-Bumiputera GLC Foreign Others*
2012 2013 2014
NUMBER OF LICENCE HOLDER
54% 20%
17% 1% 8%
Bumiputera Non-Bumiputera GLC Foreign Others*
NFP (I)
44% 23% 16% 6% 11%NSP (I)
34% 19% 13% 34%CASP (I)
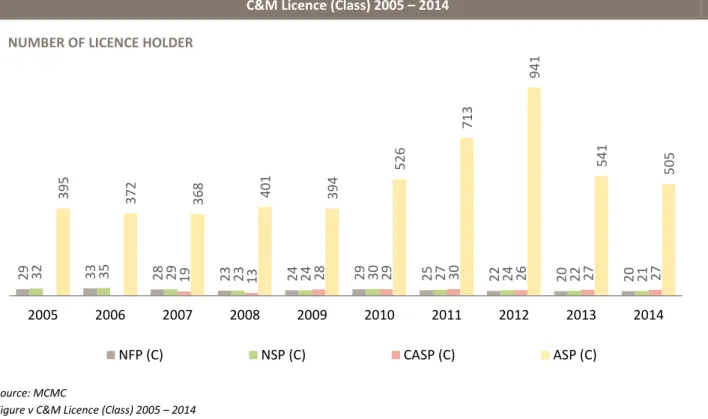
In 2014, a total of 573 Class licences were registered with MCMC
As for Class licences, there were 20 NFP (Class or “C”), 21 NSP (C), 27 CASP (C) and 505 ASP (C) licences registered. Although there was a slight decline in terms of the total number of ASP (C) licences from 541 to 505, this fluctuation is considered normal for ASP (C) licences.
&M Licensees (Individual) 2005 – 2014
C&M Licence (Class) 2005 – 2014
Source: MCMC
Figure v C&M Licence (Class) 2005 – 2014
Roll-out Status in 2014
Special licence condition Part B 1.2, states the requirement for licensees to comply with the following:
a) The licensee shall commence the provision of facilities/services within 12 months from the date of its licence issued;
b) However, the Minister may upon an application being made, grant an extension of time to the licensee if the Minister is satisfied that there has been genuine progress made towards the provision of facilities/services.
As at end 2014, from a total of 22 new Individual licensees approved, 32% or 7 of these licensees managed to roll-out their facilities/services within the first year. These licensees are shown in Figure vi as follows:
29 32 33 35 28 29 19 23 23 13 24 24 28 29 30 29 25 27 30 22 24 26 20 22 27 20 21 27 395 372 368 401 394 52 6 713 94 1 541 505 2005 2006 2007 2008 2009 2010 2011 2012 2013 2014 NFP (C) NSP (C) CASP (C) ASP (C)
NUMBER OF LICENCE HOLDER
Facilities/Services Deployed within 12 Months
No. Licensee Types of Licence Facilities/Services Deployed
1 Genmedia Sdn Bhd CASP (I) Free-To-Air Radio (1M4U)
2 Omnix (M) Sdn Bhd NFP (I) Deployment of telecommunications structures (Aesthetic/camouflage) 3 Enabling Asia Sdn Bhd NSP (I) Mobile Virtual Network Aggregator (MVNA) 4 Verticom Resources Sdn Bhd NFP (I), NSP (I) NFP (I) only. Deployment of telecommunications
structures
5 Adil Bestari Sdn Bhd NFP (I), NSP (I) In Building Coverage (IBC) via Common Antenna Sharing Solutions
6 Telekomunikasi Indonesia (M) Sdn Bhd NSP (I) Mobile Virtual Network Operator (MVNO) 7 Komasi Enterprise Sdn Bhd NFP (I), NSP (I) NFP (I) only. Fibre optic network (dark fibre
leasing) Source: MCMC
Figure vi Facilities/Services Deployed within 12 Months
MODULE 1:
ECONOMIC
C&M Industry vis-à-vis Bursa Malaysia Performance
C&M industry market capitalisation surpassed RM200 billion in 2014
As at end 2014, the major Communications and Multimedia (C&M) companies captured RM208.48 billion in market capitalisation (2013: RM195.33 billion). This represents 12.6% of the Bursa Malaysia market capitalisation of RM1,651.17 billion. It is noted that in 2014, the C&M market capitalisation increased 6.7% compared with the overall stock market which posted a decline of 3%.
Overall, Bursa Malaysia performance was linked to external factors impacting the Malaysian economy such as drastic decline in crude oil prices and a weaker Ringgit, which caused some capital outflow. In contrast, the C&M industry market capitalisation was relatively contained, being mainly domestic market focused.
C&M Companies Contribution to Bursa Malaysia 2014
Source: Bloomberg, MCMC
Figure 1.1 C&M Companies Contribution to Bursa Malaysia 2014
By sectors, telecommunications companies captured market capitalisation of RM188.28 billion. This is an increase of 8.3% from RM173.92 billion in 2013. Both broadcasting and postal companies showed a decline in market capitalisation by 4.1% to RM17.71 billion (2013: RM18.47 billion) and 15.3% to RM2.49 billion (2013: RM2.94 billion) respectively.
C&M Companies Market Capitalisation 2012 – 2014
Company Market Capitalisation (RM billion) YoY Growth (%)
2012 2013 2014 2013 2014 Telecommunications Axiata 56.07 58.93 60.50 5.1 2.7 Maxis 49.88 54.55 51.42 9.4 -5.7 DiGi 41.13 38.56 47.97 -6.2 24.4 TM 21.61 19.85 25.59 -8.1 28.9 TIME 2.26 2.03 2.80 -10.2 37.9 Broadcasting ASTRO 15.59 15.59 15.76 No Change 1.1 Media Prima 2.53 2.88 1.95 13.8 -32.3 Postal Pos Malaysia 1.87 2.94 2.49 57.2 -15.3 Total 190.94 195.33 208.48 2.3 6.7 Bursa Malaysia 1,465.68 1,702.15 1,651.17 16.1 -3.0
C&M as % of Bursa Malaysia 13.0% 11.5% 12.6% - -
Note: Axiata Group Bhd (Axiata), Maxis Bhd (Maxis), DiGi.Com Bhd (DiGi), Telekom Malaysia Bhd (TM), TIME dotCom Bhd (TIME), Astro Malaysia Holdings Bhd (ASTRO), Media Prima Bhd (Media Prima), Pos Malaysia Bhd (Pos Malaysia)
Source: Bloomberg, MCMC
Figure 1.2 C&M Companies Market Capitalisation 2012 – 2014
Highlighting companies with double digit gains by percentage, TIME dotCom (TIME) registered the highest increase in market capitalisation by 37.9% to RM2.8 billion in 2014 from RM2.03 billion in 2013. The increase was driven by better investor sentiment upon its improved earnings in the year and better prospects on business developments such as submarine cable projects.
Meanwhile, Telekom Malaysia (TM) also recorded favourable market performance, with gain in market capitalisation by 28.9% to RM25.59 billion in 2014 (2013: RM19.85 billion). This was buoyed by it being awarded broadband projects namely, High Speed Broadband Phase 2 (HSBB 2) and Sub Urban Broadband (SUBB) of RM1.8 billion and RM1.6 billion respectively over a ten year period. TM’s entry into the wireless market via its acquisition of a 57% stake in Packet One Networks (Malaysia) Sdn Bhd also boosted TM market capitalisation.
Similarly, DiGi registered double digit gains, that is, 24.4% increase in market capitalisation to RM47.97 billion (2013: RM38.56 billion) upon stronger financial performance. DiGi revenue showed an increase of 4.3% to RM7.02 billion in 2014 from RM6.73 billion in 2013. This earnings growth is contributed by its affordable data services offerings that is supported by improved 3G coverage.
Among the highest market capitalisation companies in Bursa Malaysia, Axiata, Maxis and DiGi ranked fourth, sixth and seventh, respectively, in the top 10 market capitalisation list. Axiata market capitalisation was RM60.5 billion or 3.7% of total Bursa Malaysia market capitalisation, while Maxis and DiGi captured RM51.42 billion (3.1%) and RM47.97 billion (2.9%) respectively. Both Maxis and DiGi improved their ranking in the list in 2014, while Axiata remained at fourth place.
C&M Industry vis-à-vis Bursa Malaysia Performance
C&M industry market capitalisation surpassed RM200 billion in 2014
As at end 2014, the major Communications and Multimedia (C&M) companies captured RM208.48 billion in market capitalisation (2013: RM195.33 billion). This represents 12.6% of the Bursa Malaysia market capitalisation of RM1,651.17 billion. It is noted that in 2014, the C&M market capitalisation increased 6.7% compared with the overall stock market which posted a decline of 3%.
Overall, Bursa Malaysia performance was linked to external factors impacting the Malaysian economy such as drastic decline in crude oil prices and a weaker Ringgit, which caused some capital outflow. In contrast, the C&M industry market capitalisation was relatively contained, being mainly domestic market focused.
C&M Companies Contribution to Bursa Malaysia 2014
Source: Bloomberg, MCMC
Figure 1.1 C&M Companies Contribution to Bursa Malaysia 2014
By sectors, telecommunications companies captured market capitalisation of RM188.28 billion. This is an increase of 8.3% from RM173.92 billion in 2013. Both broadcasting and postal companies showed a decline in market capitalisation by 4.1% to RM17.71 billion (2013: RM18.47 billion) and 15.3% to RM2.49 billion (2013: RM2.94 billion) respectively.
Top 10 Market Capitalisation 2013 – 2014
*As at 31 December
Note: Top 10 largest stocks based on market capitalisation among the 30 stocks that comprise the FTSE Bursa Malaysia KLCI Index Source: Bloomberg, MCMC
Figure 1.3 Top Ten Market Capitalisation 2013 – 2014
38.56 48.04 54.55 55.36 57.21 58.90 58.93 64.22 67.94 88.09 DiGi Petronas Gas Maxis Petronas Chemicals Sime Darby CIMB Axiata Tenaga Nasional Public Bank Maybank MARKET CAPITALISATION* (RM billion)
2013
43.60 43.85 46.84 47.97 51.42 55.73 60.50 70.67 77.88 85.46 Petronas Chemicals Petronas Gas CIMB DiGi Maxis Sime Darby Axiata Public Bank Tenaga Nasional Maybank2014
22
Top 10 Market Capitalisation 2013 – 2014
*As at 31 December
Note: Top 10 largest stocks based on market capitalisation among the 30 stocks that comprise the FTSE Bursa Malaysia KLCI Index Source: Bloomberg, MCMC
Figure 1.3 Top Ten Market Capitalisation 2013 – 2014
38.56 48.04 54.55 55.36 57.21 58.90 58.93 64.22 67.94 88.09 DiGi Petronas Gas Maxis Petronas Chemicals Sime Darby CIMB Axiata Tenaga Nasional Public Bank Maybank MARKET CAPITALISATION* (RM billion)
2013
43.60 43.85 46.84 47.97 51.42 55.73 60.50 70.67 77.88 85.46 Petronas Chemicals Petronas Gas CIMB DiGi Maxis Sime Darby Axiata Public Bank Tenaga Nasional Maybank2014
C&M Industry Financial Performance
C&M industry generated RM59 billion in revenue, a growth of 3% in 2014
C&M Industry Revenue 2012 – 2014
Note: 1. Media Prima excludes print revenue
2. ASTRO and Pos Malaysia revenue adjusted based on a calendar year basis 3. Others include digital signature, ACE Market and other licensees’ revenue Source: Industry, MCMC
Figure 1.4 C&M Industry Revenue 2012 – 2014
The total C&M industry revenue generated by major companies in telecommunications, broadcasting and postal sectors was RM58.91 billion in 2014, a growth of 3% from RM57.2 billion in 2013. It is noted that the C&M industry grew at a moderate pace despite the economic uncertainties and amid stiff competition. Note that the total revenue for 2014 was inclusive of other licensees’ revenue covering 66 non-public listed companies. Hence, the 2012 and 2013 comparative figures have been restated.
During the year, telecommunications revenue contributed 78% (RM45.96 billion) to total revenue, followed by broadcasting and postal sectors at 10.5% (RM6.18 billion) and 2.6% (RM1.52 billion) respectively. The developments that had an impact on the C&M industry revenue included:
Growth in data services revenue was supported by the shift of consumer preference to OTT communications channels and social media. Consequently, this has caused decline in the traditional voice and SMS services revenue.
Consumers have many choices of connected devices in the market. The devices feature more advanced technology, design and capabilities that provide consumers access to more content and multimedia functions. These have driven higher adoption and data usage for applications and services.
Growth in higher bandwidth subscriptions, as a result of consumers upgrading to attractive data plans at affordable price.
Wider range of services and content are contributing to the growth of TV viewership. This resulted in continued investment by service providers in content and innovation to offer more choices to consumers and preserving sustainable revenue growth.
As digital media activities by consumers increase rapidly, broadcasters and advertisers
recognise the importance of digital platforms in reaching targeted audiences. Hence, service providers are venturing into digital platforms to monetise their content.
Driving Talent in C&M Industry
In line with the growth of the total C&M industry revenue, there is a need of a pool of competitive workforce to support the growing industry. The number of workforce in C&M industry is on the rise, as service providers poised themselves to keep up with various service development and technological changes such as 4G LTE, high speed broadband and digital TV deployment. The demand for quality network and new technologies, along with the growing use of smart devices is expected to drive employment growth in the C&M and related services industry.
In 2014, the C&M industry workforce totalled 95,847 employees, up 8.7% (2013: 88,213 employees); accounting for 1% of total Malaysian workforce of 14.2 million3. Employment increased by 11% from 2013 for the telecommunications sector and 7% for the postal sector. However, employment for broadcasting sector declined by 4% (Figure 1.5) due to Mutual Separation Scheme (MSS) of Media Prima.
C&M Industry Workforce 2012 – 2014
Moving forward, the growth in C&M industry continues to drive job creation related to content and applications development, network security, data analytics and digital intelligence. This offers a wide range of career prospects as the industry requires manpower for
upgrade, expansion and more
innovative services.
Driving towards a smart nation, the C&M sector as a knowledge-based industry is one of the building blocks that fosters creative and adept talent for continued growth.
Source: Industry, MCMC
Figure 1.5 C&M Industry Workforce 2012 – 2014
3 Department of Statistics Malaysia, Labour Force Statistics Malaysia December 2014, February 2015.
53,861 56,937 63,006 9,141 9,379 8,978 16,153 4,233 17,072 18,265 4,825 5,598 2012 2013 2014 Others Postal Broadcasting Telecommunications 14.0%↑ 16.0%↑ 5.7%↑ 7.0%↑ 2.6%↑ 4.3%↓ 5.7%↑ 10.7%↑ WORKFORCE (Number of Employees)
25
Telecommunications
Telecommunications sector revenue grew marginally by 1.3% in 2014
Telecommunications Revenue 2012 – 2014
Note: Axiata revenue excludes Celcom revenue which is shown separately here Source: Industry, MCMC
Figure 1.6 Telecommunications Revenue 2012 – 2014
The C&M industry remains stable with total telecommunications sector revenue increased marginally by 1.3% (or RM0.6 billion) to RM45.96 billion in 2014. This is based on aggregated revenue from major telecommunications companies listed on Bursa Malaysia namely, Axiata, Maxis, DiGi, TM and TIME.
During the year, total mobile voice revenue fell 4.4% to RM12.61 billion while SMS revenue fell 27.2% to RM1.87 billion. The decline of mobile voice and SMS revenue was partly due to lower voice and SMS usage.
In terms of text messages sent, there were 49 billion SMS as at end 2014, declined by 36.4% from 77 billion SMS in 2013.
Telecommunications Revenue by Service Category 2012 – 2014
Note: 1. Mobile data includes Value Added Service (VAS) 2. Excludes Axiata foreign operations
3. Fixed voice and broadband revenue from TM and TIME only Source: Industry, MCMC
Figure 1.7 Telecommunications Revenue by Service Category 2012 – 2014
RM43.39 billion
2012
2013
RM45.36 billion
2014
RM45.96 billion
22.8% 22.8% 23.9% 17.8% 17.7% 16.8% 20.7% 20.0% 18.3% 14.7% 14.8% 15.3% 23.0% 23.4% 24.5% 1.0% 1.2% 1.3% 2012 2013 2014Axiata Celcom Maxis DiGi TM TIME
13.41 13.19 12.61 5.08 5.93 6.96 3.04 2.57 1.87 3.79 3.70 3.54 2.68 3.09 3.46 2012 2013 2014 REVENUE (RM billion) Fixed Broadband Fixed Voice Mobile Messaging Mobile Data Mobile Voice 15.3%↑ 12.0%↑ 2.4%↓ 4.3%↓ 15.5%↓ 27.2%↓ 16.7%↑ 17.4%↑ 1.6%↓ 4.4%↓
26
Telecommunications
Telecommunications sector revenue grew marginally by 1.3% in 2014
Telecommunications Revenue 2012 – 2014
Note: Axiata revenue excludes Celcom revenue which is shown separately here Source: Industry, MCMC
Figure 1.6 Telecommunications Revenue 2012 – 2014
The C&M industry remains stable with total telecommunications sector revenue increased marginally by 1.3% (or RM0.6 billion) to RM45.96 billion in 2014. This is based on aggregated revenue from major telecommunications companies listed on Bursa Malaysia namely, Axiata, Maxis, DiGi, TM and TIME.
During the year, total mobile voice revenue fell 4.4% to RM12.61 billion while SMS revenue fell 27.2% to RM1.87 billion. The decline of mobile voice and SMS revenue was partly due to lower voice and SMS usage.
In terms of text messages sent, there were 49 billion SMS as at end 2014, declined by 36.4% from 77 billion SMS in 2013.
Telecommunications Revenue by Service Category 2012 – 2014
Note: 1. Mobile data includes Value Added Service (VAS) 2. Excludes Axiata foreign operations
3. Fixed voice and broadband revenue from TM and TIME only Source: Industry, MCMC
Figure 1.7 Telecommunications Revenue by Service Category 2012 – 2014
RM43.39 billion
2012
2013
RM45.36 billion
2014
RM45.96 billion
22.8% 22.8% 23.9% 17.8% 17.7% 16.8% 20.7% 20.0% 18.3% 14.7% 14.8% 15.3% 23.0% 23.4% 24.5% 1.0% 1.2% 1.3% 2012 2013 2014Axiata Celcom Maxis DiGi TM TIME
13.41 13.19 12.61 5.08 5.93 6.96 3.04 2.57 1.87 3.79 3.70 3.54 2.68 3.09 3.46 2012 2013 2014 REVENUE (RM billion) Fixed Broadband Fixed Voice Mobile Messaging Mobile Data Mobile Voice 15.3%↑ 12.0%↑ 2.4%↓ 4.3%↓ 15.5%↓ 27.2%↓ 16.7%↑ 17.4%↑ 1.6%↓ 4.4%↓
Both mobile voice and SMS usage were affected by the increasing use of other communication methods such as OTT messaging apps, e-mail and social media, which required mobile data subscription.
Hence, mobile data revenue continued to show a double digit growth in 2014, that is, 17.4% growth in mobile data revenue to RM6.96 billion in 2014 compared with 2013 at RM5.93 billion. This was due to more cheaper devices available concurrently with attractive data packages.
Fixed voice revenue decreased by 4.3% to RM3.54 billion in 2014, as a result of declining fixed line subscriptions (decline 2.7% to 3.6 million as at end 2014 compared with 3.7 million in 2013). The decline is partly due to consumer preference for mobile and alternative communication methods, such as e-mail, OTT messaging apps and social media.
In contrast, fixed broadband revenue increased by 12% to RM3.46 billion in 2014, as a result of growth in subscriptions. The number of fixed broadband subscriptions was 2.6 million in 2014 from 2.4 million in 2013, an 8.3% increase. The continued rise in the consumption of digital content at home, whether via laptop, desktop computer or connected TV, also led to increased fixed broadband take-up.
Capital Expenditure (Capex)
As at end 2014, Capex to revenue ratio for telecommunications companies averaged 14%, with fixed service providers marking a higher ratio at 18% and mobile service providers at 12%. The telecommunications companies Capex in 2013 and 2014 is shown in the figure below.
Telecommunications Capex 2013 – 2014 Company
Capex
(RM million) Capex/Revenue Ratio (%)
2013 2014 2013 2014 TM 1,863 1,836 18 16 TIME 171 254 31 43 Total (Fixed) 2,034 2,090 18 18 Maxis 815 1,140 9 14 DiGi 741 904 11 13 Celcom Axiata 923 845 12 11 Total (Mobile) 2,479 2,889 10 12 TOTAL 4,513 4,979 13 14 Source: Industry
Figure 1.8 Telecommunications Capex 2013 – 2014
In 2014, TM Capex spent was RM1,836 million. This was for enhancing their core network, access and support systems.
Meanwhile, TIME invested RM254 million in Capex, in which nearly 55% of these were spent on submarine cable systems development in 2014.
Maxis invested RM1,140 million in Capex in 2014 for network modernisation, capacity and quality improvements, including:
Modernisation of 2G and 3G networks to single Radio Access Network (RAN);
4G LTE coverage expansion; and
IT transformation that focused on its billing and customer relationship management platform.
DiGi invested RM904 million in Capex to strengthen its infrastructure capabilities in 2014. This includes the delivery of a convergent billing system and expansion of 3G population coverage and 4G LTE sites.
As for Celcom, the service provider spent a total of RM845 million in Capex for its 4G LTE development, IT and network optimisation programme4.
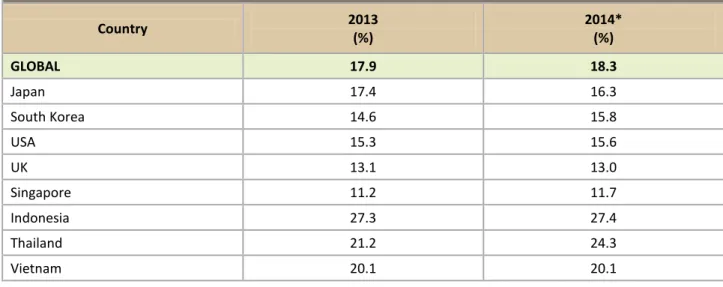
OVUM in their Communications Service Provider Revenue & Capex Forecast: 2014‒19 report has indicated that the global Capex to revenue ratio for 2014 is expected to reach 18.3% (Figure 1.9). Comparatively, Malaysian telecommunications companies recorded Capex to revenue ratio at an average of 14% in 2014, that is, below the global average.
4 The Malaysian Reserve, Celcom to spend RM950 million this year to boost network, June 2014.
Capital Expenditure (Capex)
As at end 2014, Capex to revenue ratio for telecommunications companies averaged 14%, with fixed service providers marking a higher ratio at 18% and mobile service providers at 12%. The telecommunications companies Capex in 2013 and 2014 is shown in the figure below.
Telecommunications Capex 2013 – 2014 Company
Capex
(RM million) Capex/Revenue Ratio (%)
2013 2014 2013 2014 TM 1,863 1,836 18 16 TIME 171 254 31 43 Total (Fixed) 2,034 2,090 18 18 Maxis 815 1,140 9 14 DiGi 741 904 11 13 Celcom Axiata 923 845 12 11 Total (Mobile) 2,479 2,889 10 12 TOTAL 4,513 4,979 13 14 Source: Industry
Figure 1.8 Telecommunications Capex 2013 – 2014
In 2014, TM Capex spent was RM1,836 million. This was for enhancing their core network, access and support systems.
Meanwhile, TIME invested RM254 million in Capex, in which nearly 55% of these were spent on submarine cable systems development in 2014.
Maxis invested RM1,140 million in Capex in 2014 for network modernisation, capacity and quality improvements, including:
Modernisation of 2G and 3G networks to single Radio Access Network (RAN);
4G LTE coverage expansion; and
IT transformation that focused on its billing and customer relationship management platform.
DiGi invested RM904 million in Capex to strengthen its infrastructure capabilities in 2014. This includes the delivery of a convergent billing system and expansion of 3G population coverage and 4G LTE sites.
As for Celcom, the service provider spent a total of RM845 million in Capex for its 4G LTE development, IT and network optimisation programme4.
OVUM in their Communications Service Provider Revenue & Capex Forecast: 2014‒19 report has indicated that the global Capex to revenue ratio for 2014 is expected to reach 18.3% (Figure 1.9). Comparatively, Malaysian telecommunications companies recorded Capex to revenue ratio at an average of 14% in 2014, that is, below the global average.
4 The Malaysian Reserve, Celcom to spend RM950 million this year to boost network, June 2014.
Communications Service Provider Capex/Revenue Ratio by Selected Countries 2013 – 2014
Country 2013 (%) 2014* (%) GLOBAL 17.9 18.3 Japan 17.4 16.3 South Korea 14.6 15.8 USA 15.3 15.6 UK 13.1 13.0 Singapore 11.2 11.7 Indonesia 27.3 27.4 Thailand 21.2 24.3 Vietnam 20.1 20.1 *Forecast
Source: OVUM, Communications Service Provider Revenue & Capex Forecast: 2014–2019, January 2015 Figure 1.9 Communications Service Provider Capex/Revenue Ratio by Selected Countries 2013 – 2014
Globally, the investment in infrastructure is on an increasing trend, albeit developed countries at a slower rate vis-à-vis developing countries. In Malaysia, infrastructure investments need to be at a faster pace in order to improve quality of service and bandwidth capacity to cater to increasing digital transactions and demand for real time services. In this way, the industry is able to support accelerating development towards a smart nation.