THE INHIBITIVE EFFECT OF
DIETHYLENETRIAMINE-PENTAMETHYLENEPHOSPHONIC ACID ON THE
CORROSION OF CARBON STEEL IN SEA WATER
K. Kavipriya
[a]*,J. Sathiyabama
[a], and S. Rajendran
[a,b],
and
R. Nagalakshmi
[c]Keywords: corrosion inhibition; carbon steel; electrochemical techniques; atomic force microscopy; diethylenetriamine pentamethylenephosphonic acid
The inhibition of the corrosion of carbon steel in sea water by diethylene triamine pentamethylene phosphonic acid (DTPMP) and Ni2+ has
been investigated using weight loss and electrochemical measurements. The results show that 70% inhibition efficiency is achieved with
binary system consisting of 250 ppm of DTPMP and 50 ppm of Ni2+.Polarization curves indicate that the system functioned as a cathodic
inhibitor. AC impedance spectra reveal that a protective film is formed on the metal surface. The protective film has been analysed by FTIR spectra. The surface morphology and the roughness of the metal surface have been analysed by atomic force microscopy.
* Corresponding Authors
E-Mail: [email protected]
[a] Corrosion Research Centre, PG and Research Department of Chemistry, GTN Arts College, Dindigul, Tamil Nadu, India 624005, *Email:
[b] Department of Chemistry, RVS School of Engineering and Technology. Dindigul, Tamil Nadu, India 624005; Email: [email protected]
[c] Department of Chemistry, Aarupadai Veedu Institute of Technology, Chennai, Tamil Nadu, India 603110, Email: [email protected]
INTRODUCTION
Sea water is a complex natural electrolyte. Sea water contains many corrosive electrolytes such as sodium chloride, magnesium chloride, calcium chloride, etc.; hence, carbon steel immersed in sea water is corroded slowly because of chemical reactions between the metal and the electrolytes.1-3 Corrosion is the gradual destruction of
material, usually metal, by chemical reaction with its environment. The corrosion is severe due to the presence of chloride ions and dissolved oxygen. Sea water has been used as cooling fluid in various industries. Carbon steel is widely used in infrastructure in marine environments.4 It is one of
the major constituents in structural steel applications including body of a ship, offshore platforms, foundation piling, sheet piling, and coastal facilities. It is also used in industry where the metal is exposed to acid corrosion. So, it is imperative to study the corrosion aspect and find out suitable corrosion inhibitors to be used in sea water. Inhibition of corrosion and scaling can be done by the application of inhibitors, which is one of the most practical and economic methods for protection against metallic corrosion.5,6 Corrosion inhibitors disclose that most organic
substances used as corrosion inhibitors can adsorb on the metal surface employed through heteroatoms such as nitrogen, oxygen, sulphur, and phosphorus, multiple bonds or aromatic rings and block the active sites decreasing the corrosion rate.15 Several phosphonic acids have been used as
corrosion inhibitor.7-9 Our co-workers have conducted
various research works using phosphonic acids as an
inhibitor.10 Phosphonic acids are organic compounds
containing R-PO(OH)2 or R-PO(OR)2 groups. They are
effective chelating agents that are used in cooling water and desalination systems to inhibit scale formation and corrosion. Phosphonic acids are extensively used now-a-days due to their complex forming abilities, high stability under harsh conditions, and low toxicity.11 They are also used as
corrosion inhibitors in concrete, coating, rubber blends, acids cleaners and anti-freeze coolants.12,13 The inhibition
efficiency of phosphonates depends on the number of phosphono groups in a molecule and also on different substituents. Compounds with a phosphonic functional group are considered to be the most effective chemical for inhibiting the corrosion process and it is well known that short-chain-substituted phosphonic acids are good corrosion inhibitors for iron and low-alloyed steels.14
The present study aims a) to find out the corrosion inhibition effects of diethylene triamine pentamethylene phosphonic acid (DTPMP) and Ni2+ system on carbon steel
in sea water using weight-loss method b) electrochemical techniques provide information on the corrosion rate, as well as on processes at interfaces affected by additives c) to analyse the protective film by Fourier Transform Infrared Spectroscopy (FTIR) d) to study the surface morphological changes during iron corrosion by Atomic Force Microscopy (AFM) e) to propose a suitable mechanism of corrosion inhibition based on the results from the above studies.
EXPERIMENTAL
Preparation of Specimen
Weight-Loss Method
Carbon steel specimens in triplicate were immersed in 100 mL of the solutions containing various concentrations of the inhibitor in the absence and presence of Ni2+(as NiSO
4. 6H2
O) for one day. The weight of the specimens before and after immersion was determined using a Shimadzu balance, model AY62. The corrosion products were cleaned with Clarke’s solution.16 The inhibition efficiency (IE, in %) was
then calculated using the equation:
where W1 is the weight loss value in the absence of inhibitor
and W2 is theweight loss value in the presence of inhibitor.
Polarization Study
Polarization studies were carried out with a CHI-electrochemical workstation with impedance model 660A. A three-electrode cell assembly was used. The working electrode was carbon steel. The exposed surface area was 1 cm2. A saturated calomel electrode (SCE) was used as the
reference electrode and a rectangular platinum foil was used as the counter electrode.
AC impedance spectra
The instrument used for polarization study was also used for AC impedance spectra. The cell set up was the same as that was used for polarization measurements. The real part (Z') and the imaginary part (Z'') of the cell impedance were measured in ohms at various frequencies. AC impedance spectra were recorded with initial E(v) = 0 V, high frequency
limit was 1x10⁵ Hz, low frequency limit was 1 Hz,
amplitude = 0.005 V and quiet time tq= 2 s. The values of
charge transfer resistance, Rt, and the double layer
capacitance, Cdl, were calculated.
Cdl = ½ Rtfmax (2)
where fmax is maximum frequency.
Surface Examination Study
The carbon steel specimens were immersed in various test solutions for a period of one day. After one day, the specimens were taken out and dried. The nature of the film formed on the surface of the metal specimen was analysed by various surface analysis techniques.
Fourier Transform Infrared Spectra (FTIR)
The FTIR spectra were recorded in a Perkin-Elmer-1600 spectrophotometer. The film formed on the metal surface was carefully removed and mixed thoroughly with KBr making the pellet.
Atomic Force Microscopy
Atomic Force Microscope (AFM) is an exciting new technique that allows surface to be imaged at higher resolutions and accuracies than ever before. The microscope used for the present study was PicoSPM Molecular Imaging, USA make. Polished specimens prior to the initiation of all corrosion experiments were examined through an optical microscope to find out any surface defects such as pits or noticeable irregularities like cracks, etc. Only those specimens, which had a smooth, pit-free surface were subjected for AFM examination. The protective film formed on the carbon steel specimens after immersion in the inhibitor systems for different time durations were examined for a scanned area of 30 x 30 m2 and 15 x 15 m2. The
two-dimensional and three-dimensional topography of surface films gave various roughness parameters of the film.
RESULTS AND DISCUSSION
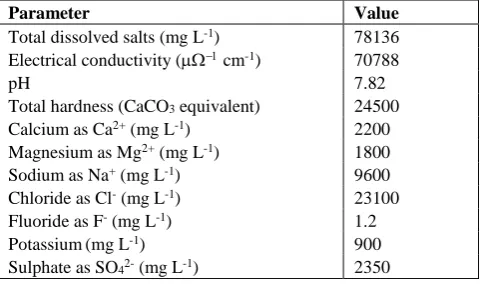
The physicochemical parameters of sea water used in the present study are given in Table 1.
Table 1. The physicochemical parameters of natural sea water collected in Mandapam, Tamilnadu, India.
Weight-Loss Method
Table 2 gives values of the corrosion inhibition efficiencies and the corresponding corrosion rates of diethylene triamine pentamethylene phosphonic acid (DTPMP)-Ni2+system in controlling corrosion of carbon
steel in sea water for a period of 24 hours. The DTPMP alone has high rate of corrosion. The inhibition efficiency of DTPMP is improved by adding various concentrations of Ni2+ .Similar observations have been made by Umamathi et
al17 where they have improved the inhibition efficiency of
Na3PO4 on EDTA by addition of Zn2+ ion. Mary Anbarasi
and Rajendran18 have improved the inhibition efficiency of
heptane sulphonic acid by addition of Zn2+ ion. However,
with increasing the concentration of DTPMP as well as Ni2+,
the maximum inhibition is achieved and the corrosion rate is decreased. It is found that 250 ppm of DTPMP and 50 ppm of Ni2+has 70% inhibition efficiency. The inhibition
efficiency increases with the increase of concentration of inhibitors. This behaviour could be attributed to the increase of the surface area covered by the adsorbed molecules of phosphonic acid with the increase of its concentration.
Parameter Value
Total dissolved salts (mg L-1) 78136
Electrical conductivity (cm-1) 70788
pH 7.82
Total hardness (CaCO3 equivalent) 24500
Calcium as Ca2+ (mg L-1) 2200
Magnesium as Mg2+ (mg L-1) 1800
Sodium as Na+ (mg L-1) 9600
Chloride as Cl- (mg L-1) 23100
Fluoride as F- (mg L-1) 1.2 Potassium(mg L-1) 900
Sulphate as SO42- (mg L-1) 2350
2
100 1 (1)
1 W IE
W
Table 2. The inhibition efficiency (IE %) and the corrosion rate (mm y-1) of DTPMP – Ni2+ system determined by weight-loss method.
Table 3. Corrosion parameters of carbon steel immersed in sea water in the presence and absence of inhibitor obtained by polarization method.
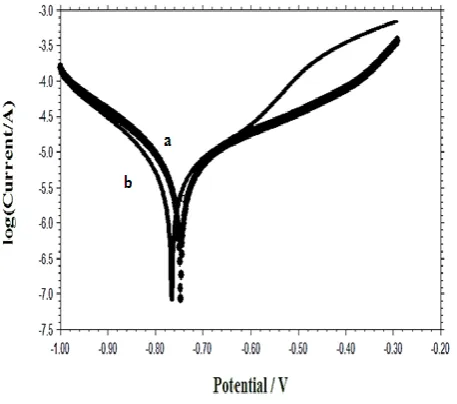
Potentiodynamic Polarization Study
Polarization study has been used to detect the formation of protective film on the metal surface.19-22 The polarization
curves of carbon steel immersed in various test solutions are shown in Fig.1. The cathodic branch represents the oxygen reduction reaction, while the anodic branch represents the iron dissolution reaction. The corrosion parameters such as corrosion potential (Ecorr), corrosion current density (Icorr),
Tafel slopes (bc and ba) and linear polarization resistance
(LPR) are given in Table 3.
Figure 1. Polarization curves of carbon steel immersed in a) sea
water b) sea water + DTPMP 250 ppm + Ni2+ 50 ppm.
When carbon steel is immersed in sea water, the corrosion potential is -746 mV vs SCE. The formulation consisting of 250 ppm DTPMP + 50 ppm Ni2+shifts the corrosion
potential to -765 mV vs SCE. It shows that the corrosion potential is shifted to negative side. This suggests that the cathodic reaction is controlled predominantly.
The corrosion current density value and LPR value for sea water are 6.351 x10⁻⁶ A cm-2 and 6.356 x10³ ohm cm2. For
the formulation of 250 ppm of DTPMP and 50 ppm of Ni2+,
the corrosion current density value has decreased to 5.238 x10⁻⁶ A cm-2and the LPR value has increased to 7.148 x10³
ohm cm2. The fact that the LPR value increases with
decrease in corrosion current density indicates adsorption of the inhibitor on the metal surface to block the active sites and inhibit corrosion and reduce the corrosion rate with the formation of a protective film on the metal surface.
AC impedance spectra
AC impedance spectra [electrochemical impedance spectra] have been used to confirm the formation of protective film on the metal surface.23-26 The AC impedance
spectra of carbon steel immersed in sea water in the absence and presence of inhibitors are shown in Fig.2 (Nyquist plots) and Fig.3 (Bode plots). The impedance parameters namely charge transfer resistance (Rt) double layer capacitance (Cdl),
and impedance lg(Z/ohm) are given in Table 4. If a protective film is formed on the metal surface, Rt value
increases and the Cdl value decreases.
Table 4. The AC impedance spectra of carbon steel immersed in sea water in presence of the inhibitor system
System Rt, cm2 Cdl, F cm-2 lg(Z ohm-1)
Sea water 5.426x101 9.3918x10⁻⁸ 2.010
Sea water + DTPMP
(250 ppm) + Ni2+
(50 ppm)
2.0915x10² 2.4365x10⁻⁸ 2.282
When carbon steel is immersed in sea water, Rt value is
5.426 x 101 cm2 and C
dl value is 9.3918 x 10⁻⁸ F cm-2.
When DTPMP and Ni2+are added to sea water, R t value
increases from 5.426 x 101 cm2 to 2.0915 x 102 cm2 and
the Cdl value decreases from 9.3918 x 10⁻⁸ F cm-2 to 2.4365
x 10-8 F cm-2. The impedance value increases from 2.010 to
2.282. This accounts for the high IE of DTPMP and Ni2+
system and a protective film is formed on the metal surface. DTPMP,
ppm
Ni2+ (ppm)
0 25 50
IE, % CR, mm y-1 IE, % CR, mm y-1 IE, % CR, mm y-1
0 - 0.1858 8 0.1709 15 0.1579
50 20 0.1486 43 0.1059 52 0.0892
100 28 0.1338 47 0.0985 56 0.0818
150 39 0.1133 52 0.0892 61 0.0725
200 46 0.1003 56 0.0818 66 0.0632
250 50 0.0929 60 0.0743 70 0.0557
Systems Ecorr, mV vs SCE Icorr,A cm-2 ba, mV dec-1 bc, mV dec-1 LPR, ohm cm2
Sea water -746 6.351 x10⁻⁶ 228 157 6.356 x10³
Sea water + DTPMP (250 ppm) +
Ni2+ (50 ppm) -765 5.238 x10
In electrochemical studies, instantaneous corrosion rateis measured. But in weight-loss method, corrosion rate ismeasured after a longer period, in the present study after oneday. After a longer period, the protective film becomes morecompact and stable. This accounts for the discrepancy in IE, obtained from AC impedance spectra and from weight-loss method.
Figure 2.AC impedance spectra (Nyquist plots) of carbon steel
immersed in various test solutions a) sea water b) sea water
containing 250 ppm of DTPMP and 50 ppm of Ni2+
Figure 3. AC impedance spectra (Bode plots) of carbon steel
immersed in various test solutions a) sea water b) sea water
containing 250 ppm of DTPMP and 50 ppm of Ni2+
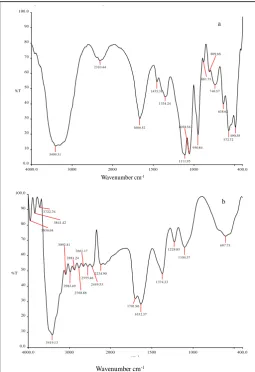
FTIR Spectra
The structure of DTPMP is shown in Scheme 1. FTIR spectra have been used to analyse the protective film found on the metal surface.27,28 The FTIR spectrum (KBr) of pure
DTPMP is shown in Fig. 4a. The P-O stretching frequency appears at 1058 cm-1 and the C-N stretching frequency
appears at 1111 cm-1. The FTIR spectrum of the film formed
on the metal surface after immersion in sea water containing 250 ppm of DTPMP and 50 ppm of Ni2+ is shown in Fig. 4b.
The P-O stretching frequency has shifted from 1058 to 1104 cm-1 and the C-N stretching frequency has shifted from 1111
cm-1 to 1228 cm-1. The shift indicates that the oxygen and
nitrogen atoms of phosphonic acid are coordinated to form Fe2+ - DTPMP complex on the anodic sites of the metal
surface. The peak at 3419 cm-1 is due to –OH stretching.
The band due to Ni-O appears at 1374 cm-1. These results
confirm the presence of Ni(OH)2 deposited on the cathodic
sites of the metal surface. Thus, FTIR spectral study leads to
the conclusion that the protective film consists of Fe2+ –
DTPMP complex and Ni(OH)2.
Scheme 1.(a) 2D Structure of DTPMP (b) 3D Structure of DTPMP
Atomic Force Microscopy
Atomic force microscopy is a powerful technique for the gathering of roughness statistics from a variety of surfaces.29
AFM is becoming an accepted method for roughness investigation.30 All atomic force microscopy images were
obtained on PicoSPM Molecular Imaging, USA make, AFM instrument operating in contact mode in air. The scan size of all the AFM images are 30µm x 30 µm areas at a scan rate of 2.4 lines per second. The two dimensional, three dimensional AFM morphologies and the AFM cross sectional profile for polished carbon steel surface (reference FTIR SPECTRUM ACIC
St.Joseph's College ( Autonomous ) Trichy-2
Spectrum Name: GTN-DTPMP.sp
Date: 11-5-2011
GTN-DTPMP.pk
GTN-DT~1.SP 3601 4000.00 400.00 6.33 100.00 4.00 % T 5 1.00
REF 4000 79.15 2000 78.86 600
3409.31 12.21 2310.44 68.42 1666.52 30.41 1455.31 54.50 1354.24 44.76 1111.95 6.33 1058.56 7.01 950.84 19.67 881.75 67.52 809.66 61.00 740.57 52.62 638.62 39.86 572.72 22.32 490.38 24.53
4000.0 3000 2000 1500 1000 400.0 0.0 10 20 30 40 50 60 70 80 90 100.0 cm-1 %T 3409.31 2310.44 1666.52 1455.31 1354.24 1111.95 1058.56 950.84 881.75 809.66 740.57 638.62 572.72 490.38
Wavenumber cm-1
a
FTIR SPECTRUM ACIC
St.Joseph's College ( Autonomous ) Trichy-2
Spectrum Name: GTN-Ni.sp
Date: 11-5-2011
GTN-Ni.pk
GTN-Ni.sp 3601 4000.00 400.00 8.29 98.59 4.00 %T 5 1.00
REF 4000 98.48 2000 58.79 600
3956.04 82.67 3841.42 87.65 3722.76 91.48 3419.13 8.29 3092.41 47.70 2983.49 49.21 2881.24 50.64 2768.88 52.08 2661.17 52.98 2555.46 53.00 2449.53 52.73 2234.90 54.18 1701.96 31.99 1632.37 28.42 1374.33 48.27 1228.85 69.00 1104.37 65.56 607.75 72.84
4000.0 3000 2000 1500 1000 400.0 0.0 10 20 30 40 50 60 70 80 90 100.0 cm-1 %T 3956.04 3841.42 3722.76 3419.13 3092.41 2983.49 2881.24 2768.88 2661.17 2555.46 2449.53 2234.90 1701.96 1632.37 1374.33 1228.85 1104.37 607.75 b
Wavenumber cm-1
Figure 4. FTIR Spectra a) pure DTPMP b) film formed on metal surface after immersion in sea water containing 250 ppm of
sample), carbon steel surface immersed in sea water (blank sample), and carbon steel surface immersed in sea water containing 250 ppm DTPMP and 50 ppm Ni2+ are shown in
Fig.5 (a,d,g), (b,e,h), (c,f,i) respectively.
Root Mean Square Roughness, Average Roughness and Peak-to-Valley Value: AFM image analysis was performed to obtain the average roughness, Ra (the average deviation of
all points roughness profile from a mean line over the evaluation length), root – mean – square roughness, Rq (the
average of the measured height deviations taken within the evaluation length and measured from the mean line), and the maximum peak-to-valley (P-V) height values (largest single peak-to-valley height in five adjoining sampling heights).30
Rq is much more sensitive than Ra to large and small height
deviations from the mean.31
Table 5. AFM data for carbon steel immersed in inhibited and uninhibited environments.
Samples Rq, nm Ra, nm P-V, nm
Polished carbon steel, control 4.33 3.41 35.28
Carbon steel immersed in sea water (blank)
17.67 13.51 71.08
Carbon steel immersed in sea water containing 250 ppm
DTPMP and 50 ppm Ni2+
11.22 8.76 42.00
Table 5 is a summary of the average roughness (Ra), rms
roughness (Rq), maximum peak to valley height (P-V) value
for carbon steel surface immersed in different environments. The value of Rq, Ra, and P-V height for the polished carbon
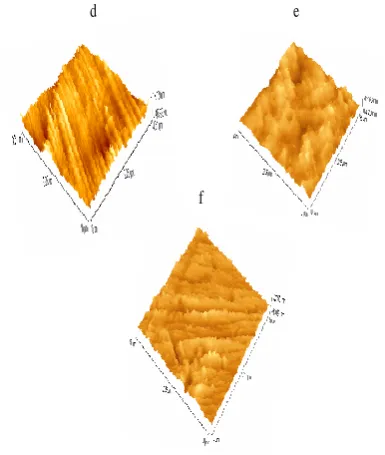
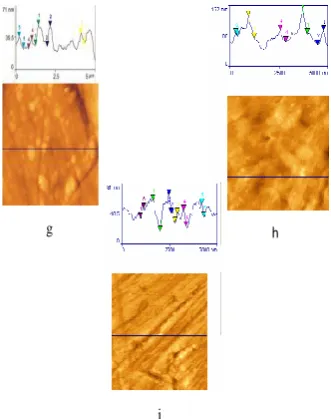
steel surface (reference sample) are 4.33 nm, 3.41 nm, and 35.28 nm respectively. This shows that the surface is more homogenous, with some places where the height is lower than the average depth. Fig. 5 (a,d,g) displays the non-corroded metal surface. The slight roughness observed on the polished carbon steel surface is due to atmospheric corrosion. Fig. 5 (b,e,h) displays corroded metal surface with few pits. The rms roughness, average roughness, and P-V height values for the carbon steel surface immersed in sea water are 17.67 nm, 13.51 nm, and 71.08 nm respectively. These values suggest that carbon steel surface immersed in sea water has a greater surface roughness than the polished metal surface, indicating that the unprotected carbon steel surface is rougher and were due to the corrosion of carbon steel in sea water environment. Fig. 5 (c,f,i) shows the carbon steel surface after immersion in sea water containing 250 ppm of DTPMP + 50 ppm Ni2+.The R
q, Ra, and P-V
height values for carbon steel surface are 11.22 nm, 8.76 nm, and 42 nm respectively. These values are considerably less in the inhibited environment compared to the uninhibited environment. These parameters confirm that the surface appears smoother. The smoothness of the surface is due to the formation of a compact protective film of Fe2+ –DTPMP
complex and Ni(OH)2 on the metal surface, thereby
inhibiting the corrosion of carbon steel. The above parameters are also somewhat greater than the AFM data of polished metal surface, which confirms the formation of film on the metal surface, which is protective in nature.
a b
c
Figure. 5. Two dimensional AFM images of the surface of,
a) Polished carbon steel (control);
b) Carbon steel immersed in sea water (blank);
c) Carbon steel immersed in sea water containing DTPMP
(250 ppm) + Ni2+ (50 ppm).
c
d e
f
Figure 5. Three dimensional AFM images of the surface of,
d) Polished carbon steel (control);
e) Steel immersed in sea water (blank);
f) Carbon steel immersed in sea water containing DTPMP
i
g h
Figure 5. AFM cross-sectional images of the surface of,
(g) Polished carbon steel (control);
(h) Carbon steel immersed in sea water (blank);
(i) Carbon steel immersed in sea water containing DTPMP
(250 ppm) + Ni2+ (50 ppm).
Mechanism of corrosion inhibition
In order to explain the above results, the following mechanism of corrosion inhibition is proposed: When carbon steel is immersed in an aqueous solution, the anodic reaction is,
Fe → Fe2+ + 2e- (3)
The corresponding cathodic reaction is reduction of oxygen to hydroxyl ions,
O2 + 2H2O + 4e- → 4OH- (4)
When the formulation consists of 250 ppm of DTPMP and 50 ppm Ni2+ in sea water, there is formation of DTPMP–
Ni2+ complex in solution.
When carbon steel is immersed in this environment, the DTPMP–Ni2+ complex diffuses from the bulk of the solution
to the metal surface. The DTPMP–Ni2+ complex is
converted into DTPMP–Fe2+ complex on the anodic sites of
the metal surface, the stability of Fe2+–DTPMP complex is
higher than the corresponding Ni complex.
Ni2+–DTPMP+Fe2+→Fe2+–DTPMP+Ni2+ (5)
The released Ni2+ combines with OH- to form Ni(OH) 2 on
the cathodic sites of the metal surface.
Ni2+ + 2OH- → Ni(OH)
2 (6)
The protective nature of the film is due to the presence of metal inhibitor complex and nickel hydroxide. Formation of the metal inhibitor complex fills the pores of the otherwise porous film and makes it a protective film.
Thus, the protective film consists of Fe2+ – DTPMP
complex and Ni(OH)2.
CONCLUSIONS
The conclusions drawn from the results may be given as:The formulation consists of 250 ppm of DTPMP and 50 ppm of Ni2+ has 70 % IE. Polarization study suggests that
the cathodic reaction is controlled predominantly. AC impedance spectra reveal that a protective film is formed on the metal surface. FTIR spectra show that the protective film consists of Fe2+–DTPMP complex and Ni(OH)
2. AFM
images confirm the formation of protective layer on the metal surface.
REFERENCES
1Satyanarayana, M. G. V., Kalpana, Y., Himabindu, V., Kumar, K.,
Corros. Eng. Sci. Technol., 2012, 47, 38.
2Al-Baker, N., Shawabkeh, R., Rihan, R., Corros. Eng. Sci.
Technol., 2011, 46, 767.
3Durodola, B. M., Olugbuyiro, J. A. O., Moshood, S. A., Fayomi,
O. S., Popoola, A. P. I., Int. J. Electrochem. Sci., 2011, 6, 5605.
4Zou, Y., Wang, J., Zheng, Y. Y., Corros. Sci., 2011, 53, 208.
5Khaled, K. F., Hackerman, N., Electrochim. Acta., 2003, 48, 2715.
6Ali, S. A., Saeed, M. T., Rahman, S. V., Corros. Sci., 2003, 45,
253.
7Amar, H., Benzakour, J., Derja, A., Villemin, D., Moreau, B., J.
Electroanal. Chem., 2003, 558, 131.
8Amar, H., Benzakour, J., Derja, A., Villemin, D., Moreau, B.,
Braisaz, T., Tounsi, A., Corros. Sci., 2008, 50, 124.
9Gopi, D., Manimozhi, S., Govindaraju, K. M., J. Appl.
Electrochem., 2007, 37,439.
10Kavipriya, K., Rajendran, S., Sathiyabama, J., Suriya Prabha, A.,
Eur. Chem. Bull., 2012, 1, 366.
11Ochoa, N., Basil, G., Moran, F., Pebere, N., J. Appl. Electrochem.,
2002, 32, 497.
12Gunasekaran, G., Natarajan, R., Muralidharan, V. S.,
Palaniswamy, N., Appa Rao, B. V., Anti-Corros. Methods
Mater., 1997, 44, 248.
13Touir, R., Dkhireche, N., Ebn Touhami, M., Sfaira, M., Senhaji,
O., Robin, J. J., Boutevin, B., Chekaoui, M., Mater. Chem.
Phys., 2010, 122, 1.
14Fang, J. L., Li, Y., Ye, X. R., Wang, Z. W., Liu, Q., Corrosion,
1993, 49, 266.
15Ramesh, S., Rajeswari, S., Electrochim. Acta., 2004, 49, 811.
16Wranglen,G., Introduction to corrosion and protection of Metals
London: Chapman & Hall., 1985, 236.
17Umamathi., Arockia Selvi, J., Agnesia Kanimozhi, S., Rajendran,
S., John Amalraj, A., Indian J. Chem. Technol., 2008, 15, 560.
18Mary Anbarasi, C., Rajendran, S., J. Electrochem. Sci. Eng.,
2012, 2,1.
19Roque, J. M., Pandiyan, T., Cruz, J., Garcia-Ochoa, E., Corros.
Sci., 2008, 50, 616.
20Arockia Selvi, J., Rajendran, S., Ganga Sri, V., John Amalraj, A.,
21Nagalakshmi, R., Rajendran, S., Sathiyabama, J., Pandiarajan, M.,
Lydia Christy, J.,Eur. Chem. Bull., 2013, 2, 150.
22Agiladevi, S., Rajendran, S., Jeyasundari, J., Pandiarajan, M.,Eur.
Chem. Bull., 2013, 2, 84.
23Sathiyabama, J., Rajendran, S., Arockia Selvi, J., Jeyasundari, J.,
Open Corros. J., 2009, 2, 76.
24Shyamala Devi, B., Rajendran, S., Eur. Chem. Bull., 2012, 1, 150.
25Rajendran, S., Paulraj, J., Rengan, P., Jeyasundari, J.,
Manivannan, M., J. Dent. Oral. Hyg.,2009, 1, 1.
26Rajendran, S., Anuradha, K., Kavipriya, K., Krishnaveni, A.,
Angelin Thangakani, J.,Eur. Chem. Bull., 2012, 1, 503.
27Lalitha, A., Ramesh, S., Rajeswari, S., Electrochim. Acta., 2005,
51, 47.
28Rajendran, S., Apparao, B.V., Palaniswamy, N., Periasamy, V.,
Karthikeyan, G., Corros. Sci., 2001, 43 , 1345.
29Singh, A. K., Shukla, S. K., Singh, M., Quraishi, M. A., Mater.
Chem. Phys., 2011, 129, 68.
30Zhang, F., Pan, J., Claesson, P. M., Electrochim. Acta.,2011, 56,
1636.
31Arockia Selvi, J., Rajendran, S., Jeyasundari, J., Zastit. Mater.,
2009, 50, 91.