Volume 10 (2008)
Proceedings of the
Seventh International Workshop on
Graph Transformation and Visual Modeling Techniques
(GT-VMT 2008)
Improving Live Sequence Chart to Automata Transformation for
Verification
Rahul Kumar and Eric G Mercer
14 pages
Guest Editors: Claudia Ermel, Reiko Heckel, Juan de Lara
Managing Editors: Tiziana Margaria, Julia Padberg, Gabriele Taentzer
Improving Live Sequence Chart to Automata Transformation for
Verification
Rahul Kumar1and Eric G Mercer2
1[email protected],2[email protected]
Computer Science Department Brigham Young University
Provo, UT, USA
Abstract: This paper presents a Live Sequence Chart (LSC) to automata
trans-formation algorithm that enables the verification of communication protocol imple-mentations. Using this LSC to automata transformation a communication protocol implementation can be verified using a single verification run as opposed to pre-vious techniques that rely on a three stage verification approach. The novelty and simplicity of the transformation algorithm lies in its placement of accept states in the automata generated from the LSC. We present in detail an example of the trans-formation as well as the transtrans-formation algorithm. Further, we present a detailed analysis and an empirical study comparing the verification strategy to earlier work to show the benefits of the improved transformation algorithm.
Keywords:live sequence chart, transformation, automata, verification
1
Introduction
Current trends in system development are shifting towards creating and developing larger sys-tems using several smaller communicating sub-syssys-tems. With the increasing popularity of such modular designs comes the burden of creating, implementing, and testing the implemented com-munication protocols. Specification of comcom-munication protocols has been explored significantly in the past. English, which has been traditionally used as the most common language for spec-ifying protocols, lacks the formal rigor and preciseness needed for clarity. Viable alternatives are formal specification languages such as UML, Message Sequence Charts (MSCs) and Live
Sequence Charts (LSCs) [IT93,DH99,BDK+04]. The evolution of these graphical languages
has led to their application to modeling and specifying communication behaviors in a variety of different domains [BHK03,KHG05,DK01]. Other research has also investigated the automatic synthesis of systems from LSCs as well as the verification and validation of requirements on
the LSCs themselves [HK01,AY99,SD05]. Efficient methodologies for using these graphical
Previous work in [KTWW06,Klo03] presents a strategy to verify systems against LSC specifi-cations by transforming the LSC to apositiveautomaton. We use the term positive automaton to denote automaton that witness chart completions. With the positive automaton, a system is veri-fied against the LSC in three stages: reachability analysis for detecting safety violations, ACTL verification for detecting liveness errors, and finally, if the first two steps fail to provide a signif-icant result, full LTL verification is required to completely verify the system. The authors argue that the verification algorithms are applied in increasing order of cost and for certain sub-classes of LSCs not all algorithms need to be applied, which can eventually save on the total verifica-tion cost. Although the approach presented in [KTWW06] is sound, it has several drawbacks. For any arbitrary LSC, the approach at a minimum has to apply reachability analysis as well as ACTL model checking for verifying the safety and liveness properties of the system against the LSC. In the worst case, LTL verification is required to completely verify the system, which was shown to be impractical for LSC verification [KM07]. Another drawback of the verification ap-proach is the specialized algorithms and tools that have to be created to perform the verification, which limit the general applicability and acceptance of the approach. The approach presented in this paper only requires one verification algorithm of the same cost as reachability analysis to completely verify a system against any arbitrary LSC.
We present a direct and obvious transformation of the LSC to anegativeautomaton by chang-ing the placement of accept states. We use the term negative automaton to denote automaton that witness chart violations as opposed to chart completions. Using this improved LSC to automa-ton transformation a system can be formally verified against the LSC specification by performing only language containment on the parallel composition of the system automaton and the nega-tive automaton of the LSC. Additionally, this approach does not require the use of customized algorithms and tools to verify a system against a specification. Using our new LSC to automaton transformation, we verify systems against larger more concurrent LSCs that were previously not verifiable with direct LSC to LTL or LSC to positive automaton transformations.
The structure of the paper is as follows. Section2presents a brief introduction to LSCs and an overview of the basic LSC to automaton transformation algorithm as described in [Klo03]. Section3discusses in detail an example of using our approach for verifying a system against an LSC. This example will be used for the remainder of the paper as well. Section4discusses the details of the transformation algorithm and presents the theoretical results to prove the correct-ness of the transformation algorithm. Section5 presents an analysis of the improved transfor-mation compared to the old transfortransfor-mation presented in [Klo03]. Section6presents a subset of the results using the improved verification approach in both symbolic and explicit state model checkers. Finally, Section7discusses the conclusions and future work. Proofs, details and
addi-tional results can be found in the long version of the paper athttp://vv.cs.byu.edu/∼
rahul/lsc2automata.pdf.
2
LSC Overview
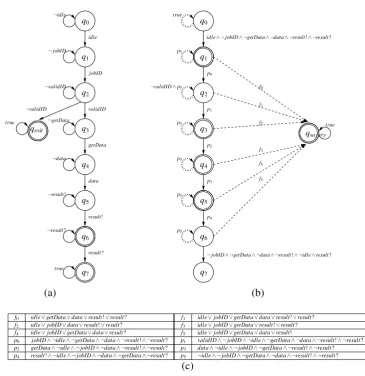
We briefly introduce some constructs of the LSC grammar1. Fig. 1(a) shows an example LSC
where an idle node in a compute cluster requests and processes a job from the scheduler’s queue
with a possible implementation of theNodeandDBprocess in Fig.1(b). There are three pro-cessesin the example LSC:Scheduler,NodeandDB. Each process is drawn with a rectangular instance head and a vertical life-line originating from each instance head. The life-line represents the time dimension in the LSC with time progressing in the downward direction. Communication between processes occurs viamessageswith the arrows representing the direction of communi-cation. Theidlemessage is an example of asynchronousmessage (filled arrowhead) where both the sender and receiver have to be ready for the message to be observed. The actual message communication occurs instantaneously for the sender and receiver. Theresult message is an ex-ample of anasynchronousmessage (unfilled arrowhead) where the sender does not have to block for the receiver to be ready to receive the message. The send event is written asresult! and the receive event is written asresult?. The example LSC also contains acold non-bonded condition
(second dashed hexagon) which enforces thevalidIDpredicate after a jobIDhas been received from the Scheduler. If the condition is violated, the Node process exits the chart. On each life-line any point where a condition or an event occurs is referred to as alocation. Locations are unique to each life-line and in our research are represented by numbers next to the instance life-line. By default all locations arehotormandatorylocations unless specified otherwise using a dashed line for the life-line. The location for receiving theresult message in theScheduler
life-line is the only cold location in the example chart. The behavior specified on a cold loca-tion is not mandatory, which implies that theresult message may or may not be received by the
Scheduler. Finally, behaviors described by the LSC are partitioned into thepre-chart (dashed hexagon before solid rectangle) and the main chart(rectangle after pre-chart). The pre-chart specifies the activation condition of the LSC and the main chart describes the behavior which must follow the pre-chart. In the example LSC, the main chart is auniversalmain chart (solid line), which represents behaviors that have to be observed every time the pre-chart is satisfied.
In addition to the constructs shown in the example LSC, several other constructs are also available. The main chart can be specified as anexistentialchart (drawn with a dashed rectangle) that specifies behavior the system must satisfy at least once when the pre-chart is satisfied (as opposed to every time the pre-chart is satisfied). Conditions if attached to another event are
bondedotherwisenon-bonded. By attaching conditions to other events, the condition is evaluated at the exact moment the bonded event occurs, as opposed to non-bonded conditions where the condition is continuously evaluated until satisfied. LSCs also allow the specification ofinvariants
which are conditions spanning over multiple events in the LSC. Co-regions specified with a dashed line parallel to a life-line allow events to occur in any order. For example, if the messages
getDataanddataare specified in a co-region, either messagedataorgetDatamay occur first. It is only necessary for all events in a co-region to occur. Finally, conditions, messages, and locations may be specified as hotorcold. If drawn with a solid line, the construct is hot and specifies mandatory behavior, and if drawn with a dashed line, the construct specifies cold or provisional behavior.
DB idle data Scheduler Node jobID getData result validID 0 2 2 1 0 1 3 4 0 1 ⊥ ⊥ ⊥ ProcessNode: 1: if(idle) then
2: Send(‘‘idle’’, Scheduler) 3: Receive(‘‘jobID’’, Scheduler) 4: if(not ‘‘validID’’)
5: break
6: Send(‘‘getData’’, DB) 7: Receive(‘‘data’’, DB) 8: Send(‘‘result’’, Scheduler) 9: endif
10:End ProcessNode 11:ProcessDB: 12: while(true){
13: Receive(msg, Node) 14: if(msg is ‘‘data’’) 15: Receive(‘‘data’’, Node) 16: endif
17: RemoveData(data) 18: endif
19: end while 20:End ProcessDB
(a) (b)
Figure 1: An example specification describing the interaction between a cluster node (Node), a database (DB) and a job scheduler (Scheduler), and a possible implementation of theNodeand
DBprocesses (a) The example LSC containing a subset of the complete LSC grammar (b) A
system implementing theNodeandDBprocesses described in the LSC.
restrictions do not affect the general applicability of our results.
2.1 Transforming Live Sequence Charts to Automata
Past research in the area of transforming LSCs to automaton has primarily revolved around the
generation of positive automaton that detect chart completions [Klo03,HK01,BH02,KW01].
Work in [Klo03] gives a detailed presentation of the algorithm to transform an LSC to positive automaton. We present an overview of this algorithm followed by a discussion of some key aspects of the algorithm.
The LSC to automaton unwinding algorithm explores all possible inter-leavings of the events defined in the LSC starting from the top and ending at the bottom of each life-line in the chart. The possible event inter-leavings are explored by considering the partial order induced by the semantics of the LSC. The partial order of the chart dictates that the locations in each instance are totally ordered unless part of a co-region; thus, implying that each instance has to progress linearly from top to bottom. For example, in the chart shown in Fig.1(a), instanceNodecannot
move from location 1 to location 4. From location 1, Node has to move to the next logical
all charts is created by placing each instance at its first location,(0,0,0), where the first, second and third locations correspond to the locations for theScheduler,NodeandDBinstances.
The enabled set of transitions for a cut is created using the chart semantics. For example, a synchronous message is enabled if both the sender and receiver of the message are at their respective send and receive locations. In our chart, the messageidleis observed if theScheduler
and Node instances are each at locations 0. At the initial cut, (0,0,0), the idle message is enabled. On the other hand, since theNode is not at location 3, the getData message is not enabled in the initial cut, even though theDBis at location 0. When theidlemessage is explored from the enabled set, a successor cut is generated where the locations for the involved instances have been updated. In this case, the locations for theNodeandSchedulerinstances are updated to their next logical location giving us the successor cut(1,1,0). At the cut(1,1,0), the jobID
message is enabled, which leads to the cut(2,2,0). Asynchronous sends are enabled by default when the corresponding instance is at the send location and asynchronous receives are enabled only if the corresponding send event has occurred and the receiving instance is at the receive location. Conditions act as a synchronization point where each participating instance should be at its respective condition location for the condition to be evaluated. A full description of these semantics can be found in [Klo03]. Multiple enabled transitions lead to multiple successor cuts from the given cut representing the concurrency in the chart.
Using the chart semantics, successor cuts are generated from the initial cut and each unique cut is processed until the final cut is reached where each instance is at the bottom of its life-line. Each unique cut of the chart corresponds to a state in the final automaton. The initial cut(0,0,0)
corresponds to stateq0in Fig.2(a). The successor cut(1,1,0)corresponds to the stateq1where
theidlemessage has already been observed and the next message to be observed is jobID. Cut
(2,2,0)corresponds to stateq2and the final cut corresponds to stateq7where no further events
are to be observed. Notice that transitions taken to generate successor cuts correspond to the transition labels in the automaton.
Finally, to create the positive automaton from the LSC, states corresponding to legal exits of the chart are marked as accept states. For example, stateq7 in Fig.2(a) is marked as an accept
state because it corresponds to the final cut of the LSC which represents a legal completion of the chart. Additionally, stateq6is also marked as an accept state since it corresponds to the cut where the cold messageresult does not have to be received.
From the automaton in Fig.2(a) we also notice that stateq2, where cold condition validID
occurs is non-deterministic. This non-determinism is a result of the adopted semantics of cold conditions in [Klo03]. IfvalidIDis not satisfied, the automaton can either stay in stateq2 and
3
Transformation and Verification Example
We use the automaton produced by the unwinding algorithm discussed earlier as our initial
automaton. The initial automaton from the unwinding algorithm is shown in Fig. 2(a). We
transform this positive automaton to a negative automaton that can be used in our single pass verification approach. Fig.2(b) and (c) show the transformed negative automaton.
Our approach transforms the LSC chart to a negative automaton capable of detecting chart violations (as opposed to chart completions) that is naturally suited for verifying systems using language containment. The first step in the transformation process is to remove all the accept labels from the automaton. Next the exit stateqexit and any transitions leading to the exit state are removed from the initial automaton. In our example of Fig.2(a) we remove the transition from stateq2to stateqexit, which also removes the non-determinism from the automaton arising
from the non-bonded condition. The algorithm then introduces safety transitions (dashed edges in Fig. 2(b)) from all states that contain a transition belonging to the main chart to the safety stateqsa f ety. The safety state is an accept state introduced in the automaton to capture all safety violations in the system. It has a single outgoing transition to itself predicated ontrue. The safety transitions enable the detection of safety violations which consist of duplicate messages (messages that have been observed before) and out of order messages in states that correspond to main chart states. For example, in stateq1of Fig.2(b), the only legal transition is if the jobID
message is observed. Since jobIDis a main chart transition, stateq1corresponds to a main chart state and a safety transition is introduced. The safety transitionidle∨getData∨data∨result!∨ result? from stateq1toqsa f etyis taken if any message except jobIDis observed.
After the introduction of safety transitions, the algorithm updates the self-loops on each state (dotted edges in Fig.2(b)). The self-loops enable the automaton to remain in a given state until an event forcing progress is observed. For example, in the automaton shown in Fig.2(b), stateq4
has a self-loop,¬idle∧ ¬jobID∧ ¬getData∧ ¬data∧ ¬result!∧ ¬result?, that is taken until the
datamessage is observed, which moves the automaton to the next stateq5. The only exception is the self-loop for the first state and the final state. The first stateq0 contains a self-loop with
thetrueannotation to capture all possible future instances (and possible errors) of the chart in a reactive system. The final state does not have any self-loops. This is because the final state represents the successful completion of the chart and no further errors are possible unless a new chart instance is observed, which is detected in the first state.
Finally, the algorithm marks illegal end points of the main chart as accept states to facilitate detection of chart violations. For example, stateq1in Fig.2(b) is at the beginning of the main
chart where the message jobID is yet to be received. If the jobID message is never observed, the automaton remains in stateq1indefinitely, which should be reported as an error. To report this error, stateq1 is marked as an accept state. States containing no transitions corresponding
to hot constructs in the main chart are not marked as accept states. For example, in Fig.2(b), stateq2is not marked as an accept state because thevalidIDcondition is a cold condition, and its absence does not result in an error. Stateq0is not marked as an accept state either because it
does not contain any outgoing transitions corresponding to a hot construct in the main chart. If theidlemessage is never observed, the pre-chart is not satisfied, which is not a violation of the specification. Stateq6is not marked as an accept state since the location of theresult? event is
¬validID idle jobID validID ¬getData getData data result! result? q0 q1 q2 q3 q4 q5 q6 q7 true qexit ¬result? ¬result! ¬data ¬validID ¬jobID ¬idle true q1 q2 q3 q4 q5 q6 q7 q0 true
¬jobID∧ ¬getData∧ ¬data∧ ¬result!∧ ¬idle∧result? f0
idle∧ ¬jobID∧ ¬getData∧ ¬data∧ ¬result!∧ ¬result?
p0 p1 p3 p4 p2 true
¬validID∧p5 p5 p5 p5 p5 p5 f1 f2 f3 f4 f5
qsa f ety
(a) (b)
f0 idle∨getData∨data∨result!∨result? f1 idle∨jobID∨getData∨data∨result!∨result? f2 idle∨jobID∨data∨result!∨result? f3 idle∨jobID∨getData∨result!∨result? f4 idle∨jobID∨getData∨data∨result? f5 idle∨jobID∨getData∨data∨result!
p0 jobID∧ ¬idle∧ ¬getData∧ ¬data∧ ¬result!∧ ¬result? p1 validID∧ ¬jobID∧ ¬idle∧ ¬getData∧ ¬data∧ ¬result!∧ ¬result? p2 getData∧ ¬idle∧ ¬jobID∧ ¬data∧ ¬result!∧ ¬result? p3 data∧ ¬idle∧ ¬jobID∧ ¬getData∧ ¬result!∧ ¬result? p4 result!∧ ¬idle∧ ¬jobID∧ ¬data∧ ¬getData∧ ¬result? p5 ¬idle∧ ¬jobID∧ ¬getData∧ ¬data∧ ¬result!∧ ¬result?
(c)
Figure 2: The initial and transformed automaton for the example LSC shown in Fig.1(a). (a) the initial automaton (b) the transformed automaton and (c) list of transition labels.
is also not marked as an accept state since it is the final state where the behavior as described in the universal chart has been satisfied without errors.
Verification of the system is performed by first creating the system automaton in the usual manner. We verify the parallel composition of the system automaton and the negative automaton of the LSC by searching the behavior space of the intersection for accepting cycles. Any cycles detected correspond to errors in the system. Fig.1(b) shows a possible implementation of the
NodeandDBprocesses in a cluster. TheSchedulerprocess has not been shown in the implemen-tation but is assumed to be correctly implemented. When idle, theNodeprocess requests a job from the scheduler (line 2). TheNodeprocess then waits to receive the jobIDand validates the
jobIDusing the predicatevalidID(lines 3 - 5). Next, theNodeprocess requests data from the
theDBprocess is erroneous because it never receives/processes the getDatamessage from the
Node. Since thegetDatamessage is a synchronous message and theDBprocess is never ready
to receive thegetData message, theNode andDBprocesses never progress even though they
should. Verification of the parallel composition of the system automaton (not shown) with the property automaton in Fig.2(b) produces the word(idle,jobID,validID,(¬getData)ω), with
the corresponding trace: (q0,q1,q2,(q3)ω), where ω indicates infinite repetition. Since q3 is
marked as an accept state, the trace is reported as an accepting cycle and the violation has been discovered. Using the positive automaton in the verification approach of [KTWW06] requires two verification runs of comparable complexity to detect the same violation.
4
Transformation and Verification Details
The transformation presented in this work is based on language containment and automata the-ory. We useSymbolic automata, an extension of B¨uchi automata, that allows observing any of a possible set of inputs on an edge. Formally Symbolic automata are given byA=hΣ,Q,∆,q0,Fi
where,Σis the finitealphabet of input symbols (variables),Qis the finite set of states,q0∈Q
is the initial state,F⊆Qis the set of final/accepting states, and∆⊆Q×φ×Qis the transition relation. A transition(q,φ,q0)∈∆represents the change from stateqto stateq0when the formula
φis satisfied.
We partition the set of Boolean variables Σ into three distinct setsΣmsgs, Σinvariants, and Σconditions, that contain the Boolean variables that are used for messages, invariants and
condi-tions in the chart respectively. For the chart shown in Fig.1(a),Σmsgs={idle, jobID,getData,
data,result?,result!}andΣconditions={validID}. The setΣmain={jobID,validID,data,
getData,result?,result!}is the set of Boolean variables that are used in the main chart only. We also have a set∆hot⊆∆which only contains transitions that correspond to hot constructs in the
chart (hot messages, hot conditions etc.).
For a set of Boolean functionsΓ={φ0,φ1, ...,φn}we define the functiondis junct(Γ)which
returns the disjunct of the individual formulas inΓand the functioncon junct(Γ)which returns
the conjunction of the individual formulas inΓ. The function f(Σ,φ) ={σ|σ ∈ Σandσ or
¬σ appears in φ} returns the set of Boolean variables from Σ that appear in φ in either a positive or negative form. For example, if φ =idle∧validID, f(Σmsgs,φ) = {idle} and
f(Σcondition,φ) ={validID}.
We take as input the automaton structure for a chart in the form of a symbolic automata structure,A, with an empty final state set. Intuitively, to capture the bad behaviors of a chart, we transform the basic automaton structure to the negative automaton that is capable of detecting safety and liveness errors by yielding accepting cycles in the verification. We do so by adding accept states to the automaton and adding/updating all transitions.
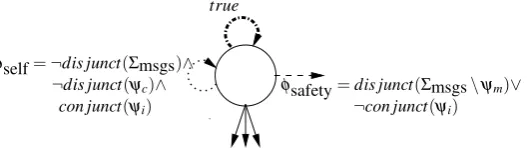
Fig.3shows an intuitive description of the outgoing transitions of a state in the transformed automaton. The setsψc,ψmandψi(initialized by the algorithm in Fig.4) are sets of condition,
φsafety=dis junct(Σmsgs\ψm)∨
¬con junct(ψi)
φchild=φ∧ ¬dis junct(Σmsgs\f(Σmsgs,φ))
φself=¬dis junct(Σmsgs)∧
true
¬dis junct(ψc)∧
con junct(ψi)
Figure 3: A generic state in the transformed automaton with complete annotations for all types of outgoing transitions 1. φself: self-loop for non-progress, 2. φsafety: transition to stateqsa f ety
for detecting safety errors, and 3.φchild transitions to the successor states.
event or condition progresses the automaton to a successor state. Theφchild transitions (solid edges) lead to the successor states. The dash-dot edge is only added to the first state of the automaton to enable verification of multiple chart instances in a reactive system.
States are marked as accept states in the automaton based on two criteria. First, the safety state is marked as an accept state for detecting safety violations such as duplicate message instances and out of order messages. Second, any state that is not a legal exit point of the chart is marked as an accept state. We now discuss in detail the creation of the transitions and the marking of accept states.
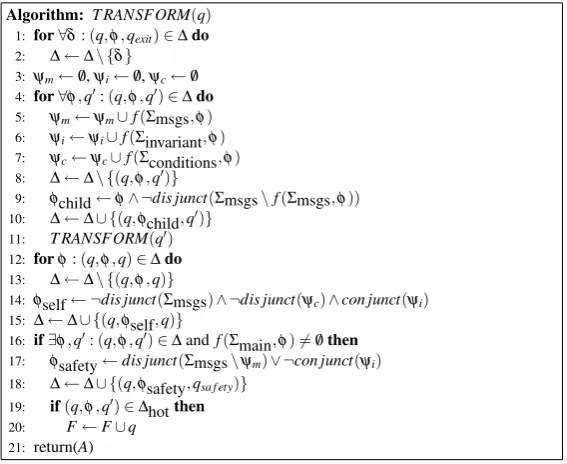
Fig.4shows the algorithm for transforming the input automaton. We only present an overview of the algorithm in this version of the paper and refer the reader to the long version for more details. The algorithm has a general Depth First Search (DFS) structure with line 4 enumerating the successors and line 11 making a recursive call for each successor. The algorithm is always invoked for the one initial state of the input automaton to be transformed. Lines 1 - 2 remove any transitions to the exit stateqexit. In the automaton shown in Fig.2(a), the transition from state q2 to the exit stateqexit is removed. Lines 5 - 7 of the algorithm build the sets of variables that
are used for messages, invariants, and conditions in the transitions from the current state to the successor states.
Lines 8 - 10 update the transitions to the successor states by first removing the transition and adding a new transition with the updated label. The updated child transition ensures that only the enabled messages, invariants and conditions at a given state can enforce progress in the automa-ton. For example, the algorithm transforms the transition from stateq1 to stateq2 in Fig.2(a) fromφ= jobIDtoφchild=jobID∧ ¬idle∧ ¬getData∧ ¬data∧ ¬result!∧ ¬result?.
Lines 12 - 15 update the self-loop for the current state to ensure that the automaton remains in the current state if no relevant messages are observed. For example, in stateq1of Fig.2(b), the self-loop¬idle∧ ¬jobID∧ ¬getData∧¬data∧ ¬result?∧ ¬result! is enabled if no message is observed. As mentioned earlier, the first state of the automaton has a self-loop with thetruelabel and the final state of the automaton has no self-loops. These special cases are not shown in the transformation algorithm in Fig.4.
Algorithm: T RANSFORM(q) 1: for∀δ:(q,φ,qexit)∈∆do 2: ∆←∆\ {δ}
3: ψm←/0,ψi←/0,ψc←/0 4: for∀φ,q0:(q,φ,q0)∈∆do 5: ψm←ψm∪f(Σmsgs,φ) 6: ψi←ψi∪f(Σinvariant,φ) 7: ψc←ψc∪f(Σconditions,φ) 8: ∆←∆\ {(q,φ,q0)}
9: φchild←φ∧ ¬dis junct(Σmsgs\f(Σmsgs,φ)) 10: ∆←∆∪ {(q,φchild,q0)}
11: T RANSFORM(q0) 12: forφ:(q,φ,q)∈∆do 13: ∆←∆\ {(q,φ,q)}
14: φself← ¬dis junct(Σmsgs)∧ ¬dis junct(ψc)∧con junct(ψi) 15: ∆←∆∪ {(q,φself,q)}
16: if∃φ,q0:(q,φ,q0)∈∆andf(Σmain,φ)6=/0then 17: φsafety←dis junct(Σmsgs\ψm)∨ ¬con junct(ψi) 18: ∆←∆∪ {(q,φsafety,qsa f ety)}
19: if(q,φ,q0)∈∆hotthen
20: F←F∪q
21: return(A)
Figure 4: Algorithm for building a negated automaton from an input LSC automaton.
are members of the main chart alphabetΣmain), then lines 16 - 18 of the algorithm add a safety
transition to the safety stateqsa f ety. The safety transition enables the automaton to detect message order violations or duplicate messages. For the automaton shown in Fig.2(a), stateq1contains
a single transition for the jobIDmessage. Since jobIDis a member of the main chart alphabet (jobID∈Σmain) a safety transition needs to be added. The safety transition for stateq1,idle∨
getData∨data∨result?∨result!, detects the presence of any message except the one allowed message jobID. Because states with no main chart transitions can not violate the chart, no safety transitions are added to them.
Lines 19 - 20 of the algorithm label the current state as an accept state if it belongs to the main chart and contains a hot outgoing transition. The check for main chart transitions is performed on line 16. To check for hot outgoing transitions, each outgoing transition is checked for mem-bership in the∆hot set (line 19). If all outgoing transitions from a state are cold, the state is not
marked as an accept state. In our example, for stateq2, the only outgoing transition corresponds
to a cold condition and is not part of the∆hot set; thus, stateq2is not marked as an accept state.
On the other hand stateq1 is marked as an accept state because it has one successor transition
that corresponds to the hot message jobID.
Lemma 1 For all states containing outgoing main chart transitions, the transition relation is total. Formally, given a state q with a main chart transition
W
∀φi,qi:(q,φi,qi)∈∆φi
=true.
Lemma1is only applicable to states containing main chart transitions. Regarding states that do not contain main chart transitions, the safety transitionφsafety is not added, resulting in an incomplete transition relation. Since these states are responsible for detecting the completion of the pre-chart and not for detecting violations or errors, the incompleteness of the transition relation does not affect the correctness of observing the pre-chart. Our next result states that for all states except the first state of the automaton, the transition relation is deterministic. The transformed automaton is non-deterministic only in the first state (self-loop annotated withtrue) to accommodate for the global verification of every possible instance of the chart in the system. Non-deterministic automata as used in [KTWW06] result in error traces that have to be validated using full LTL verification, which has been shown to be impractical for LSCs [KM07]. Using deterministic automata guarantees that any reported errors are in fact valid errors in the system.
Lemma 2 For states q in the transformed automaton (except the initial state), the transition
relation is deterministic. Formally, ∀q∈Q,∀φi,φj :(q,φi,qi)∈∆∧(q,φj,qj)∈∆,(φi∧φj) = f alse.
The above result guarantees that for any given input to the transformed automaton (except the first and last state) exactly one transition is ever enabled. We now state our primary result for the transformed automaton. Intuitively, we show by application of Lemma1and Lemma2that the transformed automaton accepts only those words that are not accepted by the LSC and is capable of detecting all behaviors in a system that violate the LSC. We assume that the automaton created detects all pre-chart instances correctly.
Theorem 1 The automaton, A, generated by the transformation algorithm in Fig.4for a given
LSC, SPEC, defined over an alphabetΣSPEC⊆Σ, reads exactly the complement of the language of the SPEC. Formally,∀θ =θ0θ1θ2. . .
[θ∈L(SPEC) =⇒ θ6∈L(A)]∧[θ6∈L(SPEC) =⇒ θ∈L(A)].
where L(A)and L(SPEC)are the languages of the transformed automaton and the SPEC.
4.1 Verification Approach
5
Analysis
The verification approach presented in [KTWW06] utilizes at least two and in the worst case three algorithms to completely verify a system against an LSC. If reachability analysis followed by ACTL verification fails to produce a significant result (proof of correctness or a violation) the system is verified against an LTL formula generated from the LSC specification [TW06]. Compared to the verification approach of [KTWW06], the new verification approach presented in this paper only performs one verification run of comparable complexity as the reachability analysis and ACTL verification in the approach of [KTWW06]. In the average case the total verification cost is reduced by a factor of two and in the best case (worst case in old approach) by a factor of three or more.
One side effect of using the negative automaton is the inability to verify multiple instances of a chart with cold construct violations. For example, if in our example system theNodereceives
jobID but is unable to validate jobID, the cold condition validID is never observed and the chart automaton will remain in state q2. This is not an error since state q2 is a non-accepting
state waiting to observe the cold condition validID. If Node restarts the job acquisition by sending theidlemessage to theScheduler, the safety transition from stateq2toqsa f etyis taken.
Consequently, a false error will be reported (duplicate message). Generally speaking, if in one instance of the chart a cold construct is never observed, no future instances of the chart can be observed in a given trace. This drawback can be limiting for highly reactive and iterative systems with multiple instances in a single trace. A solution is being investigated as future work.
6
Results
We briefly discuss our experiments and results in this section. For a detailed presentation we refer the reader to the long version of the paper. We create models with multiple communi-cating processes and test them against highly concurrent worst case specifications as described in [KTWW06]. All specifications are named Ac×mwherecandmare the number of co-regions and messages in each co-region respectively.
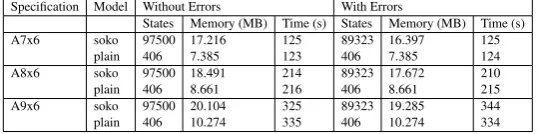
We first test the scalability of our approach in the symbolic model checking domain and com-pare it to the results presented in [KTWW06]. Table1shows a subset of the results for verifying theabpmodel using the NuSMV model checker. In general, our verification approach performs twice as fast as the approach presented in [KTWW06] and we scale to specification sizes that were unobtainable using the verification approach in [KTWW06]. We also test the scalability of our approach in explicit state model checking using the SPIN model checker. Table2 shows a subset of the results for verifying theplainandsokomodels. Our approach performs better and scales to larger specifications when compared to the approach of [KM07].
7
Conclusions and Future Work
Table 1: Results for the traditional and improved verification approaches using NuSMV.
Specification Traditional Verification Improved Verification Reachability ACTL Total
States Time (s) States Time (s) States Time (s) States Time (s) A3x5 1.01616e+06 34 1.47142e+07 35 15730360 69 1.41696e+07 34 A3x6 1.01616e+06 237 1.01616e+06 239 2032320 477 471552 251 A3x7 879408 1568 879408 1562 1758816 3130 521504 1550
Table 2: Results for the improved verification approach using SPIN.
Specification Model Without Errors With Errors
States Memory (MB) Time (s) States Memory (MB) Time (s) A7x6 soko 97500 17.216 125 89323 16.397 125
plain 406 7.385 123 406 7.385 124 A8x6 soko 97500 18.491 214 89323 17.672 210 plain 406 8.661 216 406 8.661 215 A9x6 soko 97500 20.104 325 89323 19.285 344 plain 406 10.274 335 406 10.274 334
verification runs for any arbitrary LSC. Further, we prove that the generated automaton can detect all safety and liveness violations in a system and empirically show the effectiveness of the approach. For future work we are investigating the use of LSCs for automated environment generation to test individual interfaces in a system. We are also investigating the possibility of extending the transformation algorithm to constructs such as overlapping chart instances, Kleene star and multiple instance detection with the presence of cold constructs (as discussed earlier).
Bibliography
[AY99] R. Alur, M. Yannakakis. Model Checking of Message Sequence Charts. In
CON-CUR99: Proc. of the 10th Int. Con. on Concurrency Theory. Pp. 114–129. Springer-Verlag, London, UK, 1999.
[BDK+04] M. Brill, W. Damm, J. Klose, B. Westphal, H. Wittke. Live sequence charts: An
introduction to lines, arrows, and strange boxes in the context of formal verification. InSoftSpez Final Report. Lecture Notes in Computer Science 3147, pp. 374–399. Springer, 2004.
[BH02] Y. Bontemps, P. Heymans. Turning high-level live sequence charts into automata.
In Proc. of ”Scenarios and State-Machines: Models, Algorithms, and Tools” (SCESM02) Workshop of the 24th Int. Conf. on Software Engineering (ICSE 2002). Orlando, FL, May 2002.
[BHK03] Y. Bontemps, P. Heymans, H. Kugler. Applying LSCs to the specification of an
[DH99] W. Damm, D. Harel. LSCs: Breathing life into message sequence charts. InProc. of the 3rd Int. Conf. on Formal Methods for Open Object-Based Distributed Systems (FMOODS99). P. 451. Kluwer, B.V., Deventer, The Netherlands, 1999.
[DK01] W. Damm, J. Klose. Verification of a radio-based signaling system using
the STATEMATE verification environment. Formal Methods in System Design
19(2):121–141, 2001.
[HK01] D. Harel, H. Kugler. Synthesizing state-sased object systems from LSC
specifica-tions. InCIAA00: Revised Papers from the 5th Int. Conf. on Implementation and Application of Automata. Pp. 1–33. Springer-Verlag, London, UK, 2001.
[IT93] R. ITU-T. 120: Message sequence chart (MSC).Telecommunication
Standardiza-tion Sector of ITU, Geneva, 1993.
[KHG05] C. Knieke, M. Huhn, U. Goltz. Modeling and simulation of an automotive system
using LSCs.Proc. of the 4th Int. Workshop on Critical Systems Development Using Modelling Languages (CSDUML05), 2005.
[Klo03] J. Klose.Live sequence charts: A graphical formalism for the specification of com-munication behavior. PhD thesis, Fachbereich Informatik, Carl Von Ossietzky Uni-versity, 2003.
[KM07] R. Kumar, E. Mercer. Improving translation of live sequence charts to temporal
logic. InProc. of the 7th Int. Conf. on Automated Verification of Critical Systems (AVoCS07). Pp. 183 – 197. 2007.
[KTWW06] J. Klose, T. Toben, B. Westphal, H. Wittke. Check it out: On the efficient formal verification of live sequence charts.Proc. of the 18th Int. Conf. on Computer Aided Verification (CAV06), LNCS4144:219–233, 2006.
[KW01] J. Klose, H. Wittke. An automata based interpretation of live sequence charts. In
TACAS 2001: Proc. of the 7th Int. Conf. on Tools and Algorithms for the Construc-tion and Analysis of Systems. Pp. 512–527. Springer-Verlag, London, UK, 2001.
[SD05] J. Sun, J. S. Dong. Model checking live sequence charts. InICECCS05: Proc. of the
10th IEEE Int. Conf. on Engineering of Complex Computer Systems (ICECCS05). Pp. 529–538. IEEE Computer Society, Washington, DC, USA, 2005.
[TW06] T. Toben, B. Westphal. On the expressive power of LSCs. InSOFSEM 2006: 32nd