AJPRHC Volume 5 Issue 1 8-15
AJPRHC
Research Article
DEVELOPMENT AND VALIDATION OF FIRST ORDER DERIVATIVE SPECTROPHOTOMETRIC METHOD FOR SIMULTANEOUS ESTIMATION OF PARACETAMOL AND TAPENTADOL
HYDROCHLORIDE IN TABLET DOSAGE FORM
SAMIL D. DESAI*, BHAVNA A. PATEL, SHRADDHA J. PARMAR, NAITIK N. CHAMPANERI
For Author affiliations see end of the text
This paper is available online at www.jprhc.in
KEY WORDS: Paracetamol (PCM), Tapentadol HCl (TAP), Spectroscopy, First order Derivative, Validation.
INTRODUCTION:
Paracetamol is 4-hydroxy acetanilide. It is analgesic, antipyretic agent and is the active metabolite of phenacetin, responsible for its analgesic effect by inhibiting COX 2 enzyme. It is a weak prostaglandin inhibitor in peripheral tissues and possesses no significant anti inflammatory effects. It is one of the most important drugs used for the treatment of mild to moderate pain when an anti inflammatory effect is not necessary [1-3].
Tapentadol Hydrochloride is chemically (3-[(1R, 2R)-3-(3-dimethylamino) -1- ethyl -2- methyl propyl] phenol monohydrochloride. Tapentadol is a centrally-acting opioid analgesic is used in the treatment of Acute Pain Management. It belongs to Non-Steroidal Anti Inflammatory Drug (NSAIDs). It is a centrally acting synthetic analgesic. Although its exact mechanism is unknown, analgesic efficacy is thought to be due to be due to -opioid agonist activity and the inhibition of norepinephrine reuptake. It is also an agonist of the 2 receptor, though the function of this orphan receptor remains controversial. The use of PCM and TAP combination therapy for the management of the pain associated with Osteoarthritis (OA) has been recommended to improve efficacy [4, 5].
A Tablet Dosage form containing PCM-325 mg & TAP-50 mg is commercially available. Literature survey revealed the most recent methods for determination of Paracetamol like chromatographic, electrochemical and spectrophotometric techniques are available [6-13]. Tapentadol Hydrochloride is not official in any Pharmacopoeia. Literature review revealed that several analytical techniques for estimation of Tapentadol
ABSTRACT:
AJPRHC Volume 5 Issue 1 8-15 Hydrochloride from Various biological Fluids by UPLC, LC/MS/MS, Chiral Chromatography and fluorimetric determination are available [14-19]. However, 1st order derivative spectrophotometric method and RP-HPLC [20] had been reported, for determination of this combination by using methanol as a solvent. This method uses 0.1 N NaOH as a solvent which makes method very cost effective as no costly solvent is used.
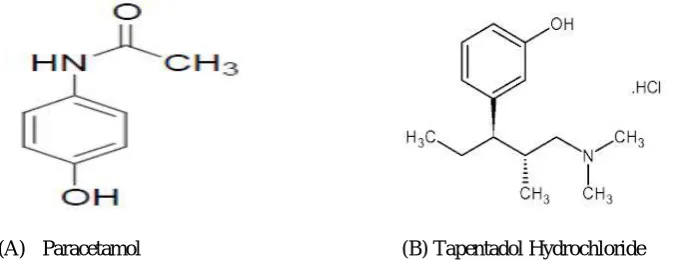
(A) Paracetamol (B) Tapentadol Hydrochloride
Figure 1: Chemical structure of (A) PCM and (B) TAP
MATERIALS AND METHODS
Reagents and chemicals
Analytically pure Paracetamol and Tapentadol HCl were used. Tablet of Paracetamol and Tapentadol HCl in combine dosage form, with a 325 mg PCM and 50 mg TAP label claim, manufactured by Glenmark Pharmaceuticals, India were procured from a local pharmacy.
Instruments
The Spectrophotometer used for study is Shimadzu UV/Vis 1800 double beam spectrophotometer with wavelength accuracy (± 0.3 nm), 1 cm matched quartz cells and UV probe 2.35 software was used for all the spectral measurements. Calibrated analytical balance Denver SI234, Germany was used for weighing purpose. All statistical calculations were carried out using Microsoft excel 2010 analytical tool.
Preparation of standard stock solutions
Accurately weighed 100 mg of PCM and TAP standard were transferred to separate 100 ml volumetric flask and dissolved in 50 ml 0.1 N NaOH. The flasks were shaken; sonicated & volume was made up to the mark with 0.1 N NaOH to give solutions containing 1000 g/ml PCM and 1000 g/ml TAP.
Selection of Analytical Wavelength
AJPRHC Volume 5 Issue 1 8-15
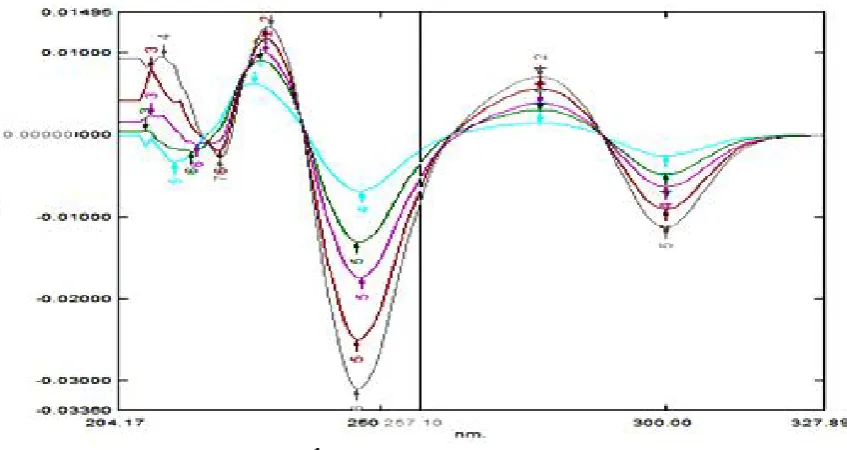
Figure 2: Overlain D1 spectrum of PCM (15-35 ppm) and TAP (3-15 ppm) in 0.1 N NaOH.
ZCP of PCM (257.1 nm), ZCP of TAP (289.0 nm)
Method validation
The proposed method has been extensively validated in terms of specificity, linearity, accuracy, precision, limits of detection (LOD) and quantification (LOQ), robustness and reproducibility.
Specificity
The Drugs were quantified from the taken Pharmaceutical Formulation. The D1 spectrum was recorded by appropriate dilutions and the quantities of drugs were determined.
Linearity
Appropriate volume of aliquot from PCM and TAP standard stock solution was transferred to volumetric flask of 10 ml capacity. The volume was adjusted to the mark with 0.1 N NaOH to give a solution containing 15-35 g/ml PCM and 3-15 g/ml TAP. All D1 Spectrum were recorded using above spectrophotometric condition. D1 absorbance at 257.1 nm and 289.0 nm were recorded for PCM and TAP respectively. Calibration curves were constructed by plotting average absorbance versus concentrations for both drugs.
Accuracy
Accuracy was assessed by determination of the recovery of the method by addition of standard drug to the prequantified sample preparation at three different concentration levels 80, 100 and 120%, taking into consideration percentage purity of added bulk drug samples. Each concentration was analyzed three times and average recoveries were measured.
Precision
AJPRHC Volume 5 Issue 1 8-15
Detection limit and Quantitation limit
ICH guideline describes several approaches to determine the detection and quantitation limits. These include visual evaluation, signal-to-noise ratio and the use of standard deviation of the response and the slope of the calibration curve. In the present study, the LOD and LOQ were based on the third approach and were calculated according to the 3.3 /S and 10 /S criterions, respectively;
Where, is the standard deviation of y-intercepts of regression lines and
S is the slope of the calibration curve.
Robustness
The sample solution was prepared and then analyzed with change in the typical analytical conditions like stability of analytical solution.
Determination of PCM and TAP from combined Tablet dosage form
Content of Twenty Tablets were weighed accurately. A powder quantity equivalent to 130 mg PCM and 20 mg TAP was accurately weighed and transferred to volumetric flask of 200 ml capacity. 100 ml of 0.1 N NaOH was transferred to this volumetric flask and sonicated for 15 min. The flask was shaken and volume was made up to the mark with 0.1 N NaOH. The above solution was filtered through whatman filter paper (0.45 ). The solution was diluted with the 0.1 N NaOH to give a solution containing 26 g/ml of PCM and 4 g/ml of TAP. The resulting solution was analyzed by proposed method. The quantitation was carried out by keeping these values to the straight line equation of calibration curve.
RESULTS & DISCUSSION
For this method, 289.0 nm (Zero crossing point of TAP) and 257.1 nm (zero crossing point of PCM) of first order derivative spectra were selected for the analysis and the linearity range of 15-35 g/ml & 3-15 g/ml for PCM and TAP was taken respectively. Straight line equations were obtained from these calibration curves which were shown in figure (Figure 3 & 4). The Correlation Coefficients (r2) for PCM & TAP was found to be 0.9987 & 0.9982 respectively.
AJPRHC Volume 5 Issue 1 8-15
Figure 3: Calibration Curve of Paracetamol
Figure 4: Calibration Curve of Tapentadol HCl
y = 0.0012x - 0.0005 R² = 0.9989
0 0.01 0.02 0.03 0.04 0.05
0 10 20 30 40
A
b
so
rb
a
n
ce
Concentration(µg/ml)
Paracetamol
Linear (Series1)
y = 0.0005x + 0.0004 R² = 0.9993
0 0.001 0.002 0.003 0.004 0.005 0.006 0.007 0.008 0.009
0 5 10 15 20
A
b
so
rb
a
n
ce
Concentration(µg/ml)
Tapentadol Hcl
AJPRHC Volume 5 Issue 1 8-15
Figure 5: Overlain D1 spectrum of PCM (15-35 ppm) in 0.1 N NaOH
Figure 6: Overlain D1 spectrum of TAP (3-15 ppm) in 0.1 N NaOH
Table 1: Results of analysis of tablet formulation
Drugs Label claim (mg) Amount of drug
estimated (mg/tab)
% Label claim ±
S.D. % Recovery
PCM 325 324.36 99.80 ± 0.000169 99.76%
TAP 50 49.56 99.12 ± 0.000039 98.90%
Table 2: Results of recovery studies (tablet)
% Level
Amt. of PCM taken in
g/ml
Amt. of TAP taken in
g/ml
Amt. of Std PCM added in
g/ml
Amt.of Std TAP added in
g/ml
% Recovery
(PCM)
% Recovery
(TAP)
%RSD PCM
%RSD TAP
80% 26 4.0 20.8 3.2 99.68% 98.86% 0.92% 1.04%
100% 26 4.0 26.0 4.0 99.85% 99.14% 1.04% 1.12%
AJPRHC Volume 5 Issue 1 8-15
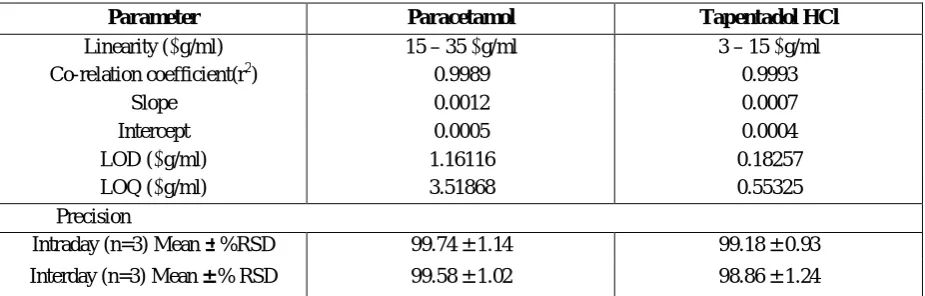
Table 3: Results of validation parameters
Parameter Paracetamol Tapentadol HCl
Linearity ( g/ml) 15 – 35 g/ml 3 – 15 g/ml
Co-relation coefficient(r2) 0.9989 0.9993
Slope 0.0012 0.0007
Intercept 0.0005 0.0004
LOD ( g/ml) 1.16116 0.18257
LOQ ( g/ml) 3.51868 0.55325
Precision
Intraday (n=3) Mean ± %RSD 99.74 ± 1.14 99.18 ± 0.93
Interday (n=3) Mean ± % RSD 99.58 ± 1.02 98.86 ± 1.24
CONCLUSION
Based on the results obtained, it is found that the proposed method is accurate, reproducible & economical and can be employed for routine quality control of Paracetamol and Tapentadol HCl in bulk and its dosage form.
ACKNOWLEDGEMENT
The authors are heartly thankful to P.G.Department of Pharmaceutical Sciences, Sardar Patel University (Vallabh Vidyanagar, Gujarat, India) for funding entire project and providing the necessary facilities for research work.
REFERENCES
1. Indian Pharmacopoeia. 6th ed. Ghaziabad: The Indian Pharmacopoeia Commission 2010. Volume- III. p. 1859-61
2. British Pharmacopoeia. London: British Pharmacopoeia Commission 2010. Volume I, II, III. p. 847, 2677, 2967
3. European Pharmacopoeia, 7th ed. The directorate for the quality of medicine and healthcare of European council. Vol. II. p. 1981-82, 2667
4. Available From URL: http://www.nucynta.com/mechanism-of-action [cited 2013 20th June]
5. Tzschentke TM, Christophe T, Kogel B, Schiene K, Hennies HH, Englberger W et al. A Novel -Opioid Receptor Agonist/Norepinephrine Reuptake Inhibitor with Broad-Spectrum Analgesic Properties. J of pharmacol experimental therapeutics 2007;323(1):265-76
6. Delvadiya K. Spectrophotometric simultaneous analysis of paracetamol, propylphenazone and Caffeine in tablet dosage forms. Int J Pharm Pharm Sci 2011;3 (3):170-74
7. Chandratey A, Sharma R. Simultaneous spectrophotometric estimation of three component tablet formulation containing Paracetamol, Nimesulide and Tizanidine. Ind j chem tech 2010;17:229-32 8. Gharge D, Dhabale P. Simultaneous Estimation of Tramadol Hydrochloride and Paracetamol by UV
Spectrophotometric Method from Tablet Formulation. Int J PharmTech Res 2010;2(2):1119-23
9. Vichare V. Simultaneous Spectrophotometric determination of Paracetamol and Caffeine in Tablet Formulation, Int. J PharmTech Res 2010;2(4):2512-16
10. Gopinath R. A RP-HPLC method for simultaneous estimation of paracetamol and aceclofenac in tablets. Ind J of pharmaceutical sciences 2007;69(1):137-40
AJPRHC Volume 5 Issue 1 8-15 12. Azhagvuel S, Sekar R. Method development and validation for the simultaneous determination of
cetrizine dihydrochloride, paracetamol, and phenylpropanolamine hydrochloride in tablets by capillary zone electrophoresis. J Pharma Biomed Analysis 2007;43(3):873-78
13. Adithya P, Mahesh J, Vijayalakshmi M. Spectrophotometric estimation of Tapentadol in bulk and its pharmaceutical formulation. J Chem Pharma sci 2013;5(2):150-55
14. Centre for Drug Evaluation and Research-FDA 2011. Available From URL: http:/ www.accessdata.fda.gov NDA 22-304 [cited 2013 15th March]
15. Available From URL: http://www.medlineindia.com/list of approved drugs in 2011India.html [cited 2013 16th March]
16. Bourland, James A. and Collins. Determination of Tapentadol (Nucynta®) and N-Desmethyltapentadol in Authentic Urine Specimens by Ultra- Performance Liquid Chromatography-Tandem Mass Spectrometry. J Ana Toxicol 2010;34(8): 450-57
17. Coulter C, Taruc M, Tuyay J, Moore C. Determination of Tapentadol and its Metabolite N-Desmethyltapentadol in Urine and Oral Fluid using Liquid Chromatography with Tandem Mass Spectral Detection. J Anal Toxicol 2010;34(8):458-63
18. Krishna R, Balasubramanian S, Pradhan N, Khunt M. Four Stereoisomers of the novel ì-opioid receptor agonist Tapentadol Hydrochloride. J Acta Crystallographica 2012;3(4):422-26
19. Pranathi S. M.Pharm Thesis: Development of new analytical methods for the estimation of Tapentadol in bulk drug and pharmaceutical formulation. Rajiv Gandhi University of Health Sciences, Bangalore, 2011-12
20. Ramanaiah G, Ramachandran D, Srinivas G, Jayapal G, Rao P, Srilakshmi V. Development and Validation of Stability Indicating RP-LC Method for Simultaneous Estimation of Tapentadol and Paracetamol in Bulk and its Pharmaceutical Formulations. Drug Inven Today 2012;4(7):391-96
AUTHORS AFFILIATION AND ADDRESS FOR CORRESPONDENCE
P.G.Department of Pharmaceutical Sciences, Sardar Patel University, Vallabh Vidyanagar- 388 120 (Gujarat), India.