DETECTING DROUGHT TOLERANCE OF FIG
(FICUS CARICA
,
L
.) CULTIVARS DEPENDING ON
VEGETATIVE GROWTH AND PEROXIDASE ACTIVITY
Doaa, A. Darwish
Molecular Biology Department, National Research Center, Dokki, Giza,
Egypt.
El-Berry, I. M
Department of Pomology, Faculty of Agriculture (El-Shatby), Alexandria University, Alexandria,Egypt.
Mustafa, N.S & F. Hagagg
Department of Pomology, National Research Center, Dokki, Giza,Egypt.
Fatma S. Moursy
Central Laboratory for Agricultural Climate (CLAC),Agricultural Research Center, Dokki, Giza, Egypt.
Abstract
This study was carried out to detect the effect of water stress on vegetative growth and peroxidase activity of two fig cultivars grown in new reclaimed land, in Egypt. In order to simulate drought circumstances, two irrigation regimes were used to treat fig plants (Ficus carica, L.) as well as a control treatment, i.e. 100% from class A pan (control), 75% and 50% from class A pan (drought treatments). Plant height, stem diameter, leaves fresh and dry weight and leaf area were measured define the vegetative growth. To quantifying the degree of water status, leaf water content was measured. In addition, free amino acid proline and protein content were measured. Moreover, peroxidase activity and the specific activity of peroxides were determinate in all treatments. Obtained results indicated that the Gizy fig cultivar had the highest vegetative growth compared with Aboudi cultivar under the three irrigation treatments. The peroxidase activities (units/ml) of Gizy cultivar by (100% ETc, 75% ETc and 50% ETc) irrigation treatments were greater than Aboudi cultivars during the two seasons.
Keywords:
Drought tolerance, Fig(Ficus carica, L.), vegetative growth and peroxidase, peroxidase activity, leaves water content, proline content1.
INTRODUCTION
Egypt lies between latitudes 22° and 32°N, and longitudes 25° and 35°E, with about one million square kilometers of land, under arid and hyper-arid climatic conditions. Egypt location reflected a negative impact on agriculture, water resources and ecosystems (López-Moreno et al., 2009). Drought is the most critical environmental stress, which is seriously affects germination, survival, growth and performance of shrubs and trees (Fernández et al., 2006).
morphological to physiological aspects are developed. For example the mechanisms developed by some fruit trees to survive water deficits included reduction in growth rate, stem elongation, leaf expansion, orientation and stomata movements (Jung, 2004). A wide range of plants are able to protect themselves by synthesizing antioxidants such as ascorbate and glutathione and enhancing antioxidative enzymes such as peroxidase. Reactions of plant antioxidant systems upon drought have been intensively investigated for several crop plants (Müller et al., 2006).
Fig (Ficus carica, L.) is one of the deciduous fruit trees grow in Egypt. It grows successfully along the North-West coast and most of the orchards depend upon the winter rainfall as a main source for their water requirements. It expanded throughout the centuries, where it was known since the Old Kingdom. Although fig plants are mostly grown under rain fed conditions, studies have shown severe injuries to the plant under prolonged drought stress (Hallac Turk and Aksoy, 2011; Gholami et al., 2012; Karimi et al., 2012). Drought stress incidence results in massive leaf abscission and reduce fruit yield and its quality (Hallac Turk and Aksoy, 2011).
The illustrated drought circumstances in Egypt, improving drought tolerance in fig is an important economical way to improve its productivity under drought conditions. Fortunately, there is a great genetic diversity in fig, which some of fig varity show drought tolerance and others are not drought tolerance. So, obtaining drought tolerant varieties via screening is essential to introduce drought tolerant fig variety.
There is a relation between drought stress and an antioxidant system. Such relationship has been studied in some plant species. Drought stress induces production of reactive oxygen types such as superoxide, hydrogen peroxide, hydroxyl radicals and singlet oxygen in the leaves of plants (Li et al., 1998). This reactive oxygen species may cause oxidative damages to cells and internal organelles such as lipid peroxidation, chlorophyll bleaching, protein oxidation and nucleic acids (Scandalios, 1993). Antioxidant defensive system such as peroxidase and low-molecular antioxidants is an important factor in the tolerance of various plants to environmental stress (Rensburg and Kruger, 1994).
Peroxidases (EC. 1.11.1.7, oxidoreductases), have iron porphyrin ring generally and catalyzes a redox reaction between H2O2 as an electron acceptor and many kinds of substrates by means of oxygen liberation from H2O2. (Brill, 1996; Bansal and Kanwar, 2013). These enzymes are present in plants, animals, and microorganisms (Bansal and Kanwar, 2013). The enzyme occurs in plants like radish and soybean (Ambreen et al., 2000), tomato (Zia et al., 2001), potato, turnip, carrot, wheat, pear, apricot, banana and dates (Reed, 1975), strawberry (Jen et al., 1980) and horseradish (Rehman et al., 1999). Peroxidase is one of the most studied enzymes due to its widespread commercial applications. The commercial value of the peroxidase enzyme is, however, also an important addition to the economic importance of the plant. Other uses of the enzyme include organic synthesis, biotransformation and the treatment of waste water
Other studies confirmed that the highest enzyme activity caused because of water deficit . This fact agreed with those obtained by Bacelar et al. (2007), recorded that guaiacol peroxidase (GPX) activity increased in the drought-stressed leaves of olive trees. Sofo et al. (2007) reported that the effect of drought on the activities of ascorbate peroxidase (APX) and catalase (CAT) in olive leaves showed a marked increase.
The objectives of this study were, (1) to describe and compares the diversity observed in two local fig cultivars regarding to drought tolerance, (2) select the tolerant fig cultivar from the two studied cultivars.
2.
MATERIALS & METHODS
Current investigation was conducted at Cairo-Alexandria desert road (Emam Mallek village), Al-Nobaria district, Al-Behera governorate, Egypt, during 2011 and 2012 seasons. One hundred and eight plants (one year old) of two fig cultivars, namely Abboudi and Gizy were treated during the study.
To simulate drought circumstances, three irrigation regimes (treatments) were applaied with fig plants under study, 100% ETc, 75% ETc and 50% ETc. Irrigation was applied twice a week beginning from the 1st of July to 31st of October during both seasons (about 120 days).
The first step was to calculate the potential evapotranspiration which was made according to the following formula (FAO, 1977):
ETo = Kp X E Pan (mm / day) Where:
ETo = Potential evapotranspiration in mm/day. Kp (Pan coefficient) = three stage (0.5, 0.75 and1) E Pan = Pan evaporation in mm/day.
The second step was to obtain values of crop water consumptive use (ETcrop) as follows (FAO, 1977). ETcrop = ETo x Kc mm / day
Where:
ETo = the rate of evapotranspiration from an excessive surface of green cover of uniform height (8 to 15 cm), actively growing, completely shading the ground and did not face shortage in water.
Kc = Crop coefficient between
Step 3 was calculate the water requirements (WR) for each treatment. Calculation was done according to the following equations given by Vermeiren and Jobling (1980) as following:
ETc = ETo * Kc * Kr (1)
IW=
*
*
*
*
4
.
2
LR
Ea
I
Kr
Kc
ETo
(2)
Where:
IW = Irrigation water applied m3 / fed / irrigation ETc= Crop evapotranspiration, (mm/day) ETo = Reference evapotranspiration, (mm/day) Kc = Crop coefficient.
Kr = Reduction coefficient. I = Irrigation intervals, day Ea = Irrigation efficiency, 90%.
LR = Leaching requirement = 10% of the total amount water delivered to treatment.
Reference evapotranspiration (ETo) was calculated using the modified Penman-Monteith equation (Doorenbos and Kassam, 1979). Crop coefficient (Kc) was calculated according to (Hernández et al., 1994a and 1996) and a reduction coefficient was calculated according to the method by (Keller and Karmeli, 1975).
Parameters to measure vegetative growth were as follow:
1-Plant height (cm) was measured from the trunk to the highest point in the stem; it recorded at the end of each growth season.
2-Plant stem diameter (cm) was measured by caliper at 5 cm height above the ground.
3- Plant fresh and dry weights were determined for 10 leaves per plant at the end of each growing season.
4-Leaf area (cm2) was estimated using five leaves selected from each plant according to the method by Radwan (1973).
2.1 Isoenzyme analysis:
2.2 Preparation of Crude Extract:
Three grams of fig tissues were frozen in liquid nitrogen. Fig sample was grinded in mortar and added to 9 ml of 50 mM K-phosphate pH 7.0. after that it was centrifuged at 12,000 rpm for 30 min at 4°C and the supernatant passed through filter paper (Ambreen et al., 2000; Zia, 2002). This extraction was subjected to enzyme assay and protein estimation.
2.3 Peroxidase assay according to Kamel& Ghazy (1973):
Peroxidase activity using guaiacol was carried out in reaction mixture containing in one ml volume 8 µ moles of H202, 60 µ moles guaiacol, 150 µ moles sodium acetate buffer, pH 5.6 and peroxidase concentration which gave linear response over a period of 3 min. The change in absorbance at 470 nm due to guaiacol oxidation was followed at 30 second intervals. One unit of peroxidase activity was defined as the amount of enzyme which causes an increase of one O.D. unit per min at 25 C under the assay conditions.
2.4 Electrophoretic analysis:
Native polyacrylamide gel electrophoresis (7% PAGE) was carried out according to Smith, (1969). SDS-PAGE was performed according to Laemmli, (1970) and Weber and Osborn, (1969). The proteins were stained with 0.25% coomassie brilliant blue R-250.
2.5 Peroxidase staining:
The gel is dipped in freshly prepared solution contained 266 µ moles of H202, 2000 µ moles guaiacol in 100 ml of 0.05M sodium acetate buffer, pH 5.6 and the enzymatic reaction was blocked by 7 % acetic acid.
2.6 Protein determination:
Protein concentration was determined according to the method of Bradford (1976). Bovine serum albumin (BSA) was used as a standard.
2.7 Gel scanning:
Protein bands revealed on gels were scanned with Video Copy Processor P65E (Appligene). Quantitative determination of the resolved protein bands was carried out using total laboratory Software, Microsoft.
2.8 Experimental Design & data analysis:
The experiment was carried out as factorial in randomized complete block design RCBD with three replications (three plants / replicate) during the two seasons of 2011 & 2012. Data in this study were statistically analyzed using the SAS (Statistical Analysis System) version 8.1 according to Gomez and Gomez (1984). Least Significant Differences (L.S.D) at 0.05 used to compare the differences among means according to Snedecor and Cochran (1967).
3.
RESULTS
3.1
Plant height
:
Highlighting the effect of interaction between cultivars and irrigation regimes, the highest significant plant height observed when the cultivar Gizy irrigated with 100% from the ETc during both studied seasons. The second high significant plant height was found as a result of the interaction between Aboudi and 100% from the ETc in the first season. While, during the second season, interaction between Gizy and 75% and Aboudi irrigated with 100% recorded the second highest significant values without significant different between them. However, interactions between the two studied cultivars and 50% presented the lowest values of plant height during the two studied seasons.
Table (1): Effect of fig cultivars, irrigation treatments and it’s interaction on plant height (cm) of two fig cultivars during the 2011 and 2012 seasons.
Irrigation % of ETc
First season 2011 Second season 2012
Gizy Aboudi Mean Gizy Aboudi Mean
100% 54.67 a 43.83 b 49.25 a 64.23 a 57.40 ab 60.82 a
75% 42.50 bc 37.50 bc 40.00 b 63.40 a 49.90 ab 56.65 ab
50% 35.23 c 36.33 bc 35.78 b 45.90 b 45.73 b 45.82 b
Mean 44.13 a 39.22 b 57.84 a 51.01 a
3.2
Stem diameter:
Data in Table (2) showed the effect of cultivars, irrigation treatment and there interaction on fig stem diameter. Gizy cultivar had a significant bigger stem diameter compared with Aboudi cultivar in the two studied seasons.
Stem diameters reduced gradually with each reduction in the amount of irrigation water. In other words, the highest significant value of stem diameter was recorded with 100% of the ETc, followed by those with 75% of the ETc. However, the lowest value of stem diameter recorded in plants that irrigated with 50% of the ETc. No significant difference was observed between stem diameters of plants that irrigated with 75% or 50%. The demonstrated result was true during the first season.
Regarding results of second season, no significant effect was detected as a result for the irrigation regime application, but the values of the stem diameter appeared to be in similar order to those in the first season (stem diameter of plants irrigated with 100% followed by 75% and finally 50% of the ETc).
It’s clear from Table (2) that the interaction between cultivars and irrigation regime affected stem diameter significantly during both studied seasons. Interaction between Gizy and 100% recorded the highest significant values of stem diameter in the studied seasons. Moreover, interaction between Aboudi and both of 75% and 50% were significantly the lowest values of stem diameter in both seasons and without significant different between them.
Table (2): Effect of fig cultivars, irrigation treatments and it’s interaction on stem diameter (cm) of two fig cultivars during the 2011 and 2012 seasons.
Irrigation % of ETc
First season 2011 Second season 2012
Gizy Aboudi Mean Gizy Aboudi Mean
100% 1.90a 1.10bc 1.5a 2.17a 1.40 b 1.78a
75% 1.40b 1.03c 1.22b 1.67ab 1.27 b 1.47a
50% 1.23bc 1.00 c 1.12b 1.60ab 1.20 b 1.40 a
Mean 1.51a 1.04b 1.8 a 1.29 b
3.3
Leaves fresh weight
:
Leaves fresh weight affected significantly by fig cultivars (Table 3). The highest significant leave fresh weight was recorded in Gizy cultivar in both studied seasons.
Table (3) also showed that the interaction between Gizy and 100% of the ETc results the highest significant leaves fresh weight during the two studied seasons. Furthermore, the second high values was detected in Aboudi irrigated with 100% of the ETc followed by interaction between Gizy and 75% without significant different between them. Same result was true in the second season but in reverse order. On the other hand, lowest significant leave fresh weight was represented in the interaction of Aboudi and 50% of the ETc in both studied seasons.
Table (3): Effect of fig cultivars, irrigation treatments and it’s interaction on leave fresh weight (g) of two fig cultivars during the 2011 and 2012 seasons.
Irrigation % of ETc
First season 2011 Second season 2012
Gizy Aboudi Mean Gizy Aboudi Mean
100% 5.63 a 3.41 b 4.52 a 3.34 a 2.41 ab 2.88a
75% 3.08 b 2.72bc 2.90 b 2.67 ab 2.07b 2.37ab
50% 2.42 bc 1.76 c 2.09 c 2.44 ab 1.56 b 2.00b
Mean 3.71 a 2.63 b 2.82 a 2.01 b
3.4
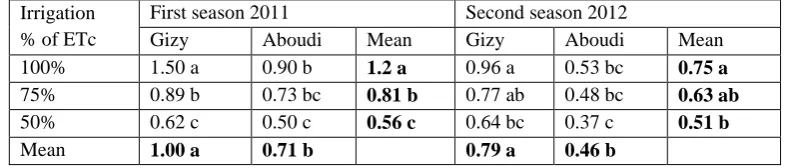
Leaves dry weight
:
Table 4 indicated that Gizy cultivar had significantly the highest leave dry weight compared with Aboudi cultivar in both studied seasons. Similar to leave fresh weight, values of leave dry weights were in a descending order with each reduction in the irrigation regime in both studied seasons. Such result appears in highest significant leave dry weight in plants irrigated with 100% followed by those irrigated with 75% and the lowest was found when irrigation with 50% of the ETc was applied.
The highest significant leave dry weight found with the interaction between Gizy irrigated with 100% of the Etc during the two studied seasons. The second high value of leave dry weight was observed with Aboudi irrigated with 100% of the Etc, followed by Gizy irrigated with 75% without any significant different between them. However, in the second season interaction between Gizy irrigated with 75% of the ETc was higher than Aboudi irrigated with 100% and without significant different between them. In the contrary, the lowest significant leave dry weight was found in the interaction between the two cultivars and 50% of the ETc in both studied seasons.
Table (4): Effect of fig cultivars, irrigation treatments and it’s interaction on leave dry weight (g) of two fig cultivars during the 2011 and 2012 seasons.
Irrigation % of ETc
First season 2011 Second season 2012
Gizy Aboudi Mean Gizy Aboudi Mean
100% 1.50 a 0.90 b 1.2 a 0.96 a 0.53 bc 0.75 a
75% 0.89 b 0.73 bc 0.81 b 0.77 ab 0.48 bc 0.63 ab
50% 0.62 c 0.50 c 0.56 c 0.64 bc 0.37 c 0.51 b
Mean 1.00 a 0.71 b 0.79 a 0.46 b
3.5
Leaves area
From Table (5) it is concluded that the cultivar Gizy gave the highest significant leaves area comparing with Aboudi cultivar in the two studied seasons. In addition, irrigation regime has a significant effect on leaves area. Irrigation with 50% of the ETc, recorded the lowest significant leaves area compared with other studied irrigation regimes (100% and 75% of the ETc) in both studied season. While, plants irrigated with 100% of the ETc recorded significantly the highest value of leaves area followed by 75% of the ETc. Such result was true in both studied seasons.
significant different between them during the two studied seasons. It was also noted that, no significant different were found with both interactions between Aboudi and 100% and interaction between Gizy and 75% or Aboudi irrigated with 75% of the ETc in the two studied seasons.
Table (5): Effect of fig cultivars, irrigation treatments and it’s interaction on leaves area (cm) of two fig cultivars during the 2011 and 2012 seasons.
Irrigation % of ETc
First season 2011 Second season 2012
Gizy Aboudi Mean Gizy Aboudi Mean
100% 130.66 a 74.66 b 102.66 a 131.46 a 75.46 b 103.46a
75% 73.42 bc 71.76 bc 72.59 b 74.22 b 72.85 b 73.54 b
50% 60.09 cd 46.46 d 53.27c 61.52 bc 47.26c 54.39 c
Mean 88.06 a 64.29 b 89.07 a 65.19 b
3.6
Leaves water content
Result in Table (6) show that Gizy had the highest significant water content in leaves compared with the Aboudi cultivar. The highest significant leave water content was detected in plants that irrigated with 100% of the ETc followed by those irrigated with 75%. However, the lowest significant value was observed in plants irrigated with 50%. Moreover, during the first season, no significant different was found in leave water content in plants irrigated with 75% and those irrigated with 50% of the ETc during the first season. While, a significant different was found between all studied irrigation regime during second season.
Interaction between Gizy and 100% ranked the first with the highest significant leave water content during both studied seasons. Second significant leave water content was recorded in Aboudi interacted with 100% followed by interaction between Gizy and 75% of the ETc, without significant different between them. Furthermore, the lowest significant leave water content was found with Aboudi irrigated with 50% during both studied seasons.
Table (6): Effect of fig cultivars, irrigation treatments and it’s interaction on leave water content of two fig cultivars during the 2011 and 2012 seasons.
Irrigation % of ETc
First season 2011 Second season 2012
Gizy Aboudi Mean Gizy Aboudi Mean
100% 4.13 a 2.50 b 3.32 a 2.38 a 1.88 ab 2.13 a
75% 2.19 b 1.99 bc 2.09 b 1.90 ab 1.58 ab 1.74 a
50% 1.80 bc 1.26 c 1.53 b 1.79 ab 1.20 b 1.50 b
Mean 2.71 a 1.92 b 2.02 a 1.55 a
3.7
Leaf free amino acid content
Table (7) show that the response of cultivars to leaf free amino acid contents had a trend contrary to the vegetative growth trend. The highest significant free amino acid in leaves was recorded with Aboudi cultivar during the two studied seasons.
Hence, the highest significant free amino acid in leaves was detected in plants that irrigated with 50% of the ETc, followed by those irrigated with 75% and finally plants that irrigated with 100% of the ETc. No significant different between free amino acid in leaves of plants irrigated with 50% or 75% of the ETc. The same trend was found in the second season.
Table (7): Effect of fig cultivars, irrigation treatments and it’s interaction on leaves free amino acid of two fig cultivars during the 2011 and 2012 seasons.
Irrigation % of ETc
First season 2011 Second season 2012
Gizy Aboudi Mean Gizy Aboudi Mean
100% 64.37 c 71.59 bc 67.98 b 65.37 c 71.89 bc 68.63 b
75% 75.12 bc 77.52 ab 76.32 a 75.63bc 78.01 ab 76.82 a
50% 75.45 b 86.71 a 81.08 a 75.75bc 87.72 a 81.74 a
Mean 71.65 b 78.61 a 72.25 b 79.21 a
3.8
Leaf proline content
Levels of proline content in leaves affected significantly by cultivars and irrigation regimes as well as the interaction between them (Table 8). The highest significant proline was found in leaves of Aboudi cultivar throughout the two studied seasons. However the irrigation regime 50% of the ETc gave, significantly, the highest content of proline in leaf. Second highest significant proline content was detected in plants irrigated with 75% of the ETc. Moreover, lowest significant leaf proline content was observed in plants that irrigated with 100% of the ETc. It’s notable from data in Table (8) that, no significant different was detected between proline content of plants irrigated with 75% or 100% of the ETc. The mentioned trend of results was confirmed for the two studied seasons.
Interaction between Aboudi and 50% of the ETc was significantly the highest in leaf proline content. Moreover, no significant different was observed within other studied interactions during both studied seasons.
Table (8): Effect of fig cultivars, irrigation treatments and it’s interaction on leaf proline content of two fig cultivars during the 2011 and 2012 seasons.
Irrigation % of ETc
First season 2011 Second season 2012
Gizy Aboudi Mean Gizy Aboudi Mean
100% 0.46 b 0.42 b 0.44 b 0.41 b 0.39 b 0.40 b
75% 0.44 b 0.56 b 0.50 b 0.44 b 0.56 b 0.50 b
50% 0.41 b 0.86 a 0.64 a 0.46 b 0.86 a 0.66 a
Mean 0.43 b 0.62 a 0.44 b 0.60 a
3.9
Protein content
Cultivar Aboudi was significantly the lowest in protein content, while Gizy was significantly the highest (Table 8). The same result was found during the second season.
A significant increment was recorded with every decrement in the irrigation regime from 100% to 75% and then 50% of the ETc. In another words, the highest significant protein content was recorded with the irrigation regime 50% followed by 75% of the ETc. However, the lowest significant proteins activity was observed in 100% water regime.
Regarding the interaction between fig cultivars and irrigation regimes, the highest significant interaction was detected in plants of Gizy irrigated with 50% in both studied seasons. Moreover, interaction between Aboudi and 100% recorded the lowest significant protein content during both studied seasons.
Table (9): Effect of fig cultivars, irrigation treatments and it’s interaction on protein content (mg/ml) of two fig cultivars during the 2011 and 2012 seasons.
Irrigation % of ETc
First season 2011 Second season 2012
Gizy Aboudi Mean Gizy Aboudi Mean
100% 0.173b 0.225b 0.199B 0.915b 0.345b 0.63B
75% 0.378a 0.252b 0.315B 1.001b 0.445b 0.723B
50% 0.633a 0.183b 0.408A 2.85a 0.236b 1.54A
3.10
Peroxidase activity
It was noted from data in Table (10) that, the peroxidase activity was significantly the highest in plants of Gizy compared with Aboudi during the two studied seasons.
It also indicated that, tested irrigation regimes significantly affected peroxidase activity during both studied seasons. The highest significant peroxidase activity was observed in fig plants irrigated with 75% of the ETc followed by those irrigated with 100%. The lowest significant peroxidase activity was recorded in plants irrigated with 50% of the ETc.
Interaction between fig cultivars and different tested irrigation regimes significantly affected peroxidase activity. The highest significant peroxidase activity was detected when plants of Gizy irrigated with 75% of the ETc. The same results were confirmed in the second seasons.
Table (10): Effect of fig cultivars, irrigation treatments and it’s interaction on Peroxidase activity (units/ml)of two fig cultivars during the 2011 and 2012 seasons.
Irrigation % of ETc
First season 2011 Second season 2012
Gizy Aboudi Mean Gizy Aboudi Mean
100% 3.03a 2.84b 2.935B 14.59a 2.68d 8.635A
75% 3.98a 3.91a 3.945A 8.09b 4.49c 6.29B
50% 2.85b 1.62c 2.235B 1.46e 0.54f 1.00C
Mean 3.28A 2.79B 8.05 2.57
3.11
Specific activity of peroxidase
Table (11) shows that cultivar Gizy was significantly the highest in specific activity of peroxidase compared with the cultivar Aboudi during both studied seasons.
Moreover, the irrigation regime 100% of the ETc. reflected the highest significant specific activity of peroxidase followed by 75% without significant different between them. The lowest significant specific activity of peroxidase was found in plants irrigated with 50% of the ETc. The same trend of results found during the second season.
The same table also shows that the highest values of specific activity of peroxidase were observed when plants of Gizy irrigated with 100% of the ETc, followed by plants of the same cultivar irrigated with 75% of the ETc.
Table (11): Effect of fig cultivars, irrigation treatments and it’s interaction on specific activity (units/mg) of two fig cultivars during the 2011 and 2012 seasons.
Irrigation % of ETc
First season 2011 Second season 2012
Gizy Aboudi Mean Gizy Aboudi Mean
100% 17.51a 3.96c 10.73A 15.9a 2.5c 9.20A
75% 10.52b 10.02b 10.27A 8.08b 6.75b 7.42A
50% 4.5c 2.74c 3.62B 1.209d 2.52c 1.86B
1
stseason
a- Peroxidase activity
Fig. (1):
Isoenzyme pattern on 7% native polyacrylamide gel: (1) Gizy cultivar (G) and Aboudi cultivar (A) by 100% ETc. (2) Gizy cultivar (G) and Aboudi cultivar (A) by 75% ETc. (3) Gizy cultivar (G) and Aboudi cultivar (A) by 50% ETc during 2011.A
G
A
G
A
G
100%
75%
50%
2
ndseason
a- Peroxidase activity
Fig. (3):
Isoenzyme pattern on 7% native polyacrylamide gel: (1) Gizy cultivar (G) and Aboudi cultivar (A) by 100% ETc. (2) Gizy cultivar (G) and Aboudi cultivar (A) by 75% ETc. (3) Gizy cultivar (G) and Aboudi cultivar (A) by 50% ETc during 2012.G
A
G
A
G
A
75%
50%
100%
4.
DISCUSSION:
In Egypt, there are numerous local Fig cultivars with a variety of sizes, shapes, ripening times, skin and pulp colors and taste. Morphological characterization and the protection of this genetic diversity for future generations are very important. Concerning the reduction and scarcity of fresh water, one of the suggested strategies for a sustainable increase in Fig production is screening existed cultivars for drought tolerance. Such strategy will help in breeding programs, as well as increasing the cultivated area of the chosen tolerant cultivar.
In this study, vegetative growth characteristics, proline and protein contents and Peroxidase activity for two local Fig cultivars were identified under two irrigation regimes compared with total needed water requirement.
From the illustrated results, adverse effect of drought stress on vegetative growth of both studied cultivars is well documented. Growth reduction by water deficit stress is caused by changes in several physiological and morphological processes such as reduced stem elongation, stem diameter, leaves area and leaves fresh weight of the plants under water deficit stress (Tables 1, 2, 3, 5 and 6). The mentioned reduction in vegetative growth characteristics was in accompanied by an increase of free amino acid and proline contents (Tables 7 and 8). The same results were found by Rostami and Raheini (2013). They explain the reduction in fig tree vegetative growth to the reduction in relative water content and leaf water content.
The reduction in plant height (Table 1) could be attributed to decline in cell enlargement and massive leaf abscission in plant under water stress (Manivannan et al., 2007).
Regards leaf area, all reviews reported that the leaf area expansion depends on leaf turgor, temperature, and assimilating supply for growth. Drought-induced reduction in leaf area is ascribed to suppression of leaf expansion through reduction in photosynthesis (Rucker et al., 1995). Reduced leaf area and defoliation represent an adaptation strategy by diminish water loss and increasing water deficit tolerance (Halim, 1989).
Moreover, stem and leaf growth may be inhibited at low water potential. This suggests that the growth inhibition may be metabolically regulated possibly serving an adaptive role by restricting the development of transpiring area under water stress condition (Sharp, 1996).
Trunk diameter also reflects the effect of water stress. Reduced water availability causes shrinking of xylem vessels and reduced radial growth of trunk (Rostami and Raheini, 2013).
Drought resistant species might be expected to be adapted to large losses of water without loss of turgor, and the leaf cells would be small and thick walled causing low fresh weight/dry weight ratios (Liu and Stutzel, 2002).
Water stress significantly reduced leaves water content of the fully expanded leaves (Table 6). Available high leaves water content under water stress usually has been considered as a good indicator of drought tolerance (Shaw et al., 2002). The results showed significant reduction in leaves water content of both studied fig cultivars under drought stress, which was in accordance to Karimi et al. (2012) and Gholami et al. (2012). Maintaining leaves water content has been reported to play an important role in stress tolerance of Fig (Karimi, et al., 2012).
In addition, Thakur (2004) reported that, under drought stress conditions, cultivars with lesser decline in leaves water content were capable of retaining higher internal water status, which enable the plant to maintain hydration of protoplasm for longer duration
Concerning proline content, it was notable that water stress increased proline accumulation in the leaves of Aboudi cultivar. Karimi et al. (2012) reported a marked increase in proline content in a drought tolerant fig cultivar under water stress. Water stress induces proline accumulation in many plant species by increasing its biosynthesis and/or inactivation of its degradation (Hare et al., 1999). Proline as an osmoregulator, or as an osmo-protector may help plant tolerate water stress (Ozden et al., 2009). Turkan et al. (2005) and Verslues et al. (2006) showed that proline acts as a cell membrane stabilizer and may protect cells against oxidative stress during dehydration.
5.
CONCLUSION
of peroxidase. On the other hand, parameters that confirmed the sensitivity such like leaf free amino acid and prolin content in leaf recorded the highest values in the cultivar Aboudi. Finally, it’s concluded that, the cultivar Gizy is tolerant to drought stress comparing to the cultivar Aboudi.
6.
REFERENCES
[1] Ambreen, S., K. Rehman, MA Zia and F. Habib. (2000).Kinetic studies and partial purification of peroxidase in soybean. Pak. J. Agric. Sci. 37(3-4):119-122.
[2] Bacelar, E.A.; D.L. Santos; J.M. Moutinho-Pereira; J.I. Lopes; B.C. Goncalves; T.C. Ferreira and C.M. Correia (2007). Physiological behaviour, oxidative damage and antioxidative protection of olive trees grown under different irrigation regimes. Plant Soil, 292: 1-12.
[3] Chaitanya, K.V., Jutur, P.P., Sundar, D., Ramachandra Reddy, A.,(2003). Water stress effects on photosynthesis in different mulberry cultivars. Plant Growth Regul. 40, 75–80.
[4] Doorenbos, J. and Kassam, A. H. (1979). Yield response to water. FAO Irrig. and Drain. Paper No. 33, FAO, Rome, Italy, pp: 193.
[5] Fernndez, J.A., Balenzategui, L., Ba˜n َ n, S., Franco, J.A., (2006). Induction of drought tolerance by
paclobutrazol and irrigation deficit in Phillyrea angustifolia during the nursery period. Sci. Hortic. 107, 277– 283.
[6] Gholami M, Rahemi M, and Rastegar S (2012). Use of rapid screening methods for detecting drought tolerant cultivars of fig (Ficus carica L.). Sci Hortic 143:7–14.
[7] Gholami M, Rahemi M, and Rastegar S (2012). Use of rapid screening methods for detecting drought tolerant cultivars of fig (Ficus carica L.). Sci Hortic 143:7–14.
[8] Gomez, K.A. and A.A. Gomez (1984). Statistical procedures for agricultural research. 2 nd Ed. John Wiley and Sons. New York.
[9] Halim RA, Buxton DR, Hattendorf MJ, and Carlson RE (1989). Water stress effect on alfalfa forage quality after adjustment for maturity differences. Agron J 81:189-194.
[10] Hallac Turk F, and Aksoy U (2011). Comparison of organic, biodynamic and conventional fig farms under
rain-fed conditions in Turkey. Cell Plant Sci 2(3): 22-33.
[11] Hare PD, Cress WA, and Van Staden J (1999). Proline synthesis and degradation: a model system for
elucidating stress-related signal transduction. J Exp Bot 50:413-434.
[12] Hernández, F.B.T., M.A. Suzuki; S. Buzetti and L.S. Correa (1994). Response of fig tree orchard (Ficus carica
L.) under irrigation and nitrogen levels at the Ilha Solteira (SP) region. Sci. Agric., Piracicaba, 51 (1): 99-104.
[13] Hernández, F.B.T., Susuki, M.A., Frizzone, J.A., Tarsitano, M.A.A., Pereira, G.T. y Correa, L. de S. (1996).
Funcao de resposta da figueira à aplicacao de doses de nitrogênio e laminas de água. Eng Agricola, 16 (2): 22-30.
[14] Jung, S., (2004). Variation in antioxidant metabolism of young and mature leaves of Arabidopsis thaliana
[15] Kamel, M. Y. and Ghazy, A. M. (1973): Peroxidase of Cyanara scolymus (global artichoke) leaves: Purification and properties. Acta Biol. Med. Germ. 31:39.
[16] Karimi S, Hojati S, Eshghi S, Nazari-Moghadam R, and Jandoust S (2012). Magnetic exposure improves
tolerance of fig ‘Sabz’ explants to drought stress induced in vitro. Sci Hortic 137:95-99.
[17] Keller, J. and D. Karmeli (1975). Trickle Design. Rain Bird Sp. Man Glendora,CA, U.S.A.
[18] Laemmli, U. K. (1970): Cleavage of structural proteins during the assembly of the head of bacteriophage T4.
Nature. 227: 680 – 685.
[19] Li, L., J. Van Staden and A.K. Jäger, (1998). Effects of plant growth regulators on the antioxidant system in
seedlings of two maize cultivars subjected to water stress. Plant Growth Regulation, 25: 81-87.
[20] Liu, F., Stutzel, H., (2002). Leaf water relations of vegetable amaranth (Amaranthus spp.) in response to soil
drying. Eur. J. Agron. 16, 137–150.
[21] Rostami, A.A. and Rahemi, M. (2013). Response of Caprifig genotypes to water stress and recovery. J. BIOL.
ENVIRON. SCI., 7(21): 131-139.
[22] López-Moreno, J.I., T.M. Hess and S.M. White, (2009). Estimation of reference evapotranspiration in a
mountainous Mediterranean site using the Penman-Monteith equation with limited meteorological data. Pirineos, 164: 7-31.
[23] Manivannan P, Jaleel CA, Kishorekumar A, Sankar B, Somasundaram R, Sridharan R, and Panneerselvam R
(2007). Changes in antioxidant metabolism of Vigna unguiculata L. Walp. by propiconazole under water deficit stress. Colloid Surf B: Biointer 57:69-74.
[24] Müller, M., Hern ndez, I., Alegre, L., Munné-Bosch, S., (2006). Enhanced tocopherol quinone levels and
xanthophyll cycle de-epoxidation in rosemary plants exposed to water deficit during a Mediterranean winter. J. Plant Physiol. 163,601–606.
[25] Ozden M, Demirel U, and Kahraman A (2009). Effects of proline on antioxidant system in leaves of grapevine
(Vitis vinifera L.) exposed to oxidative stress by H2O2. Sci Hort 119:163–168.
[26] Radwan, M.S. (1973). Leaf area estimation in berseem clover. Yugoslavian J. For Agric. XXI (1): 53-56.
[27] Rucker KS, Kvien CK, Holbrook CC, and Hook JE (1995). Identification of peanut genotypes with improved
drought avoidance traits. Peanut Sci 24:14-18.
[28] Scandalios, J.G., (1993). Oxygen stress and superoxide dismutases. Plant Physiol., 101: 7-12.
[29] Sharp RE (1996). Regulation of plant growth responses to low soil water potential. Hortic Sci 31(1): 36–38.
[30] Shaw B, Thomas Th, and Cooke Dt (2002). Responses of sugar beet (Beta vulgaris L.) to drought and nutrient
deficiency stress. Plant Growth Regul 37:77–83.
[31] Smith, I. (1969): Acrylamide gel disc electrophoresis. Electrophoretic techniques (Edited by Smith, I.)
Academic press, New York, pp. 365 – 515.
[33] Sofo, A.; S. Manfreda; B. Dichio1, M. Fiorentino and C. Xiloyannis1 (2007). The olive tree: a paradigm for drought tolerance in Mediterranean climates. Hydrol. Earth Syst. Sci. Discuss., 4: 2811-2835.
[34] Thakur, A., (2004). Use of easy and less expensive methodology to rapidly screen fruit crops for drought
tolerance. Acta Hortic. 662, 231–235.
[35] Turkan I, Bor M, Ozademir F, and Koca H (2005). Differential responses of lipid per-oxidation and antioxidants
in the leaves of drought-tolerant P. acutifolius Gray and drought-sensitive P. vulgaris L. subjected to polyethylene glycol mediated water stress. Plant Sci 168:223–231.
[36] Vermeiren, I. and J. A. Jobling (1980). Localized irrigation: design, installation, operation, evaluation. FAO
Irrigation and Drainage, paper 36. Food and Agriculture Organization of the United Nations, Rome.
[37] Verslues PE, Agaraal M, Katiyar-Agaraal S, Zhu J, and Zhu JK (2006). Methods and concepts in quantifying
resistance to drought salt and freezing, abiotic stressed that affect plant water status. Plant J 45:523–539.
[38] Weber, K. and Osborn, M. (1969): The reliability of molecular weight determinations by dodecyl
sulfate-polyacrylamide gel electrophoresis. J. Biol. Chem. 244: 4406 –4412.
[39] Yu-Hua, M.; M. Feng-Wang; W. Yong-Hong and Z. Jun-Ke (2011). The responses of the enzymes related with
ascorbate-glutathione cycle during drought stress in apple leaves. Acta Physiol. Plant., 33(1):173-180.
[40] Zia, MA (2002). Standardization of conditions for glucose estimation using indigenously purified enzymes.