ISSN: 2278-3369
International Journal of Advances in Management and Economics
Available online at: www.managementjournal.info
RESEARCH ARTICLE
Executive Compensation and Real Earnings Management:
Perspective of Managerial Power
Xu Yan-Jun, Chang Yan-Xin
*International Business School,Jinan University, Qianshan, Zhuhai, Guangdong , China.
*Corresponding Author: Chang Yan-Xin
Abstract
From the perspective of managerial power, this paper uses the A-share listed companies from Shanghai and Shenzhen Stock Exchange as samples, during 2011 to 2015, and establishes the multiple regression model to test the relationship between executive compensation and real earnings management. The results show that there is a significant negative correlation between the monetary compensation and real earnings management; while the equity incentive for executives is positively correlated with the real earnings management, generally shows the opportunistic tendencies of executives; after introducing the variable of managerial power, the management power will weaken the negative correlation between monetary compensation and real earnings management, but it will not change the positive correlation between equity incentive and real earnings management.
Keywords:Real earnings management, Monetary compensation, Equity incentive, Managerial power.
Introduction
Earnings management has always been one of the hot issues in corporate governance and accounting research in China. Healy and
Wahlen [1] argued that earnings
management is the behavior of management to change the financial report by means of accounting methods or designing the real transactions; it will mislead the outside
shareholder or influence contractual
outcomes that depend on reported accounting practices. Earnings management is divided into accrual earnings management and real earnings management, the accrual earnings management is the choice of the company’s administration to whitewash or cover up the
company’s operating performance via
accounting estimates and methods without breaking the accounting rules; real earnings
management is defined as the actions managers take, while deviating from normal business practices, to meet certain earnings thresholds.
In the modern enterprise system, the separation of ownership and control rights is the typical characteristic of the corporation. The salary incentive mechanism is an important measure to ease principal-agent problem which caused by the separation of ownership and management rights, but it also causes the opportunistic behavior of some executives, that is, executives will take the behavior of earnings management to obtain more payments. The relationship
between executive compensation and
executive compensation was set on the basis of accounting earnings, executives would prefer to select more profitable accounting policies in order to improve the present value of their personal compensation. Then, many Chinese scholars have explored the relationship between executive compensation and earnings management; however, most of these studies were aimed at accrued earnings management. After the implementation of the SOX Act in 2002, the risk of accrued
earnings management was gradually
increased with the increasingly strict regulations, so many executives switched their attention to real earnings management which had stronger disguise.
Roy Chowdhury [3] pointed out that companies use multiple real earnings management tools, such as temporary price
discounts, reduction in discretionary
expenses, and overproduction, to avoid reporting losses, and on this basis he proposed the method to measure the level of real earnings management. A lot of research on the real earnings management has been conducted with the emergence of this method, and the relationship between executive
compensation and real earnings
management has attracted great interest of experts.
In China’s listed companies, the relationship between executive compensation and real earnings management is affected by the managerial power. There are two main reasons for this influence. The first one is in the securities markets of China, the disclosure and supervision systems for accounting information of public companies are strictly managed and implemented, and the auditor’s risk awareness is more and more strong. In this context, the listed firm’s earning manipulation has been suppressed, the accounting behavior to control the earnings of executives has changed from the
accrued earnings management to the earnings management based on the real activities which is more subtle and less risk, but the real earnings management will have a negative impact on the company’s
long-term value. The second is
decentralization of shares. It will enhance the substantive rights of management in the corporate power system, which is also reflected in the formulation of salary incentive contracts, executives are more autonomous on the salary incentive mechanism. So that executives can gain more benefits not only by influencing the compensation incentive system directly, but also taking the earnings management behavior indirectly.
In the past, scholars mainly focused on the accrual earnings management when they studied the relationship between executive compensation and earnings management, but few scholars studied the relationship between executive compensation and real earnings management from the managerial power perspective.
On the basis of the research being done by other scholars, this paper tries to examine
the relationship between executive
compensation and real earnings
management from the perspective of managerial power and how managerial power influence the level of the real earnings management based on the incentive of remuneration by taking China’s A-share listed companies as the example.
From different perspective, this paper will complement the existing literature on earnings management, at the same time, it will have guiding significance for the listed companies on how to improve the corporate governance and inhibit the earnings management.
The next section reviews prior literature and
develops the hypotheses. Section 3
introduces the data used in the paper and describes the empirical models and measures. Section 4 presents empirical results and discussion. The final section concludes the study.
Literature Review and Hypotheses
Executive Compensation and Real Earnings Management
The beginning of the research on real earnings management in academia is late and the accrual earnings management has a bigger percentage in previous studies. Katherine Schipper [4] thought that real earnings management refers to the change of the reported earnings through timely financial decisions. Graham [5] surveyed executives and concluded that compared to accruals earnings management, executives prefer to use real earnings management. Roy Chowdhury [3] defined real earnings management as departures from normal
operational practices, motivated by
managers’ desire to mislead at least some stakeholders into believing certain financial reporting goals have been met in the normal course of operations. And he pointed out that
executives carry out real earnings
management to meet reporting goals, which are realized mainly by the methods of temporary price discounts, reduction in discretionary expenses, and overproduction, then he proposed the method to measure the level of real earnings management.
Cohen [6] analyzed the changes of methods of earnings management in listed companies in US after the issuance of the SOX Act, and the results showed that accruals earnings
management activities decreased
significantly, while the real earnings
management activities increased
significantly. Zang [7] found that the accrual earnings management and real earnings management are alternative, due to select
the most appropriate way of earnings management, executives will weigh the implementation risk and implementation cost.
Compensation incentive is the major motivation of management when they manipulate earnings; the beginning of the research of the real earnings management based on the compensation motivation in China is relatively late. Zhang Zhi-hua [8] used the executive compensation to replace the corporate governance structure, and then made an empirical test, the result showed that increased executive compensation could inhibit the real earnings management behavior of executives. Based on the 2007 income tax reform in China, Li Zeng-fu [9]pointed out that the bonus plan of management could induce positive accrual earnings management and real earnings management in listed company. However, Ma Dong-qiang and Zhang Ze-na [10] held the perspective that executive compensation is more likely to induce accrued earnings management, but have a significant negative correlation with real earnings management.
Then, Liu Xin-min [11] conducted empirical studies on the data of companies that are
listed on the Growth Enterprise
Market(GEM) in China and found that the level of real earnings management has significant U-shaped relationship with the pecuniary compensation and non-pecuniary compensation of top management team, that
is pecuniary compensation and
non-pecuniary compensation have two-side effects on real earnings management.
the higher of the intensity of the salary incentive, the more apt executives are to use the method of earnings management to manipulate earnings, but because of salary incentives, the earnings management preference of executives by changing the non-recurring profit and loss can be reduced.
Based on the researches before, most of the scholars’ findings show that there is a negative correlation between the monetary compensation of executives and the degree of real earnings management, but there are still some scholars believed that the influences of monetary compensation on real earnings management have dual characters, it is the consequence of joint contributions of “behalf alignment effect” and “opportunistic effect”.
It is found that the executive pay mainly depends on the company’s annual accounting information by the analysis on the compensation incentive system in China’s listed companies, in other words, the annual accounting information will directly affect the level of executive pay.
Therefore, executives will weigh the risk and benefits caused by earnings management for themselves to determine the extent and the main forms of earnings management. For
executives with lower monetary
compensation, they have a great conflict of interest with company owners, their results of tradeoff between risks and benefits are maximizing their own interests through real earnings management; quite the contrary,
the conflict of interest between
executives ,whose monetary remuneration is higher, and owners is small, in addition, the real earnings management behavior plays the negative role on the company’s future cash flow, and it is not conducive to the long-term development of company, hence, executives with higher monetary salaries could tend to reduce the real earnings
management activities. Based on the arguments cited above and our analysis, we have so the following hypotheses:
H1a: The monetary compensation of executives is negatively related to real earnings management.
Executive compensation is not only reflected in wages, bonuses and other monetary compensation, but also includes equity incentives, non-pecuniary compensation and other non-monetary compensation. In this paper, we take the equity incentive as an example to test the relationship between non-monetary compensation of executives and real earnings management in China’s listed company.
It can be found from the previous literature that the domestic and foreign scholars mainly focus on the relationship between the equity incentive and accrued earnings management. By comparing gains of executives before and after exercising stock options, Bartov [14] found that earnings management can affect the share price movements, so that executives will enforce earnings management to improve their cash return. Warfield TD [15]pointed out that managerial equity incentives create major incentive effects which leading to an increase in earnings management behavior.
earnings management. With the increase of real earnings management activities, the research on the relationship between equity incentive and real earnings management has gradually increased, but the results of these studies are still different, cannot achieve a unified understanding. Zhang Xiao-meng [18] and Ma Chen [19]all considered that the
interests between management and
shareholders will gradually converge with the increase of the stock share, so management may be less willing to manipulate management performance by changing the company’s normal business activities. But Bi Xiao-fang [20] indicated that exercise conditions of equity incentive usually required company’s earnings to meet
the contract requirements, therefore,
profit-driven, executives were likely to manipulate the company’s earnings through self-serving pay and raising the short-term stock prices.
Liu Xin-min [11] explored the impact of different salary incentive forms on real earnings management and found that the equity compensation is positively correlated with the real earnings management, the higher equity compensation, the more real earnings management behaviors. From the perspective of accounting conservatism, Zhou Xiao-su and Chen Chen [21] examined the
influence of executive compensation
incentive on accrued and real earnings management behaviors based on the opportunism effect and the result showed that executive equity-based incentives can effectively restrain the behavior of two types of earnings management at the same time, but the effect on real earnings management is smaller than the accrued earnings management. So based on the above research results, there is no agreed conclusion about the equity incentive will inhibit or enhance the behaviors of real earnings management. As we all know, equity incentive as an efficient incentive mean has been widely
used in China’s listed companies. Equity incentive as part of executive compensation, its’ exercise conditions are generally linked directly to the current corporate profits, and executives may well manipulate performance through earnings management to achieve the right to exercise or to maximize the benefits of the stock. What’s more, with the addition of the rate of ownership, executives will have a greater say in company, because of the power advantages, it is will be much easier for executives to implement more real
earnings management activities by
controlling the sales、production and cost.
Based on the arguments cited above and our analysis, we have so the following hypotheses:
H1b:The equity incentive of executives is
positively related to real earnings
management.
The Impact of Managerial Power on the Real Earnings Management Based on Compensation Motivation
The optimal contract theory assumes that the contract sighed between the executive and the shareholder is the optimal salary incentive scheme based on the maximization of the profit of both parties. However, in practice, the implementation condition is always broken by many external factors, such as the weakness of supervision over
management, the decision-making
intervention of management by virtue of the expansion of power, so that executive compensation incentives cannot solve the agency problem, but become a part of the agency problem.
power as management’s ability and willingness to do something in the direction that they wish, James G.March [26] emphasized the management’s ability to suppress different views in the work, moreover, Bebchuk and Fried [27] argued that managerial power is reflected in the bargaining power when negotiating the fair pay. In the research of the managerial power,Chinese scholar Quan Xiao-feng [28] pointed out that the managerial power is mainly embodied in the deep influence of management beyond its specific control category, showing the expansion of the residual control rights.
In this paper, we compare the concepts given by other famous scholars and demonstrates our own opinion as well, we think that the managerial power is mainly stressed the capacity that management can fulfill their own wishes, and the influence beyond the specific control showed by management in the imperfect corporate governance.
The impacts of managerial power on the earnings management is mainly reflected in two aspects. One is the direct effect of the
power of management on earnings
management behavior, the second one is the
indirect effect by influencing the
contract-making process of executive
compensation. Bebchuk and Frie [27] said that the management may use its own power to intervene the making of compensation contract to obtain contractual terms that are in favor of its own. Chinese scholars Wang Ke-min and Wang Zhi-chao [29] analyzed the data of Chinese listed companies with the LISREL model, and found that executive compensation is significantly positive correlate with earnings management, but after adding the executive control power variables, with the enhancement of managerial power, executive compensation has been improved while the degree of earnings management that induced by compensation motivation has been reduced.
This is mainly because the increase of managerial power is likely to break the power balance between the shareholders, the board of directors and the executive, then the management may use the control power more often to rent-seeking for private interests. Lv Chang-jiang [30] indicated that executives prefer the way of affecting the salary design with their power to directly raise their own pay, and they don’t need the earnings management to achieve the higher salary. Wang Ye [31] also thought the exercise price of the equity incentive and the power of management are moving in opposite directions.
The above-mentioned scholars have
conducted a series of research and discussion on the influence of managerial power on the relationship between accrued earnings management and executive compensation, but have not test whether it will have similar effects on real earnings management. Therefore, based on the managerial power perspective, this paper will verify the impact of managerial power on the relationship between executive compensation and real earnings management.
relationship may be affected. Due to the way of executives to obtain the private interests is more and more , it is no longer confined to the real earnings management to improve the compensation, when the managerial power increases, the negative correlation between the executive monetary compensation and the real earnings management will be weakened.
So, based on the arguments cited above and our analysis, we have so the following hypotheses:
H2a: Managerial power will weaken the negative correlation between executive monetary compensation and real earnings management.
Similarly, with the increase of the managerial power, the management has a stronger say in the process for the establishment of equity incentive, so that it is easy to develop the equity incentive that the exercise condition is more beneficial. This leads executives to abandon the real earnings management activities with high risk and high costs, therefore, the managerial power can indirectly affect the relationship between executive equity incentive and real earnings management. Based on the arguments cited above and our analysis, we have so the following hypotheses:
H2b: Managerial power will weaken the positive correlation between executive equity
incentive and real earnings management.
Data and Methods
Data
We collect our sample from the China’s Shanghai and Shenzhen stock markets for the period 2011-2015, these samples are A-share listed companies. In fact, there are many motivations for executives to implement the earnings management, and this paper focuses on the salary motivation,
so, we screen the sample to avoid the impact of non-remuneration motivation on the research results. First, we restrict our sample to all nonfinancial firms with available data. Further, we eliminate the companies with ST, PT, loss, rights offering and additional share issuing to avoid the impact of the motivation of avoid losses on the real earnings management. Then, we restrict that the sample is not the new listed companies to eliminate the influence of IPO motivation. Finally, we remove companies which data is missing. Imposing all the data-availability requirements yields 8078 firm-year observations over the period 2011-2015, see
Table1. This is the full sample that we use for testing the all hypotheses, and the data all can get from CSMAR database. We mainly use Excel for data collation, Stata for empirical test.
Table1:Samples Volume
Year 2011 2012 2013 2014 2015 Total
Numbers 1503 1729 1751 1630 1465 8078
Real Earnings Management Metric
Following Roy Chowdhury [3]、Cohen [6], we consider the abnormal levels of cash flow from operations, production costs and discretionary expenses to study the level of real activities manipulations.
increased price discounts or more lenient credit terms, such discounts and lenient credit terms will temporarily increase sales volumes. The additional sales will boost current period earnings, assuming the margins are positive. However, both price discounts and more lenient credit terms will result in lower cash flows in the current period. The production control is that managers can increase productions more than the necessary in order to increase earnings.
When managers produce more units, they can spread the fixed overhead costs over a larger number of units, thus lowering fixed costs per unit. As long as the reduction in fixed costs per unit is not offset by any increase in marginal cost per unit, total cost per unit declines, so the firm can report higher operating margins. The expense control is say that decrease in discretionary expenses that including advertising expense, research and development, administration expense, selling expense and so on. Reducing such expenses will boost current period earnings.We first generate the normal levels of cash flow from operations (CFO), production costs and discretionary expenses using the model implemented in Roy Chowdhury [3].
We estimate the normal level of CFO following the model (1), we express normal CFO as a linear function of sales and change in sale, then run the following cross-sectional regression for every industry and year. The residual Ɛitin the model is the abnormal cash flow from operation (Ab CFO), which is the actual CFO minus the normal CFO using the estimated coefficient from Equation (1). The Ab CFO shows that the level of real earnings management by controlling sales, the higher the Ab CFO is mean that managers will adopt the method of more price discounts or more lenient credit terms to manipulate the earnings.
CFOit/Ai,t-1=a0+a1(1/Ai,t-1)+a2(SALESit/Ai,t-1)+a3(ΔSALESit/Ai,t-1)
+Ɛit (1)
Where Ai,t is the total assets at the end of period t in firm i, SALESi,t is the sales in year t and firm i and Δ SALES i,t is the change in sales from year t-1 to t in firm i.
Then, we estimate the normal level of production costs(Prod) using the model (2). The Prodtis the sum of the cost of goods sold in year t and the change in inventory from t-1 to t, in which the cost of goods sold is the linear function of the current sales, the change in inventory is the linear function of sales increment between the current and the lag one phase, then run the flowing cross-sectional regression for every industry and year. The abnormal level of production costs (AbProd) is measured as the estimated residual from Equation (2).The higher the residual, the larger is the mount of inventory overproduction and the greater is the increase in reported earnings through reducing the cost of goods sold. It shows the level of real earnings management by production control.
Prodit/Ai,t-1=a0+a1(1/Ai,t-1)+a2(SALESit/Ai,t-1)+a3(ΔS
ALESit/Ai,t-1)+a4(ΔSALESi,t-1/Ai,t-1)+Ɛit (2)
We estimate the normal level of discretionary expenses (Disx) using the following equation:
Disxit/Ai,t-1=a0+a1(1/Ai,t-1)+a2(SALESi,t-1/Ai,t-1)+Ɛit(3
)
Following the Cohen [32], companies that manage earnings upward are likely to have one or all of these: low cash flow from operations, high production costs ,low discretionary expense. In order to capture the effect of real earnings management through the three methods in comprehensive measure, we use the following equation to reflect the overall level of real earnings management (REM).
REM = -Ab CFO +Ab Prod-Ab Disx (4)
Explanatory Variables Definitions
Executive Compensation
Executive compensation includes executive monetary compensation and equity incentive. The monetary compensation is measured by the logarithm of the total annual salary of the top three executives. Equity incentive, as measured by the proportion of executive shareholdings, is the ratio of the number of executive shareholdings to the total number of shares.
Managerial Power
Managerial power is a comprehensive concept, which reflects the ability of managers to execute their own wills. Learning from Zhang Ze-nan [10], we measure the managerial power with the method of principal component analysis from three aspects: managerial power, executive characteristics and the board governance. These three aspects are represented by the following six variables.
The two level-one of chairman and general manager (Dual): which is a dummy variable equaling 1 if the chairman and general manager are the same person and zero otherwise. This is main because post of chairman and general manager of two-one means that the general manager will have a greater impact and more control in company.
Equity disperse degree (Diso): In the
company, the more dispersed the ownership, the weaker the supervision and restraint of the management, then the power of executives will be strengthened. Hence, we use the radio of the proportion of the first major stockholder to the sum of the proportion of the second to the tenth largest shareholder to measure the degree of equity dispersion, which is a dummy variable equaling 1 if the ratio is smaller than 1 and zero otherwise.
Board size (Bsize): Li Wei-an [33] and Adair Mors [34] found that the larger the size of board, the greater the managerial power. They thought that the larger the size of the board, the communication and coordination between members will be more and more difficult, and the monitoring efficiency will be reduced, so it is easier for the management to control the board, thereby increasing their power .In this paper, we use the total number of the board of director to represent the size of the board.
Managerial Ownership (In cen): When executives own the management control and also have a stake, they have a greater say and influence in company. So the variable of managerial ownership will equal to 1 when executives have a stake, otherwise equal to 0.
Independent director (Outdir): As we all known, independent directors are able to supervise the management, so if the proportion of the independent directors in the board of directors is high, the independence of the board of director can be strengthened and the board can play a good supervisory role, the managerial power becomes smaller. We use the number of independent directors to measure the variable of independent director.
independent directors may have a better and more comprehensive understanding about the specific situation, so they can play a supervisory role well and can exert some kind of check and balance of managerial power, hence, the variable of Location consistency will equal to 1 when the location of the listed company is not consistent with the workplace of the independent directors, otherwise equal to 0.
Finally, we use the principle components analysis method to reduce the dimensionality of the managerial power, we integrate the above six variables into the variable “Power”, the higher the value of “Power”, the greater the managerial power.
Control Variables
Consistent with other studies, we control for factors which have previously shown to influence a firm’s executive compensation, managerial power and the real earnings management. Specifically, we include company size (Size), financial leverage (Lev), return on assets (ROA), enterprises growth (Growth).Further, we run the cross-sectional regression for every industry and year to examine the hypotheses, so we also control for the variables of industry (Industry) and year(Year), which are dummy variables. Table 2 shows the definitions of all variables used in our analysis.
Table 2: Variables Definition
Variable name Variable description
Executives
compensation
Monetary compensation ( Salary) The natural logarithm of the total annual salary of the top three executives.
Equity incentive (Ownership) The proportion of executive shareholdings.
Managerial power
(1)The two level-one of chairman and general manage(Dual)
This is a dummy variable equaling 1 if the chairman and general
manager are the same person and zero otherwise.
(2)Equity disperse degree(Diso)
This is a dummy variable equaling 1 if the ratio of the proportion of the first major stockholder to the sum of the proportion of the
second to the tenth largest shareholder is smaller than 1 and zero otherwise.
(3)Board size(Bsize) The total number of the board of director
(4)Managerial Ownership(Incen) This is a dummy variable equaling 1 if executives have a stake,
zero otherwise.
(5)Independent director(Outdir) The number of independent directors in the board of directors.
(6)Location consistency(Site)
This is a dummy variable equaling 1 if the location of the listed
company is not consistent with the workplace of the independent directors, zero otherwise.
Power
We integrate the above six variables into the variable “Power”
using the principle components analysis method.
Real earnings
management (REM)
The abnormal cash flow from operation (AbCFO)
The estimated residual from Equation (1)
The abnormal level of production costs
( AbProd)
The estimated residual from Equation (2)
The abnormal level of discretionary expenses (AbDisx)
The estimated residual from Equation (3)
The overall level of real earnings
management (REM)
REM=-AbCFO+AbProd-AbDisx
Financial leverage(Lev) The ratio of liabilities to assets.
Return on assets(ROA) A firm’s return on assets drawn from the balance sheet account.
Enterprises growth(Growth) A firm’s revenue growth rate.
Industry Dummy variable
Year Dummy variable
Models
We examine the relationship between the monetary compensation of executives and real earnings management with the following model (5).
REMit=α0+α1Lsalaryit+α2Sizeit+α3Levit+α4ROAit+α5
Growthit+α6∑Yearit+α7∑Industryit+Ɛit (5)
We examine the relationship between the equity incentive of executives and real earnings management using the model (6).
REMit=α0+α1Ownershipit+α2Sizeit+α3Levit+α4ROAi
t+α5Growthit+α6∑Yearit+α7∑Industryit+Ɛit (6)
We examine the influence of managerial power on the relationship between the
monetary compensation of executives and real earnings management with the model (7).
REMit=α0+α1Lsalaryit+α2Powerit+α3Lsalaryit*Pow
erit+α4Sizeit+α5Levit+α6ROAit+α7Growthit+α8∑Year
it+α9∑Industryit+Ɛit (7)
We examine the influence of managerial power on the relationship between the equity incentive of executives and real earnings management with the model (8).
REMit=α0+α1Ownershipit+α2Poweritt+α3Ownershi
pit*Powerit+α4Sizeit+α5Levit+α6ROAit+α7Growthit+
α8∑Yearit+α9∑Industryit+Ɛit (8)
Results and Discussion
Descriptive Statistics
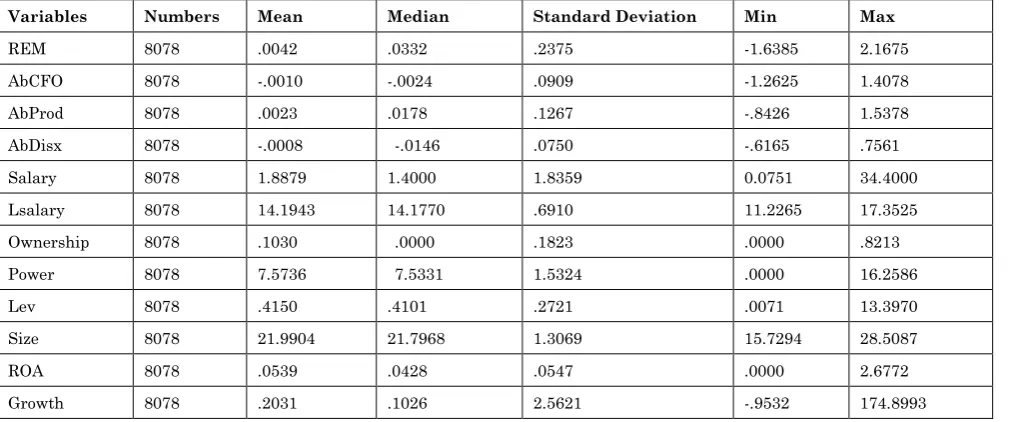
Table 3: Descriptive Statistics
Variables Numbers Mean Median Standard Deviation Min Max
REM 8078 .0042 .0332 .2375 -1.6385 2.1675
AbCFO 8078 -.0010 -.0024 .0909 -1.2625 1.4078
AbProd 8078 .0023 .0178 .1267 -.8426 1.5378
AbDisx 8078 -.0008 -.0146 .0750 -.6165 .7561
Salary 8078 1.8879 1.4000 1.8359 0.0751 34.4000
Lsalary 8078 14.1943 14.1770 .6910 11.2265 17.3525
Ownership 8078 .1030 .0000 .1823 .0000 .8213
Power 8078 7.5736 7.5331 1.5324 .0000 16.2586
Lev 8078 .4150 .4101 .2721 .0071 13.3970
Size 8078 21.9904 21.7968 1.3069 15.7294 28.5087
ROA 8078 .0539 .0428 .0547 .0000 2.6772
Growth 8078 .2031 .1026 2.5621 -.9532 174.8993
Note: The unit of “Salary” is millionyuan, The variables are defined in Table 2.
Table 2 provides summary statistics of the full samples. A number of interesting observations are worthy of discussion. The standard deviations of real earnings management(REM), abnormal cash flow (AbCFO), abnormal production
and median of abnormal production cost (Ab Prod) are positive values, while the mean and median of abnormal cash flow(Ab CFO) and abnormal discretionary expenses (Ab Disx) are close to zero and negative values. These indicate that in Chinese listed companies, executives prefer to implement the real earnings management with the method of production control rather than sales control and cost control.
The standard deviation, minimum and maximum value of salary are 1.8259 million,
0.0751million and 34.4000million,
respectively, demonstrating that there is a huge gap on the executives monetary compensation between the listed companies and the compensation incentive mechanism is still imperfect.
The mean of Ownership is 10.30%, while the maximum value is up to 82.13%. However, the proportion of the Chinese listed companies that executive with zero holding is up to 47%. From these data, we can find that the proportion of executives shareholding is still low and there are a prominent difference.
In addition, the mean and median of Lev are 0.4150 and 0.4101, which are less than 0.5, indicating that the listed companies tend to take the equity finance as the important follow-up financing step.
The mean of ROA is 0.0539 while the median is 0.0428, which shows that the return on assets of listed companies in China is still very low. Finally, from the table 3, we can see that the mean, median, minimum and maximum of Growth are 0.2031, 0.1028, -0.9532 and 174.8993, respectively, which indicates that the overall growth of listed companies is not good, and there is obvious gap between companies.
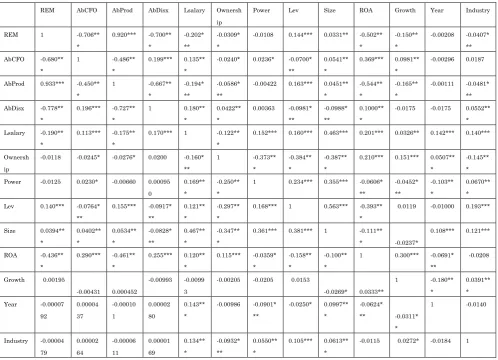
Correlation Analyses
Table 4 reports Pearson and Spearman cross-correlation coefficients of variables.
The REM, Ab CFO, AbProd and Ab Disx show significant correlations between each other, moreover, the REM are significantly negative, positive and negative correlate with Ab CFO, Ab Prod and Ab Disx, respectively, which is consistent with the results of Cohen [32].
The REM is significantly negatively correlated with the L salary, indicating that
the higher the executive monetary
compensation, the lower the level of real earnings management, which is consistent with our assumptions.
However, the REM is negatively correlated with the Ownership, but not significant, and the Ownership is positively correlated with Ab Disx, which is inconsistent with our assumptions and needs to test it further.
There is a significant positive correlation between Power and L salary, it shows that the greater the managerial power, the more likely the abuse, that is , executives are more likely to use their own power to directly interfere the formulation of compensation contract for more money.
But Power has a significant negative correlation with Ownership, suggesting that with the increase of the proportion of executives shareholding, managerial power is not strengthened, but diminished. It might be because the board of directors and independent directors strengthen the control and supervision of executives when executives hold more equity.
Table 4: Cross-correlation Coefficients
REM AbCFO AbProd AbDisx Lsalary Ownersh ip
Power Lev Size ROA Growth Year Industry
REM 1 -0.706**
*
0.920*** -0.700** *
-0.202* **
-0.0309* *
-0.0108 0.144*** 0.0331** -0.502** *
-0.150** *
-0.00208 -0.0407* ** AbCFO -0.680**
*
1 -0.486**
*
0.199*** 0.135** *
-0.0240* 0.0236* -0.0700* **
0.0541** *
0.369*** 0.0981** *
-0.00296 0.0187
AbProd 0.933*** -0.450** *
1 -0.667**
*
-0.194* **
-0.0586* **
-0.00422 0.163*** 0.0451** *
-0.544** *
-0.165** *
-0.00111 -0.0481* ** AbDisx -0.778**
*
0.196*** -0.727** *
1 0.180**
*
0.0422** *
0.00363 -0.0981* **
-0.0988* **
0.1000** *
-0.0175 -0.0175 0.0552** * Lsalary -0.190**
*
0.113*** -0.175** *
0.170*** 1 -0.122** *
0.152*** 0.160*** 0.463*** 0.201*** 0.0326** 0.142*** 0.140***
Ownersh ip
-0.0118 -0.0245* -0.0276* 0.0200 -0.160* **
1 -0.373**
*
-0.384** *
-0.387** *
0.210*** 0.151*** 0.0507** *
-0.145** * Power -0.0125 0.0230* -0.00660 0.00095
0
0.169** *
-0.250** *
1 0.234*** 0.355*** -0.0606* ** -0.0452* ** -0.103** * 0.0670** * Lev 0.140*** -0.0764*
**
0.155*** -0.0917* **
0.121** *
-0.297** *
0.168*** 1 0.563*** -0.393** *
0.0119 -0.01000 0.193***
Size 0.0394** * 0.0402** * 0.0534** * -0.0828* ** 0.467** * -0.347** *
0.361*** 0.381*** 1 -0.111**
* -0.0237*
0.108*** 0.121***
ROA -0.436** *
0.290*** -0.461** *
0.255*** 0.120** *
0.115*** -0.0359* *
-0.158** *
-0.100** *
1 0.300*** -0.0691* **
-0.0208
Growth 0.00195
-0.00431 0.000452
-0.00993 -0.0099 3
-0.00205 -0.0205 0.0153
-0.0269* 0.0333**
1 -0.180**
*
0.0391** * Year -0.00007
92 0.00004 37 -0.00010 1 0.00002 80 0.143** *
-0.00986 -0.0901* **
-0.0250* 0.0997** *
-0.0624*
** -0.0311* *
1 -0.0140
Industry -0.00004 79 0.00002 64 -0.00006 11 0.00001 69 0.134** * -0.0932* ** 0.0550** *
0.105*** 0.0613** *
-0.0115 0.0272* -0.0184 1
Note: this table presents Spearman (above diagonal) / Pearson (below diagonal) correlation matrix for the main variables. ***, ** and * indicate
significance at the 1%, 5% and 10% levels. The variables are defined in Table 2.
Table 5: Variance Inflation Factor
Variables Tolerance Variance inflation factor
Lsalary 0.707642 1.41
Ownership 0.796121 1.26
Power 0.815146 1.23
Lev 0.757858 1.32
Size 0.538097 1.86
ROA 0.917850 1.09
Growth 0.989112 1.01
Regression Analysis Executive’s compensation and real earnings
management
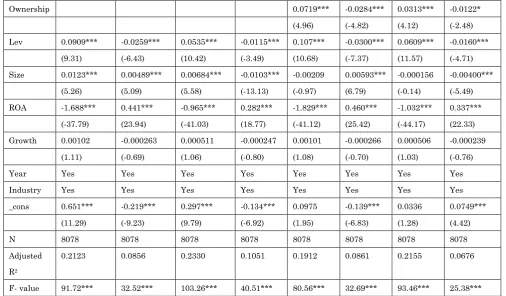
Table 6: Regression results of executive compensation and real earnings management
e (1) (2) (3) (4) (5) (6) (7) (8)
REM AbCFO AbProd AbDisx REM AbCFO AbProd AbDisx
Lsalary -0.0626*** 0.00733*** -0.0301*** 0.0252***
Ownership 0.0719*** -0.0284*** 0.0313*** -0.0122*
(4.96) (-4.82) (4.12) (-2.48)
Lev 0.0909*** -0.0259*** 0.0535*** -0.0115*** 0.107*** -0.0300*** 0.0609*** -0.0160***
(9.31) (-6.43) (10.42) (-3.49) (10.68) (-7.37) (11.57) (-4.71)
Size 0.0123*** 0.00489*** 0.00684*** -0.0103*** -0.00209 0.00593*** -0.000156 -0.00400***
(5.26) (5.09) (5.58) (-13.13) (-0.97) (6.79) (-0.14) (-5.49)
ROA -1.688*** 0.441*** -0.965*** 0.282*** -1.829*** 0.460*** -1.032*** 0.337***
(-37.79) (23.94) (-41.03) (18.77) (-41.12) (25.42) (-44.17) (22.33)
Growth 0.00102 -0.000263 0.000511 -0.000247 0.00101 -0.000266 0.000506 -0.000239
(1.11) (-0.69) (1.06) (-0.80) (1.08) (-0.70) (1.03) (-0.76)
Year Yes Yes Yes Yes Yes Yes Yes Yes
Industry Yes Yes Yes Yes Yes Yes Yes Yes
_cons 0.651*** -0.219*** 0.297*** -0.134*** 0.0975 -0.139*** 0.0336 0.0749***
(11.29) (-9.23) (9.79) (-6.92) (1.95) (-6.83) (1.28) (4.42)
N 8078 8078 8078 8078 8078 8078 8078 8078
Adjusted
R2
0.2123 0.0856 0.2330 0.1051 0.1912 0.0861 0.2155 0.0676
F- value 91.72*** 32.52*** 103.26*** 40.51*** 80.56*** 32.69*** 93.46*** 25.38***
Note: The t-statistics are in parentheses.***,** and * indicate significance at the 1%, 5% and 10% levels.The variables are defined in
Table 2.
According to the model (5) and (6), we test the relationship between the real earnings
management and the executive
compensation from monetary compensation and equity incentive two aspects. Table 6 shows the regression results. The first four columns show the regression results of executive monetary compensation and real earnings management. When the Lsalary is the independent variable, the REM is the dependent variable, the adjusted R2 is 0.2123, and F-value is significant at the 1% level, so the model overall fit quite well.
From the table 6, we come to the result that the executive monetary compensation is significantly negatively correlated with the real earnings management at 1% level in general, that is, the higher the monetary compensation of executives, the lower the level of real earnings management, therefore, H1a is validated, so it can be argued that when the corporate governance mechanism is
sound, establishing appropriate
compensation incentive mechanism can reduce the opportunistic behavior of executives to manipulate firm performance in order to boost their pay.
The last four columns show the regression results of equity incentive and real earnings management. The results show that in general, the equity incentive is significantly positively correlated with the real earnings management at 1% level and the coefficient is 0.0719, H1b receives good support. The relationship between executive equity incentive and real earnings management is formed under the interaction of the behalf alignment effect and opportunistic effect, so the significant positive correlation between
equity incentive and real earnings
real earnings management. From the regression results(6) and (7), it is not hard to see the Ownership is negatively correlated at 1% level with Ab CFO, and is significantly positively correlated with Ab Prod, reflecting that the management prefer to use the method of productive control rather than sales control for earnings management under the influence of executives shareholding.
When the explanatory variable is the executive monetary compensation, the company size is significantly positively correlated with real earnings management, which is consistent with the results of Watts and Zimmerman [2], that is, company size is closely related to the political costs, the bigger the company, the more attention the government and outside pay, so in order to avoid the government regulation and oversight caused by high profits, the management is more likely to defer current surplus through the earnings management.
In addition, there is a positively correlated relationship between asset-liability ratio and real earnings management, which is accordance with the debt contract hypothesis.
It means that the closer the company is to breach the debt contract, the more likely it is to move the future earnings to the present.
The ROA is significantly negatively
correlated with the real earnings
management, illustrating that the higher the yield of the company, the less the real earnings management activities, because the high actual earnings mean that it is easy to achieve the company’s business goals, and is unnecessary to use the real earnings management, which can destroy the firm future value, to control the earnings. However, the company’s growth is positively related to the real earnings management,
although the relationship is not significant, we also can find that with the growth of the company, there are more real earnings management activities, one of the reasons may be the rapidly growing company needs a large amount of cash flow to fund the operations. The influence of managerial power on the relationship between executive
compensation and real earnings
management.
Table 7: Regression results of managerial power, executive compensation and real earnings management
(1) (2) (3) (4) (5) (6) (7) (8)
REM AbCFO AbProd AbDisx REM AbCFO AbProd AbDisx
Lsalary -0.0625*** 0.00731**
*
-0.0300*** 0.0252***
(-15.52) (4.39) (-14.16) (18.56)
Power -0.00654**
*
0.00106 -0.00340**
*
0.00208*** -0.00558*
*
0.000308 -0.00309**
*
0.00218***
(-3.86) (1.51) (-3.82) (3.64) (-3.15) (0.43) (-3.32) (3.62)
Lsalary*Power 0.00633** -0.000929 0.00283* -0.00258**
*
(2.93) (-1.04) (2.48) (-3.54)
Ownership 0.0678*** -0.0331*** 0.0278** -0.00694
(4.18) (-5.00) (3.26) (-1.26)
r
(0.32) (-1.86) (-0.03) (1.26)
Lev 0.0927*** -0.0261*** 0.0545*** -0.0121*** 0.107*** -0.0302*** 0.0612*** -0.0161***
(9.50) (-6.49) (10.60) (-3.67) (10.73) (-7.41) (11.63) (-4.75)
Size 0.0145*** 0.00453**
*
0.00802*** -0.0110*** 0.0000998 0.00559**
*
0.00100 -0.00469**
*
(5.98) (4.54) (6.30) (-13.47) (0.04) (6.12) (0.85) (-6.16)
ROA -1.688*** 0.441*** -0.965*** 0.282*** -1.829*** 0.460*** -1.032*** 0.337***
(-37.81) (23.93) (-41.06) (18.76) (-41.16) (25.43) (-44.21) (22.35)
Growth 0.000945 -0.000251 0.000472 -0.000222 0.000946 -0.000254 0.000472 -0.000220
(1.03) (-0.66) (0.98) (-0.72) (1.02) (-0.67) (0.96) (-0.70)
Year Yes Yes Yes Yes Yes Yes Yes Yes
Industry Yes Yes Yes Yes Yes Yes Yes Yes
_cons 0.651*** -0.219*** 0.296*** -0.135*** 0.0923 -0.133*** 0.0320 0.0732***
(11.26) (-9.18) (9.73) (-6.96) (1.83) (-6.51) (1.21) (4.28)
N 8078 8078 8078 8078 8078 8078 8078 8078
Adjusted R2 0.2142 0.0858 0.2346 0.1074 0.1921 0.0863 0.2165 0.0689
F -value 85.66*** 30.14*** 96.22*** 38.37*** 74.88*** 30.35*** 86.82*** 23.98***
Note: The t-statistics are in parentheses.***,** and * indicate significance at the 1%, 5% and 10% levels.The variables are defined in
Table 2.
According to the model (7) and (8), we test the influence of managerial power on the relationship between executive compensation and real earnings management, the Table 7 shows the results. We examine the impact of managerial power on the relationship between executive monetary compensation
and real earnings management by
introducing the variable of “Power” and the interactive item “Lsalary *Power”.
The first four columns in Table 7 show the results. By comparing the results of Table 6 and Table 7, it is found that after introducing the “Power” and “Lsalary *Power” ,the executive monetary compensation is still significantly negatively correlated with real earnings management at 1% level, but the absolute value of coefficient is determined from 0.0626 to 0.0625, and the Power is also significantly negatively correlated with the real earnings management at 1% level, the coefficient of the interactive item is 0.00633, which is significant at the 5% level, so the
interaction effect is significant. Through the calculation, we can find that with the influence of interactive effect, the partial effect of monetary compensation on the real earnings management is changed from -0.0626 to -0.0146, therefore, the managerial power can weaken the negative relationship between monetary compensation and real earnings management, H2a is validated.
The last four columns in Table 7 show the results of the impact of managerial power on the relationship between equity incentive and real earnings management. After introducing the “Power” and the interactive item “Ownership *Power”, we find that the Ownership is still significant at the 1% level, but the interactive item is not significant and the coefficient is 0.00342.
are independent of each other, there isn’t significant interaction effect, so the real earnings management caused by equity incentive does not change by managerial power, that is, managerial power cannot change the significant positive correlation between equity incentives and real earnings management, the H2b has not been tested.
The probably reason for this result may be that though executives are more likely to develop the exercise conditions which are simple to implement, using their power, in fact, in order to get more pay and make the wide spreads , executives still have a strong motivation to manipulate the business performance by implementing the real earnings management. Thus, managerial power cannot change the significant positive
correlation between executive equity
incentives and real earnings management.
Conclusion
In this paper, we contribute to the existing literature on real earnings management by providing a comprehensive study from the perspective of managerial power. We also provide a new way to measure the managerial power.
This paper examines the relationship between the executive compensation and real earnings management from two aspects:
monetary compensation and equity
incentives.
We also examine the influence of managerial power on the relationship between executive
compensation and real earnings
management. Our tests are based on data of 8078 firm-year observations from Chinese listed companies covering 2011 to 2015.
With the empirical research, we find the following results. First, in Chinese listed companies, the monetary compensation of
executives has a significant negative
correlation with the real earnings
management, so if a firm has a sound corporate governance, establishing the perfect compensation incentive system can inhabit the real earnings management behavior in a certain extent, and reduce the negative impact of earnings management on the corporate values. Second, the equity incentive of executives is positively related to real earnings management, which indicates that the behalf alignment effect of equity incentive cannot offset the opportunistic effect. In order to reach the exercise conditions, the management still uses the real earnings management to manipulate earnings.
Thirdly, with the other conditions unchanged, managerial power has an impact on the relationship between executive compensation and real earnings management. On the one hand, managerial power can weaken the negative correlation between executive monetary compensation and real earnings
management. With the increase of
managerial power, executives can take other more direct methods but real earnings management, which is against the company’s future value, to get higher pay. It also reflects that the effects of the compensation incentive system will be declining with the increasing of managerial power. On the other hand, managerial power cannot change the positive
correlation between executive equity
incentive and real earnings management.
Thought executives can develop the more favorable exercise conditions using the high managerial power, they still have strong motivation to control the performance, to affect the stock price and to get more benefits
by implementing the real earnings
management.
References
1 Healy Paul M (1985) The effect of bonus
schemes on accounting decisions.Journal of Accounting and Economics.7:85-107.
2 Watts R, J Zimmerman (1986) Positive
accounting theory.Prentice Hall.
3 Roy Chowdhury S(2006) Earnings management
through real activities manipulation. Journal of Accounting and Economics.42:335-370.
4 Katherine Schipper (1989) Commentary on
earnings management. Accounting
Horizons.3:91- 102.
5 Graham JR, Harvey CR, Rajgopal S (2005) The
economic implications of corporate financial
reporting. Journal of Accounting and
Economics.40:3-73.
6 Cohen DA, Dey A (2008) Real and accrual-based
earnings management in the pre- and post-Sarbanes Oxley period. The Accounting Review.83:757-787.
7 Zang A (2012) Evidence on the tradeoff between
real manipulation and accrual manipulation. The Accounting Review.87:675 -703.
8 Zhang Zhi-hua, Jin Lian-Hua (2010) An
empirical study on corporate governance and real earnings management. Communication of Finance and Accounting.12:71-74.
9 Li Zeng-fu, Dong Zhi-Qiang, Lian Yu-Jun (2011)
Accrual earnings management or real earnings management?--Based on the research of income tax reform in 2007 in China. Management World.1:121-134.
10 Zhang Ze-nan (2014) Research on managerial
power, executive compensation and earnings management---also on the effect of “Salary Limit Order”. Southwestern University of Finance and Economics.
11 Liu Xin-min, Zhang Ying, Wang Lei (2014) A
study on the influence of executive
compensation incentive on the real earnings
management. Journal of Audit &
Economics.4:61-70.
12 Yuan Zhi-zhu, Hao Wen-han (2014) An
empirical study on the impact of managerial incentives on accrual and real earnings
management. Management Review.10:181-196.
13 Lu Jun-wei, Han Fei, Shi Xi (2015) Executive
compensation incentive, management stock
position and earnings management
preferences--A panoramic view of investigation of methods of earnings management. Journal of
Shanxi University of Finance and
Economics.11:89-103.
14 Hou Xiao-hong, Li Meng-xue (2011) A research
review of management salary motivation and real earnings management. Communication of Finance and Accounting.7:117-120.
15 Cheng Q, Warfield T D (2005) Equity incentives
and earning management. The Accounting Review.80:441-476.
16 Shrieves Ronald E, Gao Peng-Jie (2002)
Earnings management and executive
compensation: A case of overdose of option and under dose of salary? EFA 2002 Berlin Meetings Presented Paper.
17 Li Jing-chun, Li Ping (2009) A research on
earnings management based on the
management equity incentive of listed companies. China Economist.11:80-81.
18 Zhang X, Bartol KM, Smith K G et al (2008)
CEOs on the edge: earnings manipulation and stock-based incentive misalignment. Academy of Management Journal.51:241-258.
19 Ma Chen, Zhang Jun-rui (2012) Top
management shareholding, leadership
structure and financial restatements. Nankai Business Review.15:143-150,160.
20 Bi Xiao-Fang, Han Chuan-Mo (2012) A study on
the relationship between equity incentive compensation contract and earnings quality. Journal of Audit & Economics.27:75-82.
21 Zhou Xiao-Su, Chen Chen, Wang Lei (2016)
Executives salary incentive and earnings management --empirical evidence from the perspective of accounting conservatism.2:88 - 99.
22 Bebchuk L, Fried J, Walker D (2002)
University of Chicago Law Review.69:751-864.
23 Bebchuk L, Fried J (2003) Executive
compensation as an agency problem. Journal of Economic Perspectives.17:71-92.
24 Bebchuk L, Fried J (2004) Pay without
performance: The unfulfilled promise of executive compensation. Boalt Working Papers in Public Law, Boalt Hall, UC Berkeley.
25 Rabe WF (1962) Managerial power. California
Management Review.4:31-39.
26 March JG (1966) Power of power, in D. Eston
(ed), varieties of political theory. Prentice Hall Press.
27 BebchukL Fried J (2005) Pay without
performance: Overview of the issues. Journal of Applied Corporate Finance.17:8-23.
28 Quan Xiao-Feng, Wu Shi-Nong, Wen Fang
(2010) Managerial power, private benefits and compensation manipulation. Economic research journal.11:73-87.
29 Wang Ke-Min, Wang Zhi-Chao (2007) Executive
control, remuneration and earnings
management --An empirical study based on
Chinese listed companies. Management
World.7:111-119.
30 Lv Chang-Jiang, Zheng Hui-lian, Yan
Ming-Zhu, Xu Jing-Jing (2009) The equity incentive system of listed companies: is the
incentive or welfare? Management
World.9:133-147.
31 Wang Ye, Ye Ling, Sheng Ming-Quan (2012)
Managerial power, opportunistic motivation and equity incentive scheme design.Accounting Research.10:35-41,95.
32 Cohen DA, Zarowin P (2010) Accrual-based and
real earning management activities around seasoned equity offering.Journal of Accounting and Economics.50:2-19.
33 Li Wei-An, Liu Xu-Guang, Chen Jing-Han
(2013) Manager ability, corporate governance and contract reference point: A theoretical and empirical analysis of determinants of executives compensation in Chinese-listed companies. Nankai Business Review.13:4-15.
34 Morse A, Nanda V, Seru A (2011) Are incentive