Journal of Electrical Engineering,
Electronics, Control and Computer Science
JEEECCS, Volume 2, Issue 5, pages 15-20, 2016
Intelligent Device for Measuring the Heart Rate
Alexandru-Daniel MORMAN, Alexandru-Ionuţ ROZALIU
“Valahia” University of Târgoviște Faculty of Electrical Engineering, Electronics and
Information Technology Târgoviște, Romania [email protected] [email protected]
Abstract – This paper proposes a technique of measuring the heart rate using a red laser beam and a photoresistor to measure the amount of light that passes through a translucent area of the human body. The light absorption in the area is related to the level of oxygen in the blood and so the photoresistor detects the blood flow through the area. The signal output of the sensor is filtered, amplified and then transmitted to a computer by means of an electronic board Arduino Uno to calculate the heart rate. With this technique, a low cost heart measuring device was built.
Keywords: heart rate, Arduino Uno, pulse meter, intelligent device, digital signal processing, software
I. INTRODUCTION
The heart rate frequency, the deficiencies noticed by its interpretation and many other physiological data are easily viewed using one or more catheters connected to a pressure transducer and equipment for viewing signals such as, for example, an oscilloscope. The method was commonly used in intensive care since the 1970s.
The heart rate, which is perceived by feeling a superficial pressure zone and is synchronous with the ventricular systole, is the pulse. It arises from the convergence of blood pushed during the systole and the blood existing in the arterial system. The signal that appears is externalized through rhythmic expansion of the artery, the so-called "pulse wave". The resting heart rate is 60-80 beats per minute (bpm).
For many years, both health professionals and athletes coaches have recognized that the pulse rate for a person is a primary source of information on the current status and long-term status of their physiology. Knowing the frequency is the first step of the beginning of an examination and is a parameter that is measured regularly for a regular diagnosis and regular care [1].
BPM for young people up to 18 years is in the range of 72-103, and for adults between the ages of 18-61 years is in the range of 55-77 [2].
A typical Heart Rate Monitor uses a pair of light-emitting diodes, which act on a photodiode through a
part of the body of a patient. One LED is red with a wavelength of 660 nm, and the other is in the infrared with a wavelength of 940 nm. The absorption of light at these wavelengths differs significantly between the oxygenated blood and deoxygenated blood returning to the heart. The wavelength differences in the capillaries due to the blood fluctuation influence the properties of the photodiode [3]. Our research describes a method for measuring the heart rate through a finger, using a laser beam and a photoresistor. Because the signal is very small, it must be processed. This process of processing is done using an operational amplifier and a series of filters to reduce noise and improve the useful signal.
The advantage of this configuration is that the number of electronic components is low, but the capturing unit has to be firm, and the wiring as short as possible, otherwise the data collected will have errors.
We will further present the practical implementation of the intelligent device for measuring the heart rate, the components, operating mode, experimental results, conclusions and perspectives.
II. PLANNING AND IMPLEMENTATION OF THE DEVICE
In order to build the inteligent device to measure the heart rate, we used an integrated circuit which consists of two operational amplifiers LM358N, a photoresistor, a laser, eight resistors, two ceramic capacitors, a BC171 NPN transistor, two electrolytic capacitors, one LED and one electronic board, namely an Arduino UNO R3 electronic board (Figure 1).
We used the LM358N integrated circuit because it works in a wide voltage range (3V - 32V), does not require negative power supply and we have two operational amplifiers in the capsule, reducing the needed space. The amplifiers IC1A and IC1B are in the differentiator configuration, and so their voltage output is proportional with the rate of change with respect to time of the input voltage.
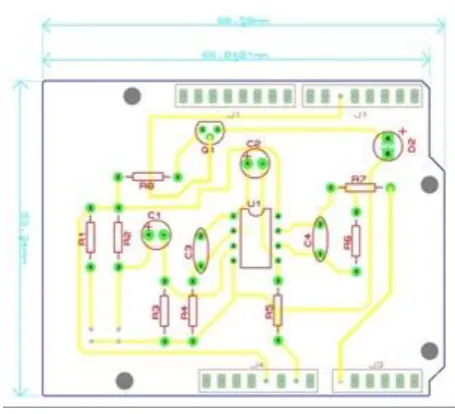
The resistors are designed to adjust the circuit's voltage or to filter the signal together with the capacitors. To aquire the data we used an Arduino Uno electronic board, whose role is to convert the signal from analog to digital and transmit this signal to a computer. The LED commanded by transistor is syncronised with the heart rate. In Figure 2 is represented the PCB circuit.
In the block diagram in Figure 3, is explained the working process for the project. The initial signal is read by the sensor, is processed, is converted from analog to
digital, then it is sent to the PC and finally it is plotted by a program written in C #.
From Fig. 3, we observe that application does not offer offer the possibility to control the system as in others control systems [5-6]. The application has role of data acquisition and visualization. The captured signal (Figure 4) is modeled using the IC1A amplifier, which together with the C1 capacitor forms the differentiator configuration. The C3 capacitor together with the R4 resistor forms a low-pass filter due to the fact that the value of the C3 capacitor is smaller. The configuration of the IC1B amplifier with the C2 capacitor also forms a differentiator followed by a low-pass filter consisting of the C4 capacitor and the R6 resistor, and finally the Arduino Uno R3 board is used to convert the processed signal, from analog to digital and to make the data acquisition which will be transmitted to a computer for processing, by using an application written in the C# programming language, application whose role is to calculate and display the bpm.
The modeling steps and the variations of the signal can be seen in Figure 4.
Figure 3. Block diagram for the intelligent device for measuring the heart rate.
Figure 2. Circuit board for the intelligent device for measuring the heart rate
III. DIGITAL SIGNAL PROCESSING
The Arduino board achieves the conversion to digital through the sampling and quantization of the analog signal. The sampling is performed at an interval of 5ms, the quantization is performed on 10 bit and the values sent to the computer are in the range of 0 - 5V. [7-8] The application returns the heart rate by averaging two consecutive periods reported at a time equal to one minute. [9]
The product of the distance between two peaks and the interval of the acquisition represents a cardiac period. The average of two consecutive periods decreases the danger of acquisition errors. Also, to reduce errors, certain conditions were introduced. One of these conditions is the existance of the first peak and the second condition is that the difference between the periods in between the considered peaks for the bpm's display, to be less than 100. If the above conditions are not fulfilled, then it has been an acquisition error and a new set of data is expected.
The form of one of the computation equations is:
, 2
|) | |
(|v1 v2 v2 v3
p
100 | | | | 0 3 2 2 1 1 v v v v
v
τ is the sampling interval;
v1,v2,v3 are the positions of the first three consecutive peaks in the vector data;
|v1-v2| respectively |v2-v3| - is the interval between two peaks.
The equation to determine the beats per minute is:
p
bpm
60000
/
60000ms = 60s= 1 minute.
The time interval, to realize one of the measurements is 3 seconds. In this time interval 600 samples are evaluated to estimate the number of beats per minute. This 5 milliseconds period is sufficient for the detection of any cardiac frequency from the table described in the article [2].
IV. EXPERIMENTAL DATA
In this chapter we present three experiments, namely:
Measurement of heart rate for one subject.
Comparison with an approved device.
Signal differentiation for a person without special conditions and a person with heart problems.
A. Measuring the heart rate
For this experiment, the acquired data was displayed simultaneously on the application made and on an oscilloscope. The results were very good and they can be seen in Figure 6.
The application renders, as a result, 72 bpm, hence the correct interpretation of the signal.
B. The comparison with an approved device
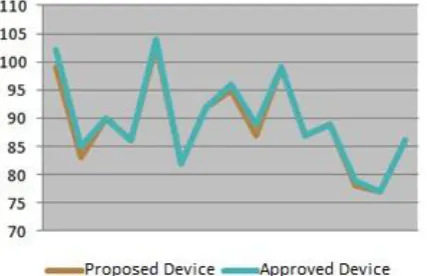
To validate the results, we tested the device on 15 subjects of different ages
As can be seen in Figure 7, the proposed device has an error of ± 2%, compared to an approved one.
Given the fact that the heart rate may vary slightly between two consecutive measurements the difference between the presented devices and the approved device is negligible.
Figure 6. Comparison between the displayed signal on the application and on an oscilloscope
Figure 4. The modeling steps of the signal.
C. Measurement under special conditions
In the third experiment, we used the device to measure the heart rate of a person with tachycardia and of a healthy one.
As can be seen in Figures 8 and 9, the device detects the difference between different rhythms of the heart.
V. PROTOTYPE
The current design of the device was used only for data acquiring purposes.
The prototype is shown in Figure 10.
VI. POSSIBLE DEVELOPMENT
In our research, we tried to use a reduced number of components for a possible future miniaturization, the desired shape and size would be similar to a ring. [10]
Right now the device is just a prototype, but a possible development is the miniaturization and remote data transmission which will enable continuous monitoring of the heart rate and also alerting the emergency services in case of accidents.
The reliability and quality of electronic components [11] and circuit stability [12] must be considered to reduce the possibility of gross errors.
VII. CONCLUSIONS
We obtained a pulsemeter with an accuracy of 97% and with a reduced number of electronic components.
With the help of this application we can differentiate between people with a normal heart rhythm and people with heart problems.
The signal noise was reduced by more than 20% with the use of different filter configurations, and by the fact that the values of the capacitors used had a tolerance of ±1%.
ACKNOWLEDGMENTS
The authors express their gratitude to the personnel from the Multidisciplinary Institute of Scientific and Technology Research of "Valahia" University for their assistance with the PCB and its inspection.
Figure 9. Signal representation on an oscilloscope (healthy person)
Figure 8. Signal representation on an oscilloscope (person with tachycardia)
Figure 7. Results of the comparison between the device proposed and the approved one.
To Ţică Cristian Grigore, student at "Valahia" University, Faculty of Electrical Engineering, Electronics and Information Technology for his help in testing the circuit.
To Mr. Eng. Ionita Marius-Georgian PhD Student, of the Multidisciplinary Institute of Scientific and Technology Research of "Valahia" University, and Mrs. Assoc. Prof.
REFERENCES
[1]Frank B. Cramer, 14800 Alexander St., Mission Hills, Calif. 91345; J. Lawrence Semar, 17422 Village Dr.,Tustin, Calif.
92680 WRIST BORNE PULSE
METER/CHRONOMETER
[2]Can Wu, MS; Amir R. Honarmand, MD; Susanne Schnell, PhD; Ryan Kuhn, BS; Samantha E. Schoeneman, BA; Sameer A. Ansari, MD, PhD; James Carr, MD; Michael Markl, PhD; Ali Shaibani, MD American Heart Association: Age-Related Changes of Normal Cerebral and Cardiac Blood Flow in Children and Adults Aged 7 Months to 61 Years.
[3]Wikipedia, “Heart rate”.
[4]M.M.A. Hashem , Rushdi Shams , Md. Abdul Kader , and Md. Abu Sayed - Design and Development of a Heart Rate Measuring Device using Fingertip
[5]Coanda H. G., Designing a control system for smart outdoor street lighting using advanced communication technologies, The Scientific Bulletin of the Electrical Engineering Faculty, No. 1, Vol. 29, 2015, pp.25-30, ISSN 1843-6188
[6]Puchianu D., Predusca G., Intelligent parking, The Scientific Bulletin of the Electrical Engineering Faculty, No. 1, Vol. 15, 2011, pp.84-89, ISSN 1843-6188
[7]Hsu, P. H. Schaum's Theory and Problems: Signals and Systems, McGraw-Hill 1995
[8]Lathi, B.P., Signal Processing & Linear Systems, Berkeley-Cambridge Press, 1998,
[9]Pico Technology, “Calculating the heart rate with a pulse plethysmograph”.
[10]P. F. Binkley, “Predicting the potential of wearable technology”, IEEE Eng. Med. Biol. Mag., Vol. 22, 2003, pp. 23-27.
[11]Predusca G., Computer aided analysis of the MOS capacitor in low frequency conditions, The Scientific Bulletin of the Electrical Engineering Faculty, No. 4, Vol. 28, 2014, pp.15-19, ISSN 1843-6188