ISSN-L: 2501 - 1235 Available on-line at: www.oapub.org/edu
doi: 10.5281/zenodo.2613529 Volume 5 │ Issue 7 │ 2019
ASSESSMENT OF LEAN BODY TISSUE COMPOSITION
IN YOUNG ELITE MALE PLAYERS OF DIFFERENT SPORTS
Abhishek Bandyopadhyay1,
S. K. Dey2,
Gouriprosad Datta3i
1Research Fellow, Human Performance Laboratory, Sports Authority of India, Netaji Subhas Eastern Centre, Salt Lake City, Kolkata, India 2Dr., Human Performance Laboratory, Sports Authority of India, Netaji Subhas Eastern Centre, Salt Lake City, Kolkata, India 3Associate Professor Dr., Department of Physiology, City College, Kolkata, India
Abstract:
Purpose: The present study was aimed to investigate the characteristics of lean body tissue composition in a group of young (mean age 16.7 ± 2.31 yrs) male athletes of different sports and the effect of sports specific physical activity on body tissue composition. Methods: Three hundred forty two (n= 342) male players of different sports viz., football, hockey, table tennis and badminton along with seventy two (n=72) sedentary school boys were also evaluated for various anthropometric and body composition parameters. Body composition including, body fat % (BF %), fat free mass (FFM), body cell mass (BCM) and extra cellular mass (ECM) was determined by whole body bio impedance measurements using a multi-frequency analyzer (Maltron Bioscan 920-2, Maltron International, Rayleigh, Essex, UK). Relative BCM, BCM Index (BCMI) and the ECM /BCM ratio were also calculated. Results: One-way ANOVA reveals significant differences (p<0.01) in BF%, FFM, BCM and ECM when compared among the group. BCM% related to body weight was also differed significantly (p<0.01) and found highest value in hockey players and lowest value in control group followed by the table tennis players. However, only significant difference was observed in case of BCMI when table tennis players were compared to their badminton counterparts. Scatter plot of BMI and BCMI predicted that both soccer and hockey players had greater
lean mass variations whereas table tennis players exhibited lower lean mass variations. Conclusions: Differences in BCM, relative BCM, ECM/BCM, BCM/FFM and BCMI could be the potential indicators for the evaluation of qualitative and quantitative alterations in imposed training load of the athletes from different sports. The findings of present study may be useful to the players and their trainers to formulate the systematic training programme to enhance the sports performance.
Key words: body composition, extra cellular mass, body cell mass, body cell mass index, young Indian athletes, bioelectrical impedance
1. Introduction
Body tissue composition not only determines athletes’ motor fitness and level of sport but also plays a key role in training. The fat free mass including the lean muscle mass and bone mineral mass is important for the production of speed, strength, power, and also for injury prevention [1].
The optimal body composition varies among different sports and sport events. At the cellular level physiological modelling of body composition associated with functions which can be separated into different compartments: energy store in fat mass (FM), energy expenditure and metabolism by body cell mass (BCM). BCM is the metabolically active compartment of fat free mass (FFM) which reflects the body’s cellular components involved in oxygen consumption, carbon dioxide production and resting metabolism [2]. On the other hand, the extra cellular mass (ECM) includes non-metabolically active connective tissues such as, collagen, elastin, skin, tendons, and bones along with interstitial water.
The volume and function of the muscle portions of BCM further can be enhanced by physical activity & systematic exercise. Randáková et al. [3] compared the body composition between athletes and non-athletes and found a clear positive influence of regular training which decreases relative fatness along with a greater increase in BCM and FFM together in athletes. In another study, players individually ranked higher has displayed greater body cell mass in two different soccer teams as reported by Melchiorri et al. [4]. Changes in the metabolic activity of BCM and its diversified development have been used as information of athlete's adaptation to different types of physical activity and their training level [5]. Muscle mass alterations also can be best described by the changes in ECM/BCM ratio. Furthermore, body cell mass index (BCMI) also has been shown to be sensitive to changes in protein status and lean tissue rather than BMI alone [6].
insight into the field of body composition. In recent years few studies [4, 7-9] have been conducted worldwide to verify the impact of different sports with special reference to body cell mass (BCM). Dey et al [10] have compared body cell mass characteristics in young Indian athletes. However, literature addressing body tissue characteristics on Indian athletes was found to be scanty.
Therefore, in order to further investigate this issue, the present study was aimed to:
1) assess and evaluate the features of lean body tissue composition, and
2) find the impact of sports specific physical activity in a group of Indian junior elite male athletes.
2. Material and methods
2.1 Selection of subjects
Three hundred forty two (n= 342) male athletes (mean age; 16.7 ±2.31 yrs) were participated in the present study from four different sports disciplines viz. Football (n=95), Hockey (n=110), Table Tennis (n=74) and Badminton (n=63) respectively. All the players were belonged to various schemes (viz., COE - Centre of Excellence, STC - Sports Training Centre & SAG -Special Area Games) of Sports Authority of India (SAI), eastern region. An adequate number of age- matched male control group (n=72; mean age= 16.4 ±1.42 years) with no particular athletic background from the same locality were also served as control group. The players of the present study were at least of state level performer having at least 3-4 yrs of formal training history. The subjects were not suffering/ having any history of any hereditary and cardio-respiratory diseases. They were belonged to almost similar socio-economic status and having similar dietary habits and were having training in same kind of environmental/ climatic condition. Hence, the subjects were considered as homogeneous.
Before the onset of testing, all the players were clinically examined by the physicians of SAI, Kolkata, (Sports Medicine specialist) following standard procedure [11]. All the subjects were evaluated for various anthropometric and body composition variables at Human Performance Laboratory of Sports Authority of India, Kolkata.
2.2 Training Regimen
cooling down session were also included in the training programme after & before starting of the main practice. Players were also undergone through the mental training sessions besides of their physical and skill/ technical training programme.
Although the activity level of the control groups was not able to monitor closely however, they did not exercise more than three times per week (for a total period of approximately 3 hours/week). The physical activities were performed generally consisted of common recreational games, running, jogging etc.
2.3 Measurement procedure
The decimal age was calculated from the date of birth recorded from original birth certificate, produced by the subjects at the time of testing. The physical characteristics including height (to the nearest 0.1 cm) and weight (to the nearest 0.1 kg) were measured by digital stadiometer (Seca 242, Itin Scale Co., Inc., USA) and body composition analyzer (Tanita BF-350, Tanita Corporation of America Inc., USA) respectively.
2.4 Multi Frequency Bioelectrical Impedance Analysis (MF-BIA)
Body composition was measured by means of bioelectrical impedance analysis (BIA) technique with four different frequencies (5, 50, 100 and 200 KHz) at an alternate current (0.2 mA) using a multi-frequency analyzer (Maltron Bioscan 920- 2, Maltron International, Rayleigh, Essex, UK). Measurements were taken followed by the manufacturer’s recommended method [12].
The subjects were asked to lay down in a supine position on a non-conducting surface with their arms slightly abducted from the trunk and the legs slightly separated for about 5 minutes. Before placing the ME4000 self-adhesive electrodes, the sites were cleaned by isopropyl alcohol to ensure adherence thereby limiting the possible errors. Two surface electrodes with cables were placed on the skin between the talus and the 3rd and 5th digits of the foot and two more were attached to the same side between the 3rd and 5th knuckles of the hand and the wrist, as shown in the user’s manual.
Resistance (R) and reactance (Xc), as whole-body impedance vector components were measured at same time. FFM and BCM were calculated using the software provided by the manufacturer of the machine. The raw values were visible immediately on the analyser and subsequently transmitted to a computer for further analysis. The analyzer was calibrated followed by manufacturer’s instructions prior to taking the measurement. All the subjects were pre-instructed according to the guidelines of Heyward & Stolarczyk [13] to ensure proper euhydration before the measurement procedure.
2.5 Ethical Consideration
The present study was conducted according to the guidelines laid down in the Declaration of Helsinki and all procedures involving human subjects were approved by the Ethical Committee of Sports Authority of India, Kolkata. Prior to initial testing, a complete explanation of the purposes, procedures and potential risks and benefits of the tests were explained to all the subjects and a signed consent was obtained from them.
2.6 Statistical Analysis
Mean, standard deviations (±SD) for all the selected variables were calculated. The assumption of normality was verified using the Shapiro-Wilk W-test. One way ANOVA followed by Bonferroni’s post-hoc test for multiple comparisons was also performed among the selected parameters. The significance level was defined as p<0.05. Pearson’s product moment correlation coefficient was performed to see the relation with Body Mass Index and Body Cell Mass Index and represented by scatter plots. Data were analyzed using the Statistical Package for Social Science (version 21.0, SPSS, Inc., Chicago, IL).
3. Results
Table 1 represents the descriptive anthropometric and body composition characteristics of the male junior players of different ball and racket sports and the control group. Comparatively bigger size (height and weight) was evident for badminton players as compared to their counterparts. On the other hand, table tennis and football players exhibited similarly smaller size. No such significant difference was observed in body weight, BMI among the sport disciplines and control group. However, BF%, fat free mass, extra cellular mass and body cell mass have shown significant differences when Analysis of variance (ANOVA) applied among the groups. Football and Hockey players were found to be leaner as they showed less BF% compared to the racket sports players and the control group. Higher adiposity was found on table tennis players compared to rest of the sports whereas highest value was obtained in sedentary boys. Significant difference (p<0.01) also existed in the ratio of ECM/BCM, while BCM was found to be highest in badminton players. BCM as per body mass i.e., relative BCM (BCM %), has shown comparatively a higher mean value in hockey, lower in table tennis players and lowest in control group. BCM as per FFM (i.e., BCM/FFM, %) found to be almost similar among the sports without any significant difference, however, with a slightly higher value in case of sedentary boys. Significant difference (p<0.05) was also observed in BCMI as table tennis players exhibited minimal value whereas almost similar values for rest of the groups were exhibited.
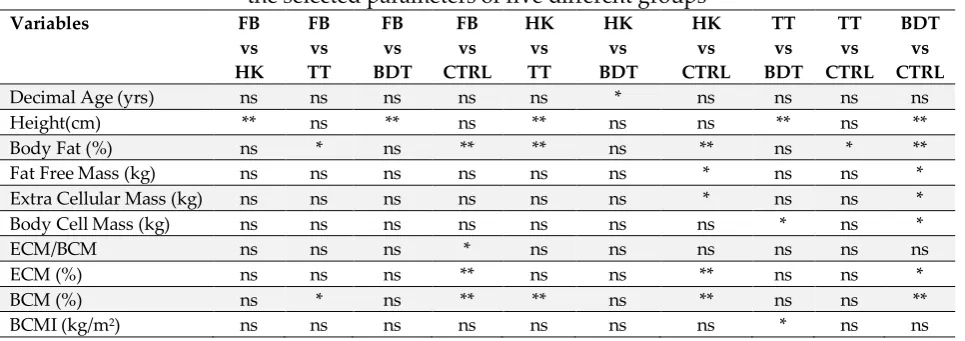
disciplines. Table tennis players were also differed significantly (p<0.01; p<0.05) and mostly with their hockey and badminton counterparts. BF% was differed significantly (p<0.01; p<0.05) when table tennis players were compared with football, hockey and control group. Except decimal age and body height, no such parameter showed any significant difference when football, hockey & badminton group was compared to each other.
The scatter plot of BMI (on the x-axis) in relation with BCMI (on the y-axis) of four different sports disciplines are depicted in Figure 1 (A to D). A slight variability in BCMI value as per BMI for the sports disciplines was observed in contrast to the control group.
Table 1: Mean, standard deviation and level of significance of
Physical characteristics & Body composition parameters of the participants (N=414)
Variables Football (n=95) Hockey (n=110) Table Tennis (n=74) Badminton (n=63) Control (n=72)
F(4, 409)
Decimal Age (yrs) 16.9 ±2.04 16.2 ±1.87 16.8 ±2.48 17.3 ±2.98 16.4 ±1.42 3.31 (*) Height (cm) 166.2 ±5.25 169.1 ±4.57 165.1 ±5.53 170.1 ±5.64 164.3 ±6.70 16.17 (**) Weight (kg) 56.8 ±5.19 57.9 ±6.25 56.9 ±10.48 60.0 ±8.99 58.2 ±12.84 1.54 (ns) BMI (kg/m2) 20.5 ±1.45 20.3 ±1.85 20.8 ±3.24 20.9 ±2.82 21.5 ±4.26 2.11 (ns) Body Fat (%) 13.4 ±5.35 12.9 ±4.19 16.4 ±6.43 14.8 ±4.36 19.4 ±8.02 17.49 (**) Fat Free Mass (kg) 49.3 ±5.92 50.3 ±6.55 47.2 ±7.83 51.2 ±8.32 46.5 ±9.59 5.07 (**) Extra Cellular Mass (kg) 22.7 ±3.42 23.1 ±4.08 21.6 ±4.32 23.2 ±5.00 20.7 ±5.10 4.87 (**) Body Cell Mass (kg) 26.6 ±2.67 27.2 ±2.93 25.7 ±4.28 28.0 ±3.98 25.9 ±4.86 4.66 (**) ECM/BCM 0.85 ±0.07 0.85 ±0.10 0.85 ±0.16 0.83 ±0.12 0.80 ±0.10 3.30 (*) ECM (%) 39.9 ±3.80 39.8 ±4.91 38.2 ±5.34 38.5 ±4.87 35.8 ±5.71 9.20 (**) BCM (%) 46.8 ±2.01 47.0 ±1.96 45.4 ±3.60 46.7 ±2.48 44.8 ±2.83 11.75 (**) BCM/FFM (%) 54.1 ±2.00 54.4 ±4.61 54.5 ±4.14 55.0 ±4.15 55.8 ±3.05 0.65 (ns) BCMI (kg/m2) 9.6 ±0.75 9.5 ±0.87 9.4 ±1.28 9.6 ±1.16 9.5 ±1.47 2.64 (*) Values are (mean ± SD). **p< 0.01,* p< 0.05, ns= Not Significant.
Table 1a: Bonferroni’s post hoc test for multiple comparisons of the selected parameters of five different groups
Variables FB vs HK FB vs TT FB vs BDT FB vs CTRL HK vs TT HK vs BDT HK vs CTRL TT vs BDT TT vs CTRL BDT vs CTRL
Decimal Age (yrs) ns ns ns ns ns * ns ns ns ns
Height(cm) ** ns ** ns ** ns ns ** ns **
Body Fat (%) ns * ns ** ** ns ** ns * **
Fat Free Mass (kg) ns ns ns ns ns ns * ns ns *
Extra Cellular Mass (kg) ns ns ns ns ns ns * ns ns *
Body Cell Mass (kg) ns ns ns ns ns ns ns * ns *
ECM/BCM ns ns ns * ns ns ns ns ns ns
ECM (%) ns ns ns ** ns ns ** ns ns *
BCM (%) ns * ns ** ** ns ** ns ns **
BCMI (kg/m2) ns ns ns ns ns ns ns * ns ns
A. B.
C. D.
Figure 1: Scatter plot of the body mass index (BMI, kg/m2) and the body cell mass index
(BCMI, kg/m2) for (A) Football, (B) Hockey, (C) Table tennis & (D) Badminton players
in respect to the control group
4. Discussion
Variation in the values of BCM content among the present players was corroborated with the findings of previous studies [3-5, 7]. Since badminton players were found to be bigger in size with more body mass and FFM, naturally they were found to have higher level of BCM (28.0 ±3.98, kg) compared to their counterparts whose body mass was comparatively less. Again, according to Burdukiewicz et al. [9], the differences in relative BCM reflect varied level of physical performance in athletes. Therefore, in order to reduce the effect of body weight as well as to get a clear view of our hypothesis, we have expressed BCM relative to the body weight (BCM %).
aerobic demand of energy release was high a greater BCM content has been observed. Therefore, a high relative BCM (%) in hockey, football and badminton players in the present study can predicts that they have undergone through high intensity aerobic training compared to the table tennis players.
On the other hand, table tennis has been classified as low-moderate group of sports on the basis of the static component, dynamic component and as well as energy systems involved [14]. As a result; they have shown a higher adiposity and low relative BCM in the present study. On the other hand, since sedentary boys have minimal exposure of such athletic training, they possesses lowest BCM % as per body mass including a much lower FFM.
The ratio: ECM/BCM, in healthy individuals is always lower than 1 and lower this number, the higher the amount of mass which can be used for physical or sport activities [15]. For athletes, its values range between 0.70–1.00 depending on the type of sport [16]. In the present study, the degree of training load might be comparatively lower than the study of Burdukiewicz et al. [9], where Polish male junior football players (mean age; 16.2 ±0.70 yrs) featured a much decreased relative extracellular mass. Their overall ECM/BCM index was also found to be 0.7, which corresponds to the values of well-trained adult competitors. The present values were almost close to Slovak women’s national team (0.84 ± 0.08, [17]; 0.86 ± 0.09, [7]), and young Czech boys of 6 to 14 years (0.87 ±0.12, [18]).
For most players of the present study (0.70–0.85), these values indicate an excellent predisposition for muscular activity and for physical performance, which is one of the preconditions for the individual playing performance of a player. From the perspective of individuals, the lowest value of the ECM/BCM ratio recorded was 0.75, but there were also values of 0.90–0.99 in our table tennis players, which may relate to ontogenesis and commonly recorded for individuals engaged in recreational sport indicating lowest actual predispositions for physical activity (muscle activity). Furthermore, these values indicates possible reserves in the sense of a potential for improvement in the training load or nutrition regimen with regards to individual table tennis players, or reflecting genetic dispositions for a potential BCM growth in individual players. The only significant difference in ECM/BCM index of the present study was registered between sedentary boys and hockey players in our screened sample. This difference may be caused by the level (quality) of the players from the perspective of physical preparedness as well as play success at important events than the players from other sport disciplines. Almost similar and lower values of this index among the sports disciplines with regards to the control group indicates genetic determination of this parameter and its value as a predisposition for further implementation of physical activities [19].
value of two elite women volleyball team (CQ = 48.38 ± 3.17%) without any significant difference between them. The mean values of CQ of the athletes participating in different sports as well as the control group were found to be similar with the Slovak national women volleyball players (CQ = 54.5%; [17]). On the other hand, a lower BCM/FFM% among the athletes refers both to ontogenesis and reserves in the training load, when better predispositions were seen in the sedentary boys in particular groups.
Body cell mass index (BCMI) has been proved to be more sensitive than BMI in revealing differences of the muscular mass. In a previous study [21], subjects (athletes of both genders and people with eating disorders) with normal or high BMI values (i.e. between 20 and 30) have shown greater variability in BCMI (i.e. between 5 and 19 kg/m2). They have interpreted that subjects may appear overweight on the basis of BMI,
but those who have lower BCMI values are malnourished.
In the present study, the only significant difference in the mean values of BCMI was registered between table tennis and badminton players where badminton players exhibited superior value. Therefore, in order to revealing a clear picture of improved body composition quality and the predisposition of muscular mass of the athletes over sedentary boys we distributed the BCMI values in respect to BMI through scatter plot. Both soccer and hockey players showed a slightly higher BCMI variability (i.e. between 9.0 and 11.0 kg/m2) within the shortest BMI range (between 19.0 and 22.5) (fig., 3a). On
the other hand, both table tennis and badminton players exhibited the same BCMI variability however within a wider BMI range (between 19.0 and 24.5) (fig., 3c, 3d). A slightly higher BCMI variability for soccer and to some extent in hockey players within shortest BMI range justified the improved lean mass quality and muscular development. Whereas, lower in BCMI variability within a wider BMI range for table tennis and badminton players indicates there lower energy in game demand and requirement of further improvement of lean mass quality.
Apparently, majority of our present subjects were on their adolescent period. Therefore, almost similar values in ECM/BCM ratio, ECM/FFM, BCM/FFM and BCM index might be the reason of similar age group of the participants among different sport disciplines. It has been well reported that chemical maturity of FFM is not attained until late adolescence or young adulthood, probably 18 to 20 years in boys [22].
Our study had some major limitations. The total-body potassium-40 counting technique is a “gold standard” method to obtain accurate, precise and reproducible estimates of BCM. However, since it is expensive, requires specific calibration skills, special infrastructure and operating conditions, this technique is not generally applicable in the field studies. On the other hand, a more objective assessment is provided by Bioelectrical Impedance Analysis (BIA). BIA, in contrast is relatively simple, quick (takes only a few minutes), and non-invasive technique by which body tissues such as extracellular mass (ECM) or body cell mass (BCM) can be simply measured. BIA uses prediction equations usually include the impedance index (height2/resistance) which is dependent on the capacitant effect of cell membranes and
status of the individual however no direct measure of hydration status was possible independent of BIA in our study. Reasonable attempts were taken to ensure that all individuals were at their state of euhydration prior to measurements being taken. Another limitation was that, effect of biological age and nutritional influences on the body composition were not being considered in the present study.
5. Conclusion
In conclusion, body cell mass, measured using the whole body multi-frequency bio-impedance method, represents an innovative, simple approach to assess body composition. The present study demonstrates that differences in BCM, relative BCM, ECM/BCM, BCM/FFM and BCMI could be the potential indicators for evaluation of qualitative and quantitative alterations in the imposed training load of the athletes from different sports. ECM/BCM, BCM/FFM and BCMI requires a wide-scale application in the field studies in future as these are more sensitive parameters monitoring changes in muscle mass and protein tissues. Although these results must be considered not yet conclusive, they could be the important information for coaches, especially designing the systematic and scientific training programmes to improve the sports performance as well as reference standards for future comparison.
Acknowledgements
Sports Authority of India, Eastern centre is greatly acknowledged to provide all the facilities to complete the present study.
References
1. Arden N.K., Spector T.D. (1997). Genetic influences on muscle strength, lean body mass, and bone mineral density: a twin study. Journal of Bone and Mineral Research, 12(12): 2076–2081. doi: 10.1359/jbmr.1997.12.12.2076.
2. Ellis, K.J. (2000). Human body composition: in vivo methods. Physiological Reviews, 80(2): 649 –668.
3. Randáková R. (2005). Effect of regular training on body composition and physical performance in young cross-country skiers: as compared with normal controls. Acta Universitatis Palackianae Olomucensis. Gymnica, 35(1): 17–35.
4. Melchiorri G., Monteleon G., Andreoli A., Callà C., Sgroi M., De Lorenzo A. (2007). Body cell mass measured by bioelectrical impedance spectroscopy in professional football (soccer) players. Journal of Sports Medicine and Physical
Fitness, 47(4): 408-412.
highly trained athletes. Acta Diabetologica, 40(1): S122–S125. doi: 10.1007/s00592-003-0043-9.
6. Talluri T. (1998). Qualitative human body composition analysis assessed with bioelectrical impedance. Collegium Antropologicum, 22(2): 427–432.
7. Malý T., Malá L., Zahálka F., Baláš J., Čada M. (2011). Comparison of body composition between two elite womenʼs volleyball teams. Acta Universitatis Palackianae Olomucensis. Gymnica, 41(1): 15-22. doi: 10.5507/ag.2011.002.
8. Clarion A., Ribbe E., Rebeyrol J., Rousseaux-Blanchi M., Dechavanne C., Moreno M. (2013). Bio-impedance body composition comparisons between athletes and healthy subjects. Journal of Physics, Conference Series, Volume 434, conference 1. doi:10.1088/1742-6596/434/1/012064.
9. Burdukiewicz A., Chmura J., Pietraszewska J., Andrzejewska J., Stachoń A., Nosal J. (2013). Characteristics of body tissue composition and functional traits in junior football players. Human Movement, 14(2): 96– 101. doi: 10.2478/humo-2013-0010.
10.Dey S.K., Bandyopadhyay A., Jana S., Chatterjee (Nee Karmakar) S. (2015). Assessment of body cell mass in Indian junior elite players (male) of different sports using bioelectrical impedance analysis method. Medicina Sportiva, 11(2): 2533-2540.
11.SAI. (1992). Spotting and Nurturing of Sport Talent. Sports Authority of India National Sports Talent Contest Scheme. Appendix D, pp. 110-116.
12.Maltron International. (1999). Maltron Bioscan 920-2 operating and service manual. Pp. 8-30.
13.Heyward V.H., Stolarczyk L.M. (1996). Applied body composition assessment. Human Kinetics. Champaign, IL, USA.
14.Mittchel J.H., Haskell W.L., Raven P.B. (1994). Classification of sports. Medicine & Science in Sports & Exercise, 26(10-supplement): 242-245.
15.Deurenberg P., Tagliabue A., Schouten F.J.M. (1995). Multi-frequency impedance for the prediction of extracellular water and total body water. British Journal of Nutrition, 73(3): 349–358. doi: 10.1079/BJN19950038.
16.Data Input. (2004). Manual Nutri 4 - multifrequency software for the determination of body water, body composition and nutritional status. Instructions for use. Frankfurt am Main: DataInput GmBH,.
17.Malá L., Malý T., Záhalka F., Bunc V. (2010). The profile and comparison of body composition of elite female volleyball players. Kinesiology, 42(1): 90-97.
18.Bunc V. (2006). Body composition as a determining factor in the aerobic fitness and physical performance of Czech children. Acta Universitatis Palackianae Olomucensis. Gymnica, 36(4): 39–45.
19.Malá L., Malý T., Zahálka F. (2014). The quality of active mass and segmental fluids body distribution in young elite soccer players. Sport Science, 7 (2): 94‐100. 20.Dörhöfer R.P., Pirlich M. (2007). Das BIA – Kompendium, III. Darmstadt: Data
21.Talluri A., Liedtke R., Mohamed E.I., Maiolo C., Martinoli R., De Lorenzo A. (2003). The application of body cell mass index for studying muscle mass changes in health and disease conditions. Acta Diabetologica, 40(1), S286– S289. doi: 10.1007/s00592-003-0088-9.
22.Wells J.C.K., Williams J.E., Chomtho S., Darch T., Grijalva-Eternod C., Kennedy K., Haroun D., Wilson C., Cole T.J., Fewtrell M.S. (2010). Pediatric reference data for lean tissue properties: Density and hydration from age 5 to 20 y. American Journal of Clinical Nutrition, 91(3): 610–618. doi: 10.3945/ajcn.2009.28428.
23.De Lorenzo A., Andreoli A., Matthie J., Withers P. (1997). Predicting body cell mass with bioimpedance by using theoretical methods: a technological review.
Creative Commons licensing terms