DESIGN AND ANALYSIS OF AN INSTRUMENTING PROFILER FOR WEBASSEMBLY
A Thesis
presented to
the Faculty of California Polytechnic State University,
San Luis Obispo
In Partial Fulfillment
of the Requirements for the Degree
Master of Science in Computer Science
by
Chandler Gifford
c
2019
COMMITTEE MEMBERSHIP
TITLE: Design and Analysis of an Instrumenting Profiler for WebAssembly
AUTHOR: Chandler Gifford
DATE SUBMITTED: June 2019
COMMITTEE CHAIR: Aaron Keen, Ph.D.
Professor of Computer Science
COMMITTEE MEMBER: John Clements, Ph.D
Professor of Computer Science
COMMITTEE MEMBER: John Bellardo, Ph.D
ABSTRACT
Design and Analysis of an Instrumenting Profiler for WebAssembly
Chandler Gifford
ACKNOWLEDGMENTS
I would like to thank the following people who helped me during my time at Cal Poly and made possible the completion of this thesis:
• My parents for their support putting me through school and encouraging me to pursue my MS degree.
• My advisor, Dr. Aaron Keen, for helping me complete this thesis.
TABLE OF CONTENTS
Page
LIST OF TABLES . . . ix
LIST OF FIGURES . . . x
CHAPTER 1 Introduction . . . 1
2 Background . . . 3
2.1 Dynamic Analysis . . . 3
2.2 Profiling . . . 3
2.2.1 Sampling . . . 4
2.2.2 Instrumenting . . . 4
2.3 WebAssembly and JavaScript . . . 5
2.3.1 WebAssembly Module . . . 5
2.3.2 JIT Compiler . . . 6
2.4 Existing Tools . . . 7
3 Related Work . . . 9
3.1 WebAssembly . . . 9
3.2 Code Profilers . . . 9
3.3 Taint Assembly . . . 10
3.4 Wasabi . . . 10
4 Requirements and Validation . . . 11
5.1 Major Design Decisions . . . 13
5.1.1 Instrumentation . . . 13
5.1.2 Information Collected . . . 13
5.1.3 Call Arcs . . . 14
5.1.4 Host API . . . 15
5.2 Limitations of WebAssembly . . . 16
5.2.1 Memory Limitation . . . 16
5.2.2 Access to System Resources . . . 17
5.3 Instrumentation Implementation . . . 17
5.3.1 Call Hoisting . . . 18
5.3.2 WebAssembly Support Functions . . . 19
5.3.3 Decorators . . . 20
5.4 Host Implementation . . . 21
5.4.1 API JavaScript Implementation . . . 21
5.4.2 Runtime Patching . . . 22
5.4.3 Data Structures . . . 23
5.4.4 Printing Results . . . 23
5.5 Special Call Situations . . . 25
5.5.1 Calls to Exported Functions . . . 25
5.5.2 Indirect Calls . . . 27
6 Results . . . 29
6.1 Experimental Setup . . . 29
6.1.1 Profiler Comparisons . . . 29
6.1.2 Benchmark Programs . . . 30
6.2 Validation Results . . . 31
6.2.1 Concrete Requirements . . . 31
6.2.2 Functional Requirements . . . 32
6.3 Performance Results . . . 33
6.3.1 Binary Size Difference . . . 33
6.3.2 Compilation Difference . . . 34
6.3.3 Runtime Difference . . . 35
6.4 Usability and Output . . . 38
6.4.1 Instrumentation Usage . . . 39
6.4.2 Runtime Usage . . . 39
6.4.3 Output Inaccuracies . . . 40
7 Future Work . . . 42
7.1 Profiler Improvements . . . 42
7.2 Profiler with Future WebAssembly Features . . . 43
7.3 Other Host Environments . . . 44
8 Conclusion . . . 45
BIBLIOGRAPHY . . . 47
APPENDICES A Example of Instrumented WebAssembly Importing Required Functions 50 B Program to validate relative function timing of WasmProf . . . 51
B.1 Validation Code . . . 51
B.2 WasmProf Validation Output . . . 53
LIST OF TABLES
Table Page
6.1 Binary size of original program and instrumented programs (in kilo-bytes) . . . 33 6.2 Compilation time of WebAssembly program (in milliseconds) . . . . 34 6.3 Runtime of benchmark programs. Normalized to the runtime of the
LIST OF FIGURES
Figure Page
5.1 Example nested call before hoisting and instrumentation . . . 19 5.2 Example nested call after hoisting and instrumentation . . . 19 5.3 Flat profile of a main function that makes one call each to add and
double functions. . . 24 5.4 Call graph profile that shows main calling add and double functions. 25 5.5 Example JavaScript code that calls a WebAssembly function . . . . 26 5.6 Example WebAssembly code that imports and calls a JavaScript
function . . . 27
6.1 WasmBoy performance comparison of WasmProf, Wasabi, and un-modified program . . . 37 6.2 WasmBoy performance comparison of sampling profiler and
Chapter 1 INTRODUCTION
This thesis presents the design, implementation, and analysis of WasmProf, an in-strumenting profiler for WebAssembly code. WebAssembly is quickly growing as the target language of choice for deploying high-performance applications to the web. Ev-erything from PDF tools [15] to game engines [16] are using WebAssembly to create programs that were previously too demanding to run reliably on the web. A major focus of WebAssembly is faster performance which means good tools for analyzing and tuning the execution of WebAssembly programs are vital to the development of more applications. Profilers, in particular, are an important performance analysis tool that allows developers to see where their application is spending the most time and consequently, which areas they should focus on tuning. WebAssembly is a rela-tively new technology that is still being developed and currently few tools exist for the analysis of WebAssembly code. WasmProf is this thesis’s contribution to the set of available tools that will help developers tune their WebAssembly code and enable more and more applications to run on the web.
Chapter 2 and Chapter 3 discuss some background on the current state of We-bAssembly, as well as some related works in WebAssembly dynamic analysis. We discuss how the WasmProf tool fits into the field of WebAssembly analysis which basically consists of profilers built into most modern browsers as well as research into doing dynamic analysis on WebAssembly code. WasmProf is presented as a tool with a specific purpose; profile function call times and call counts. Specializing the tool provides users with an easy to use profiler that gives in-depth information about func-tion call times while reducing performance overhead on instrumented code as much as possible.
timings due to the inherent overhead of instrumentation, but function timings that are accurate relative to each other. This provides the user with insight into which functions may require attention and optimization. Chapter 4 details these require-ments for WasmProf and how we attempted to validate that WasmProf is behaving as a profiler should; it should correctly track all calls in a program and provide useful function timing.
With WasmProf’s goals in mind, the actual design and implementation of the WasmProf tool is discussed in Chapter 5. The chapter explains how design deci-sions were inspired by previous profilers in other languages and how the WasmProf feature set was restricted by the current WebAssembly specification. Also presented is an API developed to describe how WasmProf should interact with the host en-vironment. The specific implementation presented in this thesis uses JavaScript as the host environment from which WebAssembly programs are instantiated, but this is not necessarily a requirement. The WasmProf profiler implementation was tested on a variety of different WebAssembly programs and Chapter 6 presents the results of those tests. The correct functionality of WasmProf was validated and its perfor-mance was tested against similar tools. Results show that WasmProf meets its goals for a working profiler but definitely suffers from some expected downsides due to the nature of instrumentation’s high overhead.
Chapter 2 BACKGROUND
This chapter presents background information on performance analysis, code profil-ing, and WebAssembly. These concepts will be referenced frequently throughout the remainder of this thesis.
2.1 Dynamic Analysis
Dynamic analysis refers to the practice of monitoring a program while it is running and analyzing it in some way. This can take many forms; a dynamic analysis tool could monitor memory usage, trace what code is being executed, measure how long a program takes to run, etc.
For most popular languages there is some sort of dynamic analysis tools for analyz-ing the performance of a program at runtime. These tools can generally be split into two categories: lightweight sampling analysis which interrupts execution at defined intervals and has relatively low overhead, and heavyweight instrumenting analysis which modifies a program in some way to track its execution. One of the best known and most developed heavyweight dynamic analysis tools is Valgrind for analyzing execution of C programs [12].
2.2 Profiling
2.2.1 Sampling
Sampling profilers will generally use a timer to interrupt a program at defined inter-vals. Each time the program is interrupted, the call stack is examined to determine which function the program is currently in. By keeping track of which functions are hit over the course of many interruptions, the sampling profiler can build a statistical estimation of how much time is spent in each function or section of code. These types of profilers have the advantage that they can be tuned with different interruption intervals in order to adjust how much runtime overhead they add to the original pro-gram. The trade-off is the longer the interval between interruptions, the more likely the profiler is to miss function calls and build an inaccurate representation of program behavior. In addition, sampling profilers cannot accurately count exactly how many times each function is called.
2.2.2 Instrumenting
As discussed later in this thesis, many sampling profilers already exist in web browsers; this thesis focuses on the implementation of WasmProf as an instrumenting profiler.
2.3 WebAssembly and JavaScript
WebAssembly is a language (more specifically a virtual instruction set architecture) that is designed to be a compilation target for higher level languages (though it can also be written by hand). WebAssembly has both a binary and a textual encoding. The binary encoding is the main representation and allows for code to be represented more compactly and compiled more efficiently. The textual representation is helpful for debugging or writing code by hand. The WebAssembly architecture is designed as a stack-based virtual machine, meaning each instruction takes its parameters off of the stack and pushes its results back onto the stack. Though this is conceptually how WebAssembly works, specific implementations do not necessarily need to use stack-based execution; it just needs to match the program flow of a stack machine in every way.
2.3.1 WebAssembly Module
All WebAssembly code is organized into modules. Each WebAssembly module con-sists of the following components (this is not a complete list of everything in We-bAssembly but encompasses what is relevant for this thesis):
• linear memory: the linear memory is sandboxed so that WebAssembly code cannot access any outside data unless it is specifically provided (see imports and exports). There is exactly one linear memory for each WebAssembly module; this may be changed in a future version, but at the time of writing WebAssembly 1.0 enforces this rule [14].
5, is an important property for WasmProf since it can add globals without worrying about affecting the original program.
• functions: The main code, functions are defined with a type and a body that is a list of instructions that correctly adhere to the WebAssembly format.
• function table: A function table contains references to functions and can be in-dexed into with the call indirect instruction. This is how WebAssembly achieves dynamic function pointers. As with linear memory, WebAssembly 1.0 enforces that there is exactly one function table per module.
• imports and exports: Memory, globals, functions, and function tables can also be imported or exported. An import is a declaration of an object (of one of the stated types) that will be implemented in the host environment. An export exposes an object in WebAssembly so it can be used by the host environment. Note that the rule about memory and the function table being singular still applies. (i.e., a WebAssembly module cannot both have a memory declared internally and also import a memory from the host environment)
• custom sections: Finally, WebAssembly allows for custom sections in the code which are not part of the specification but can be used for non-standard im-plementations of WebAssembly. There is one custom section that is a pseudo-standard and that is the Names section, which provides a list of strings that correspond to the names of the WebAssembly functions. The Names section is extremely useful to WasmProf because it allows the profiler to output meaning-ful names.
2.3.2 JIT Compiler
code is first parsed from its textual representation into an internal representation that is used by the compiler. Once the code is parsed, the JIT compiler tries to generate machine code very quickly to get the program running, and then it watches program execution to determine where it can go back and further compile the code with optimization [4]. On the other hand, before execution WebAssembly is already compiled into its binary format which has two main advantages. First, the parsing step is not necessary since the binary file can be read directly into a form used by the JIT compiler. Second, WebAssembly can have optimization run beforehand by the compiler that is compiling a higher level language into WebAssembly so the JIT compiler is immediately compiling to optimized machine code and has to do very little work in monitoring the program and re-optimizing later [9, 5]. This is why WebAssembly is generally considered to be faster than JavaScript. In the case of both languages, the JIT compiler can generate very fast machine code, but in the case of WebAssembly it is much easier and faster to generate this optimized machine code.
2.4 Existing Tools
Chapter 3 RELATED WORK
3.1 WebAssembly
In [8], Hass et al. present an overview of WebAssembly and its design goals while they were creating the specification. They sought to make WebAssembly safe, fast, portable, and compact. It is safe in that it runs in a secure execution environment similar to JavaScript. It is fast because it can be optimized ahead of time and compiled quickly to machine code on the host. It is portable in that the format does not restrict itself to any one browser or type of hardware. And it is compact because the binary stack machine representation of the code is much more space efficient than JavaScript’s textual representation.
3.2 Code Profilers
Profilers, and in particular call graph execution profilers, exist for most popular pro-gramming languages. One of the most notable is gprof, a call graph execution profiler for C, Fortran and Pascal programs [7]. Gprof does binary instrumentation during compilation and uses calls to monitoring routines at the start and end of each function that is to be tracked. To reduce overhead, gprof gathers profiling data in memory and then outputs that information to a file as the program exits.
There has also been a lot of past work in developing profilers for the Java Virtual Machine [11], including work to implement sampling profilers [20] as well as the development of more sophisticated instrumentation that can profile all classes in the JDK [3].
the exact execution; they interrupt execution periodically and check which function is being executed. This is used to build a statistical estimation for how much time is spent in each routine.
3.3 Taint Assembly
One existing dynamic analysis tool for WebAssembly is TaintAssembly by Fu et al. TaintAssembly is a data flow tracking modification to the V8 engine that allows for analysis of information flow through a program [6]. As a modification to the V8 engine, TaintAssembly suffers from lack of portability. In addition, it executes code in an interpreted environment which is fine for taint analysis but ill-suited for profiling the performance of WebAssembly programs since performance relies heavily on the code being just-in-time compiled.
3.4 Wasabi
In their recent paper, Lehmann and Pradel sought to create a dynamic analysis tool for WebAssembly called Wasabi [10]. Wasabi is a flexible dynamic analysis tool that performs binary instrumentation of any type of instruction. It takes already compiled WebAssembly binaries and outputs a modified WebAssembly binary as well as sup-porting JavaScript code that must be loaded alongside the WebAssembly program. Analysis is done using callbacks to JavaScript routines. While this is flexible and easier to use, it has higher overhead than solutions such as gprof due to the fact that cross language calls are slower than tracking profiling metadata in memory.
Chapter 4
REQUIREMENTS AND VALIDATION
Validation for this work consists of meeting a number of concrete requirements as well as a number of functional requirements that are more difficult to test and validate quantitatively.
4.1 Concrete Requirements
The first and most important requirement is that an instrumented program produces the exact same result as its uninstrumented version. WasmProf instruments We-bAssembly binaries in such a way that it never changes the semantics of the original program (Section 5.3), so by design, this requirement should always hold true. In addition, we validated that the output of programs remains unchanged before and after instrumentation. All of the benchmark programs are simply run with and with-out instrumentation and their with-outputs are compared to ensure correctness of the instrumented program.
4.2 Functional Requirements
The first functional requirement is to keep the overhead from instrumentation low. There is no exact metric for what constitutes low overhead so this requirement is tested by comparison. First, the total runtime of instrumented code is compared to uninstrumented code. Second, the runtime of instrumented code is compared to the runtime in other profilers; both the Wasabi dynamic analysis framework as well as the sampling profilers in Chrome and Firefox are used for comparison. These comparisons are done across a range of benchmarks to make a qualitative determination of how low the overhead of the instrumented code is.
Chapter 5 IMPLEMENTATION
5.1 Major Design Decisions
WasmProf was designed to be as independent as possible from the runtime environ-ment in which it is running. This is enabled by an API (specified in Section 5.1.4) that must be implemented by the host environment, but other than that WasmProf should work in a browser or any other WebAssembly runtime environment.
5.1.1 Instrumentation
The WasmProf profiler is implemented using only instrumentation to determine func-tion run times and counts. Since the goal is to profile WebAssembly code without modifying the runtime engine, there is no access to any sort of preemption that would allow for sampling. In any case, sampling profilers are already built into many browsers.
WasmProf tries to track as much information about the program completely in WebAssembly code. Data is stored in globals and only sent out to the host on exit from a top-level WebAssembly function. Sending out data to the host is done via the host API functions defined in Section 5.1.4.
5.1.2 Information Collected
the cumulative time spent in the function itself. In addition, the average time per function call can be calculated by dividing call time by the call count.
5.1.3 Call Arcs
WasmProf takes the approach of only recording information about call arcs. A call arc is made up of a call source and a call destination. For each unique source, destination pair, WasmProf keeps a counter of the number of times that call arc was traversed and how much time was spent in the call arc. Time spent in a call arc is the time between when the function call is made and when the function call returns. A call arc traversal is any runtime function call that originates at the source and calls the destination function.
This approach of tracking call arcs is a similar design to that of the gprof profiler [7]. The disadvantage to only tracking call arcs, and not a complete call graph, is that the exact call graph cannot be recreated in all cases. Rather, the call graph is built using the call arc information. This data tells exactly which functions called which other functions, but the exact path of a given function call cannot always be determined. For example, take the case where func3 calls func5 only when called fromfunc1, andfunc3callsfunc4only when called fromfunc2. The exact structure of this call graph cannot be determined using call arcs. The best that can be recreated is that bothfunc1 and func2 callfunc3, andfunc3 calls both func4and func5. In practice, this is not too limiting and the call graph produced should still be useful to the developer.
as discussed in Section 5.2, WasmProf needs to be able to statically determine how much space it needs for profiler data at instrumentation time.
5.1.4 Host API
WasmProf defines a number of API functions that must be implemented by the host environment and made available for calling within WebAssembly. The WasmProf tool generates these function implementations automatically into a supporting JavaScript file when it is run. However, WasmProf instrumented programs should run correctly in any host environment that implements this API.
All functions must be made available by the host environment and will be imported by a WasmProf instrumented binary under the “prof” module. See Appendix A for an example of how the instrumented WebAssembly imports these functions. The required functions are:
• float getTime(void): This returns the current time as a floating point number. The only requirement on the getTime() function is that it uses a monotonically increasing clock.
• void clearResults(void): This clears all arc data stored in host environment data structures.
• void addArcData(int srcID, int destID, float callCount, float targetTime): This provides arc data that should be added to arc data sent with previous and subsequent calls to addArcData (i.e., all calls to addArcData with the same source, destination pair should be added together). It is on the host environment to create the data structures to store this data. This is used to support the special case when WasmProf cannot store all data internally, as described in Section 5.3.3.
the given source, destination pair. It is on the host environment to create the data structures to store this data until clearResults is called.
• void printResults(): This allows the WebAssembly code to dictate when results are printed, if desired. This will be called after all profiling data is sent to the host using the addArcData and setArcData functions. The host should format and print the profiling data when this function is called. The main use case for this is when a WebAssembly program is run from the command line. In the browser, it makes sense to print the results from the interactive JavaScript console.
5.2 Limitations of WebAssembly
WasmProf was implemented to work with programs compiled for the WebAssembly MVP (version 1.0) specification [14]. This comes with a number of limitations that influenced design decisions made during the creation of WasmProf.
5.2.1 Memory Limitation
WebAssembly MVP defines a WASM program to have a single linear memory which is either declared in a WASM module or imported into a WASM module [14].
In the case of imported memory, the memory could be modified by code outside of what is being considered by WasmProf. So WasmProf cannot determine what memory would be safe to use for its own data structures.
data structure that fully tracks a complete execution tree. To get around this, Wasm-Prof tracks call arcs as specified in Section 5.1.3. By traversing the WebAssembly code, WasmProf can determine the set of all possible call arcs and preallocate space to store information about each arc. This does waste space since some arcs will never be called, but it is the only solution to tracking call information without relying heavily on the host environment (i.e., calling out to JavaScript for every update as Wasabi does [10]).
5.2.2 Access to System Resources
WebAssembly does not have inherent access to system resources that are required to implement a full profiler. Most notable, WebAssembly has no timer and has no access to I/O without relying on function imports from the host environment. For this reason, WasmProf cannot possibly be implemented completely in WebAssembly and must rely on the host environment to provide the timer and access to I/O so results can be printed. This led to the design of the host API previously described (in Section 5.1.4).
5.3 Instrumentation Implementation
WasmProf was implemented in C++ using the Binaryen compiler toolchain [2]. Bi-naryen provides the WebAssembly binary parsing and outputs an AST style data structure. That structure is then modified in-place to add instrumentation code while still preserving the original execution of the program. (i.e., the instrumented program will always produce the same results as the original program).
which is important for maintaining correct function execution when the function calls are moved around (see call hoisting below).
In WebAssembly, calls consist of both the call and the call_indirect instruc-tions. A call is simple because both its source and destination functions can be resolved statically when doing the instrumentation. Indirect calls, which index into a table of function pointers, require more work to resolve correctly. The possible implementations for indirect calls and the solution WasmProf uses are discussed in Section 5.5.2 below.
Before and after every call instruction, a call to the getTime() function is made so that time in the function can be calculated. If the WasmProf option to enable forced printing is specified, then on exit from a top-level function (i.e., a WASM function that was called from JavaScript without originating from WASM) the printResults() function will be called.
Assuming the following call sequence:
jsF1(js)→main(wasm)→jsF2(js)→wasmF1(wasm)→wasmF2(wasm)
Only the main function would be considered a top level WebAssembly function. So printResults() would be called right beforemain returns to jsF1.
5.3.1 Call Hoisting
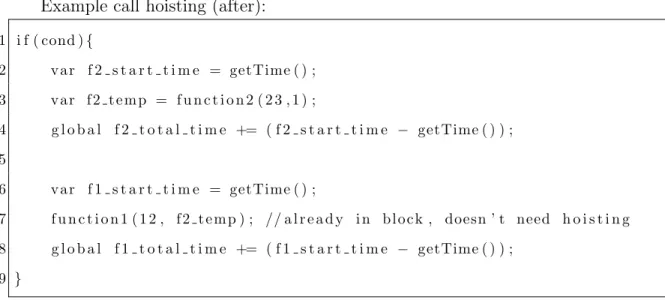
include the extra calls to getTime for the inner function call. Hoisting the nested function calls so they are called one after the other in the same block avoids the timing instrumentation being nested. Note that it is still not possible to avoid the timing overhead when a function calls another function in its body, but WasmProf tries to reduce the overhead from timing instrumentation wherever possible which hoisting helps with. Figures 5.1 and 5.2 show what a nested function call looks like before and after hoisting.
Example nested call (before):
1 i f ( cond ){
2 f u n c t i o n 1 ( 1 2 , f u n c t i o n 2 ( 2 3 , 1 ) ) ;
3 }
Figure 5.1: Example nested call before hoisting and instrumentation
Example call hoisting (after):
1 i f ( cond ){
2 v a r f 2 s t a r t t i m e = getTime ( ) ;
3 v a r f 2 t e m p = f u n c t i o n 2 ( 2 3 , 1 ) ;
4 g l o b a l f 2 t o t a l t i m e += ( f 2 s t a r t t i m e − getTime ( ) ) ;
5
6 v a r f 1 s t a r t t i m e = getTime ( ) ;
7 f u n c t i o n 1 ( 1 2 , f 2 t e m p ) ; // a l r e a d y i n b l o c k , doesn ’ t need h o i s t i n g
8 g l o b a l f 1 t o t a l t i m e += ( f 1 s t a r t t i m e − getTime ( ) ) ;
9 }
Figure 5.2: Example nested call after hoisting and instrumentation
5.3.2 WebAssembly Support Functions
done executing and facilitate extracting all of the call arc information to the host. On exit from a top-level WebAssembly function, a helper function is called that invokes the setArcData API function for every arc stored in WebAssembly. This can take time but does not interfere with the profiler results at all because it is only called at the very end after all times have already been calculated.
5.3.3 Decorators
All functions for which call source and destination cannot be determined at instru-mentation time are handled by using function decorators. The function decorator is called in place of the original function and examines a lastCaller global variable that was previously set to signal what the source of an unknown call arc is. How the lastCaller global is set is discussed Section 5.5 as it varies depending on how the decorator is being called. With the lastCaller as the source and the decorated function as the destination, WasmProf can determine which call arc to use. However, this determination must be done at runtime whereas normal calls can resolve their call arcs at instrumentation time. There are two different strategies used for making this runtime determination of the call arc.
worst-casen2 storage and searching complexity for n functions if it is possible to call every function from every other function.
The second strategy is to push the work of resolving the call arc off to the host. This is done using the addArcData host API function. The source argument can be set to lastCaller, the destination argument is set to the decorated function, call count is set to 1, and time is calculated by adding calls to getTime() before and after the call to the decorated function. This strategy works better when there are a lot of possibilities for lastCaller. The advantage here is that the host environment can use dynamic data structures and won’t have to use a long switch.
In either case, the source and destination of a call arc can be correctly resolved at runtime.
5.4 Host Implementation
WasmProf requires that some amount of glue code is implemented by the host. This fills the gaps in WebAssembly’s capabilities that are required to make the profiler work. The host glue code for this thesis is implemented in JavaScript since that is the most common host environment for WebAssembly modules. WasmProf automati-cally generates and outputs this accompanying JavaScript code when instrumenting a WebAssembly binary. The accompanying JavaScript serves a few different purposes; it overrides WebAssembly instantiation to provide host API implementations, stores call arc data, and facilitates printing profiler results in a readable format.
5.4.1 API JavaScript Implementation
The first thing the host JavaScript code does is implement the host API functions WasmProf needs. Below are the JavaScript implementations created for the API described in Section 5.1.4.
• void clearResults(void): Simply clears JavaScript call arc data structure
• void addArcData(int srcID, int destID, float callCount, float targetTime): Checks if an entry for the srcID, destID pair exists in the data structure and creates entry if required. Increments the call count and time stored by the amount specified in the function arguments.
• void setArcData(int srcID, int destID, float callCount, float targetTime): Checks if an entry for the srcID, destID pair exists in the data structure and creates entry if required. Sets the call count and time stored to be the amount specified in the function arguments.
• void printResults(): Does processing and prints profiler results as specified in Section 5.4.4.
5.4.2 Runtime Patching
5.4.3 Data Structures
In addition to implementing functions, the WasmProf JavaScript code also creates a data structure for storing arc information and a data structure for storing function names. The arc information structure is basically a hash map that maps a source, destination pair to an object containing an integer call counter and a float time variable for the call arc. The entries in this data structure are created as needed whenever one of the addArcData orsetArcData API functions is called from within WebAssembly. The whole structure is deleted whenever the clearResults API function is called.
WasmProf internally tracks every function by assigning it a numeric ID. So the source and destination functions in a call arc are actually represented using the func-tion ID. WasmProf doesn’t store the funcfunc-tion names in WebAssembly; rather, it builds a look-up table that maps a function ID to a function name and it outputs that to the accompanying JavaScript glue code. This way, when the WebAssembly function completes and wants to print collected profiler data, the JavaScript host can use this lookup table to print meaningful function names.
5.4.4 Printing Results
WasmProf results can be printed in one of two ways. The first way is for the We-bAssembly code to initiate a print via the printResults API call. WasmProf accepts a command line flag that will cause the generated WebAssembly binary to call this print function whenever it exits from a top-level WebAssembly function. The second way to trigger a print is to call the WasmProf print function from within JavaScript. In either case, the results that are printed are exactly the same.
• called: How many times the function was called.
• cumulative time: How much total time was spent in the function. Including in functions it calls.
• self time: How much time was spent in just the function itself, not including time spent in functions it calls.
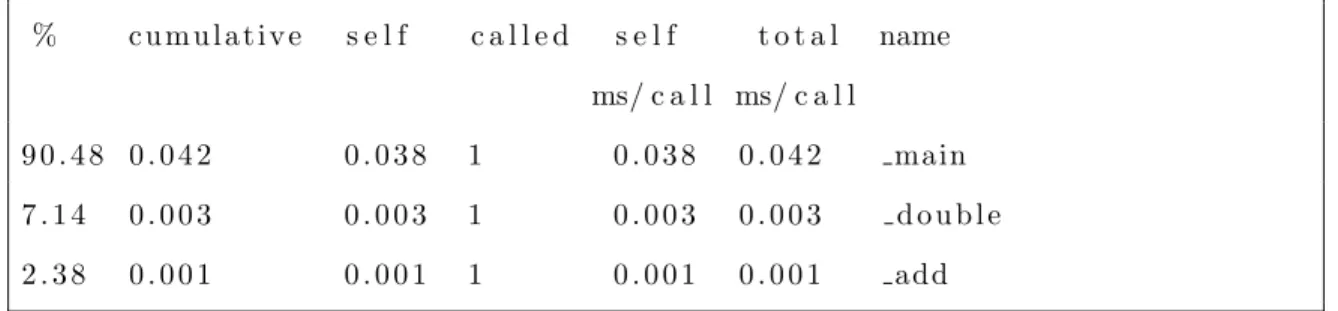
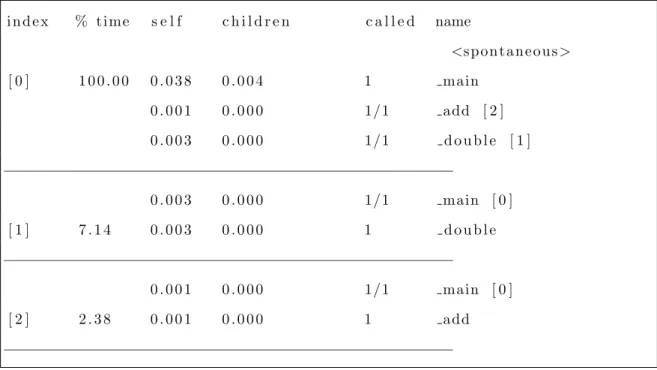
Using this data, along with the call arc information, WasmProf generates two main profiler outputs. The flat profile and the call graph profile, example of which are shown below in Figures 5.3 and 5.4. The format of these outputs is designed to match the familiar output of gprof [7].
% c u m u l a t i v e s e l f c a l l e d s e l f t o t a l name
ms/ c a l l ms/ c a l l
9 0 . 4 8 0 . 0 4 2 0 . 0 3 8 1 0 . 0 3 8 0 . 0 4 2 main
7 . 1 4 0 . 0 0 3 0 . 0 0 3 1 0 . 0 0 3 0 . 0 0 3 d o u b l e
2 . 3 8 0 . 0 0 1 0 . 0 0 1 1 0 . 0 0 1 0 . 0 0 1 add
i n d e x % t i m e s e l f c h i l d r e n c a l l e d name
<s p o n t a n e o u s>
[ 0 ] 1 0 0 . 0 0 0 . 0 3 8 0 . 0 0 4 1 main
0 . 0 0 1 0 . 0 0 0 1/1 add [ 2 ]
0 . 0 0 3 0 . 0 0 0 1/1 d o u b l e [ 1 ]
−−−−−−−−−−−−−−−−−−−−−−−−−−−−−−−−−−−−−−−−−−−−−−−−−−
0 . 0 0 3 0 . 0 0 0 1/1 main [ 0 ]
[ 1 ] 7 . 1 4 0 . 0 0 3 0 . 0 0 0 1 d o u b l e
−−−−−−−−−−−−−−−−−−−−−−−−−−−−−−−−−−−−−−−−−−−−−−−−−−
0 . 0 0 1 0 . 0 0 0 1/1 main [ 0 ]
[ 2 ] 2 . 3 8 0 . 0 0 1 0 . 0 0 0 1 add
−−−−−−−−−−−−−−−−−−−−−−−−−−−−−−−−−−−−−−−−−−−−−−−−−−
Figure 5.4: Call graph profile that shows main calling add and double functions.
5.5 Special Call Situations
There are two instances in which the call arc cannot be statically determined at in-strumentation time. These are the cases when a decorator must be used to determine the call arc at runtime: calls to exported functions and indirect calls.
5.5.1 Calls to Exported Functions
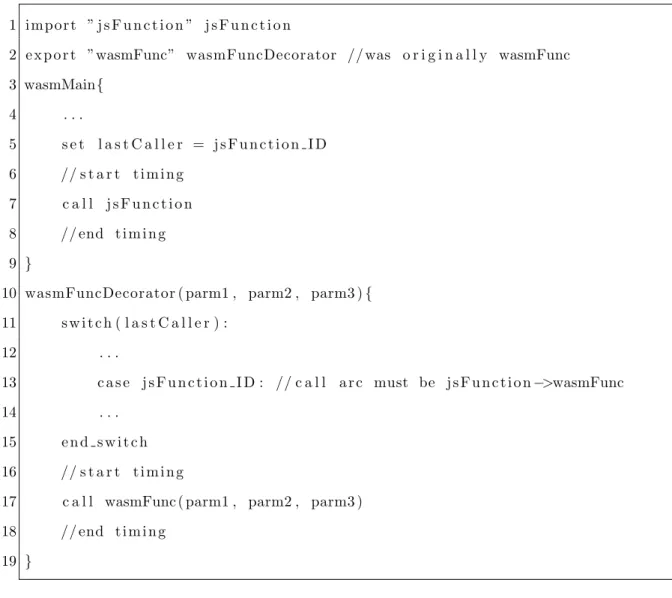
WebAssembly code may call a function that is implemented in the host environment and the host environment could then potentially call back into WebAssembly. The example in Figures 5.5 and 5.6 shows how the call arc from wasmMain→jsFunction (call from WebAssembly to imported function) can easily be determined, but the call arc from jsFunction→wasmFunction(call from host environment to WebAssembly exported function) cannot be predetermined.
replaced with a decorator, so the decorator gets called whenever the host environment calls that exported function. The lastCaller global is set right before making the call to jsFunction. The value of lastCaller will be the ID of jsFunction. Either jsFunction will return without calling back into WebAssembly in which case lastCaller is ignored, or jsFunction will call into the decorator set up for the exported function and the call arc will be resolved.
WasmProf uses the first decorator strategy from Section 5.3.3 for these exported function decorators since generally there are only a handful of exported functions and it can be determined exactly which functions they could possibly come from at instrumentation time. So the set of possible values for lastCaller is relatively small and WasmProf can take advantage of keeping the code in WebAssembly.
There is one special situation when JavaScript initially makes a call into We-bAssembly. The lastCaller global will not have been set. To handle this, lastCaller is assigned the special initial value of 0 which means that the source was “spontaneous” (i.e. it was the start of execution).
1 f u n c j s F u n c t i o n ( ){
2 . . .
3 wasmModule . wasmFunc ( 1 , 2 , 3 ) ; // r e d i r e c t t o wasmFuncDecorator
4 . . .
5 }
1 i m p o r t ” j s F u n c t i o n ” j s F u n c t i o n
2 e x p o r t ”wasmFunc” wasmFuncDecorator // was o r i g i n a l l y wasmFunc
3 wasmMain{
4 . . .
5 s e t l a s t C a l l e r = j s F u n c t i o n I D
6 // s t a r t t i m i n g
7 c a l l j s F u n c t i o n
8 // end t i m i n g
9 }
10 wasmFuncDecorator ( parm1 , parm2 , parm3 ){
11 s w i t c h ( l a s t C a l l e r ) :
12 . . .
13 c a s e j s F u n c t i o n I D : // c a l l a r c must be j s F u n c t i o n−>wasmFunc
14 . . .
15 e n d s w i t c h
16 // s t a r t t i m i n g
17 c a l l wasmFunc ( parm1 , parm2 , parm3 )
18 // end t i m i n g
19 }
Figure 5.6: Example WebAssembly code that imports and calls a
JavaScript function
5.5.2 Indirect Calls
Call arcs cannot be determined at instrumentation time when an indirect call is made. An indirect call indexes into a function table to determine which function to call, and WasmProf cannot determine at instrumentation time what the value of that index will be.
source of the call arc the lastCaller global is used again; right before the indirect call is made the lastCaller variable is set to the current, calling function (which is different than in the case of an imported function call). Now in the decorator, the call arc can be determined using lastCaller as the source and the decorated function as the destination.
Chapter 6 RESULTS
6.1 Experimental Setup
The following sections describe the experimental setup used to collect WasmProf performance metrics. The setup consists of other profilers to which WasmProf is compared, WebAssembly benchmarking programs on which the profilers are tested, and the characteristics of the physical machine the tests were conducted on.
6.1.1 Profiler Comparisons
WasmProf was compared to Wasabi by implementing an equivalent profiler using the Wasabi framework [10]. For the purpose of creating a profiler, the whole set of dynamic analysis hooks provided by Wasabi were not needed, so only call instruction hooks, begin hooks, and return instruction hooks were kept. These hooks cause the Wasabi instrumented binary to call out to a JavaScript function before and after each call instruction. This allows for profiling information to be collected and stored in those JavaScript functions, which are implemented as part of this thesis. The initial implementation using Wasabi relied a lot on JavaScript’s dynamic language features, such as adding fields to objects. This turned out to be very slow, approximately an order of magnitude slower than the WasmProf overhead on some tests. The JavaScript for the Wasabi profiler was rewritten in a manner that was friendlier to the JavaScript compiler so it would perform better (this code is listed in Appendix C) and the implemented Wasabi profiler was used for comparison to WasmProf below.
6.1.2 Benchmark Programs
Performance results are obtained by instrumenting and running the following We-bAssembly programs.
The first set of benchmark programs come from an open source set of simple We-bAssembly programs designed to test the speed of WeWe-bAssembly against JavaScript [19]. All of these programs were originally written in C and are compiled to We-bAssembly using Emscripten [21] (Emscripten was originally a LLVM to JavaScript compiler and is now the defacto standard for compiling C/C++ to WebAssembly/-JavaScript)1. Two main compiler options were specified when compiling the bench-marks: -Os to run compiler optimizations and -g to include debugging information such as function names which are used by WasmProf (the -g flag does disable some of the optimizations that would normally be run with -Os). Some of the similar benchmarks in this set are grouped together and their results averaged for brevity.
The first group of benchmarks consists of simple math and array operation ker-nels. This group includes MultiplyInt, MultiplyDouble, MultiplyIntVec, Multiply-DoubleVec, QuicksortInt, QuicksortDouble, SumInt, and SumDouble.
The second group of benchmarks consists of image manipulation kernels. This group includes ImageConvolute, ImageGrayscale, ImageThreshold.
The third group is actually a single benchmark called Video Marker Detection. The marker detection program checks each frame in a video for a specific marker image and figures out the position of the marker so it can be outlined. This program is a little more complicated than the simple math and image processing kernels, and therefore is a better real-world test of WasmProf’s overhead.
real-world example of where a profiler like WasmProf might be used. Performance numbers for WasmBoy were collected using a benchmarking setup included in the repository. Results were collected with a configuration that runs 1000 frames of an emulation and measures how long it takes to render each frame.
6.1.3 Test Machine
All WebAssembly programs were tested on a Windows 10 computer running an i7-6700k processor and 16GB of RAM. Programs were tested using the stable build of Chrome version 74.0.3729 and the stable build of Firefox version 67.0.0. By default, both Firefox and Chrome reduce their timer precision to prevent fingerprinting. In Firefox this can be disabled to give Firefox a timer precision of 1 microsecond. Chrome does not have a configuration for timer precision that we could find; it has a timer accuracy of 100 microseconds with some pseudo-random jitter added 2. This affects the timing of the profile a little bit, but results relating to the overhead of the profilers in Chrome are still valid because the WebAssembly programs tested take orders of magnitude more time to execute than the timer precision floor.
6.2 Validation Results
We validated that both WasmProf and the equivalent Wasabi profiler met the re-quirements in Section 4 for an instrumenting profiler. Neither profiler interfered with the execution of the original program and both correctly tracked every function call as expected.
6.2.1 Concrete Requirements
To verify the first concrete requirement, that the instrumented program produces the same output as the uninstrumented program, the set of open source
mark programs mentioned in Section 6.1.2 were used. Importantly, all of the bench-marks check the result from their executed WebAssembly program against a refer-ence JavaScript implementation. As expected, both the uninstrumented and instru-mented WebAssembly programs match the reference implementation for all of the benchmarks. WasmProf (and the Wasabi profiler) were also run on a more compli-cated application; the GameBoy emulator WasmBoy[17]. The emulator benchmark still behaved correctly through 2500 frames of emulation using an instrumented We-bAssembly file.
To verify the requirement that all functions are tracked a number of simple, “toy” WebAssembly programs were created with a known exact call path. These pro-grams were instrumented and manually verified to ensure all functions were being tracked. Additionally, when comparing WasmProf against a profiler implementation using Wasabi, the output from the above mentioned WebAssembly Benchmarks were examined and certain functions were spot checked to verify that the number of func-tion calls matched.
6.2.2 Functional Requirements
The first functional requirement is to keep overhead from instrumentation low. This requirement was evaluated by comparing the performance of WasmProf to the perfor-mance of the original code, browsers’ sampling profilers, and a Wasabi profiler. The results from the performance comparison are detailed in Section 6.3.
relative function times. In addition, other programs such as the marker detection benchmark were spot checked to ensure a few of the function times made sense in the context of when they were being called. The top-level function was checked along with a few of its children and no irregularities in the timing were found. Further rigorous analysis of function timing accuracy is left for future work.
6.3 Performance Results
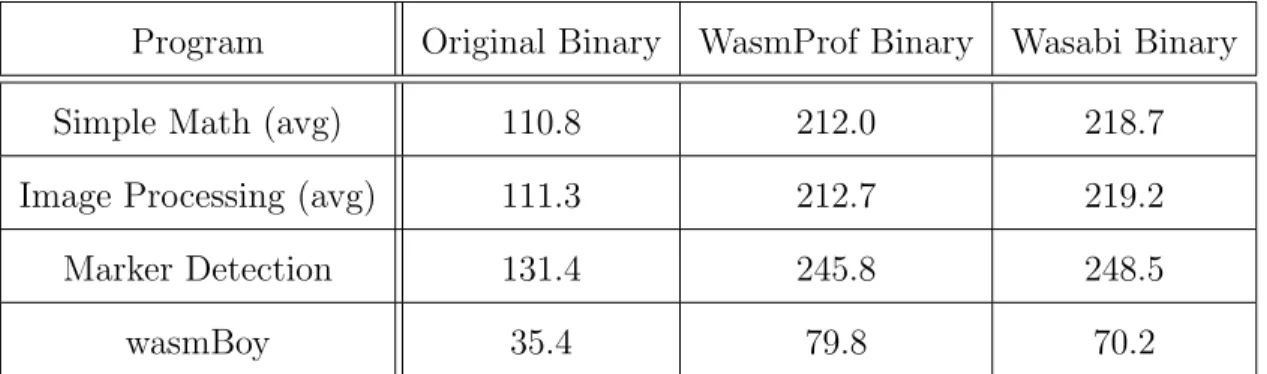
6.3.1 Binary Size Difference
Program Original Binary WasmProf Binary Wasabi Binary
Simple Math (avg) 110.8 212.0 218.7
Image Processing (avg) 111.3 212.7 219.2
Marker Detection 131.4 245.8 248.5
wasmBoy 35.4 79.8 70.2
Table 6.1: Binary size of original program and instrumented programs (in kilobytes)
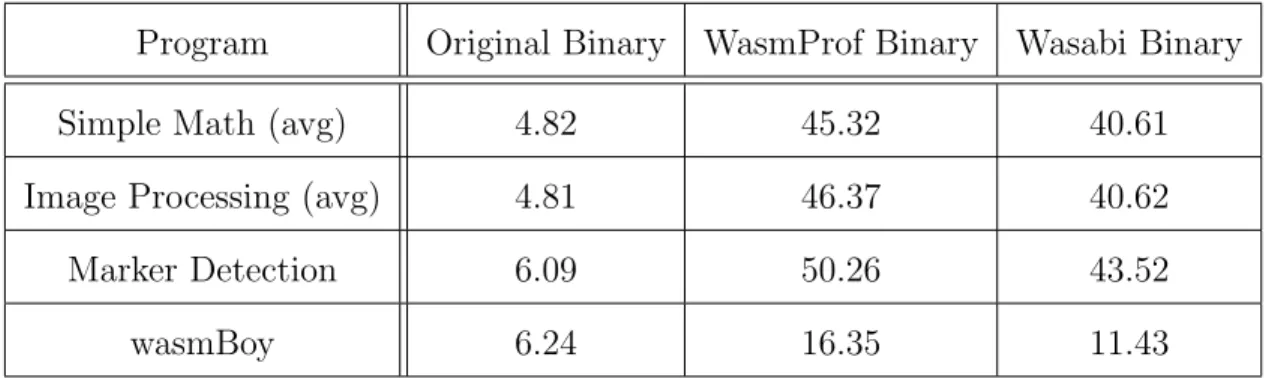
6.3.2 Compilation Difference
The compilation time of the WebAssembly binaries was measured using the JavaScript call
var module = new WebAssembly.Module(buffer);
which synchronously compiles the binary WebAssembly stored in the buffer argument. The generated module object contains the compiled WebAssembly code in a stateless form, meaning it is compiled but has not mapped imports and exports. Compilation time was measured in Firefox 67.0 200 times for each WebAssembly file and averaged to get the following results. Chrome does not allow for synchronous WebAssembly compilation for files over 4kB so it was not used for this test.
Program Original Binary WasmProf Binary Wasabi Binary
Simple Math (avg) 4.82 45.32 40.61
Image Processing (avg) 4.81 46.37 40.62
Marker Detection 6.09 50.26 43.52
wasmBoy 6.24 16.35 11.43
Table 6.2: Compilation time of WebAssembly program (in milliseconds)
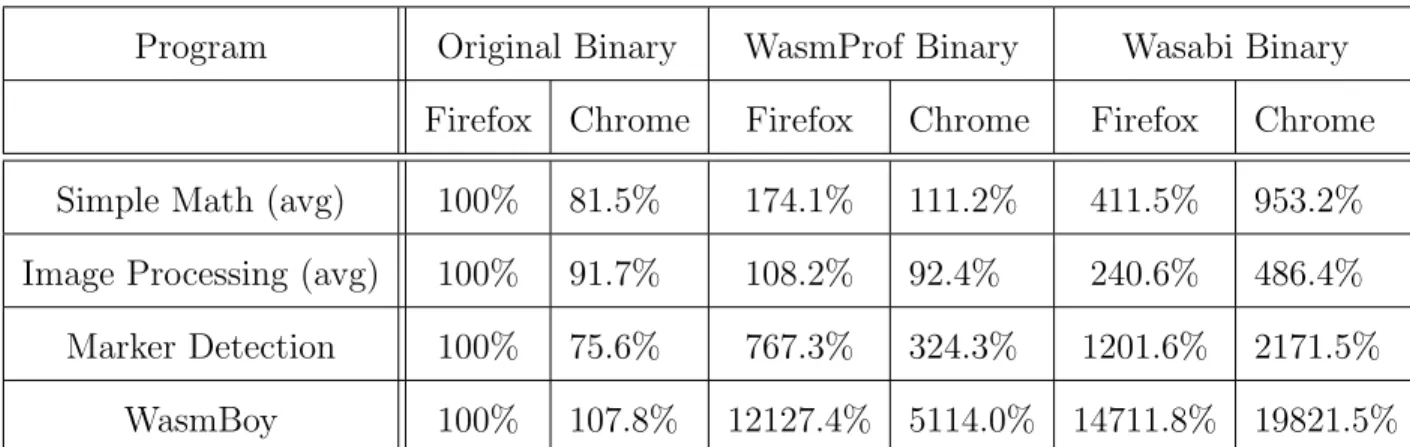
6.3.3 Runtime Difference
Program Original Binary WasmProf Binary Wasabi Binary Firefox Chrome Firefox Chrome Firefox Chrome Simple Math (avg) 100% 81.5% 174.1% 111.2% 411.5% 953.2% Image Processing (avg) 100% 91.7% 108.2% 92.4% 240.6% 486.4% Marker Detection 100% 75.6% 767.3% 324.3% 1201.6% 2171.5%
WasmBoy 100% 107.8% 12127.4% 5114.0% 14711.8% 19821.5%
Table 6.3: Runtime of benchmark programs. Normalized to the runtime of the original WebAssembly binary in Firefox.
The performance overhead of WasmProf varied widely from application to application, but some characteristics of programs that may cause WasmProf to have more overhead can be deduced from the data.
calls to calculate Fibonacci numbers. Programs such as this, with a lot of small functions, suffer from the overhead of getting the start and end times for every single short function call. In an isolated test, the performance of thegetTime function was measured and found to take about 350 nanoseconds and 100 nanoseconds per call for Chrome and Firefox respectively. Adding such overhead to a function call that takes a fraction of that time to execute will naturally lead to high overhead and possibly inconsistent timings. So in general, WasmProf (and the Wasabi profiler) work much better on programs that do not create deep call stacks frequently and that have fewer and longer running functions.
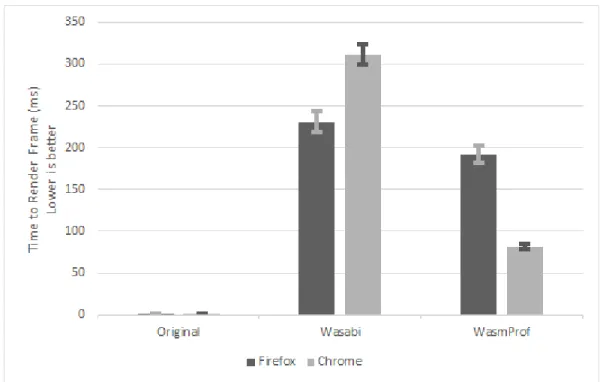
A second important takeaway from the performance results is that WasmProf in-troduces less overhead than does the Wasabi profiler. This validates that the design decisions made to improve the performance of WasmProf actually made a difference. Namely, the choice to track timing data structures as much as possible in WebAssem-bly seems to make a difference over the strategy of always calling out to the host environment to manage data, as Wasabi does. Figure 6.1 shows a graphical com-parison of the WasmProf and Wasabi overhead on the WasmBoy benchmark. The small bars show one standard deviation above and below the average time to ren-der a frame. The graph shows that the performance improvement of WasmProf is statistically significant.
Figure 6.1: WasmBoy performance comparison of WasmProf, Wasabi, and unmodified program
on what made some runs faster in a specific browser, but in general, Chrome seemed to work better with WasmProf instrumented programs.
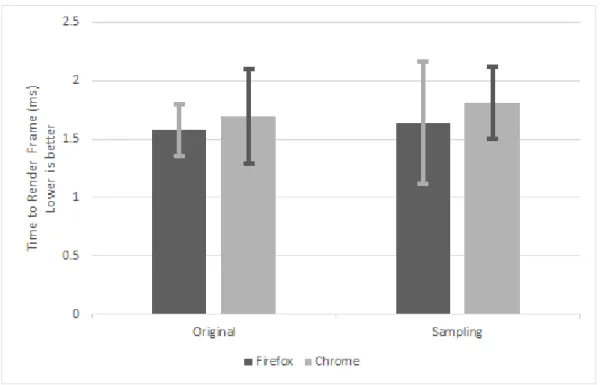
Figure 6.2 shows the performance of the WasmBoy benchmark when running the original program compared to running the original program with the browser’s sampling profiler running. The sampling profiler seems to have a slight performance cost, but nothing that is statistically significant. This does make sense since, as noted in Section 2.3.2, the browser’s runtime is actually always sampling the performance of executing code so it can decide what to optimize further. WasmProf and other instrumenting profilers cannot get anywhere near the low overhead of the sampling profiler. As previously noted, a good analysis workflow will likely include the usage of both the sampling profiler as well as a tool like WasmProf, since they are good at different things.
Figure 6.2: WasmBoy performance comparison of sampling profiler and unmodified program
relative function timings. Given the high overhead, WasmProf cannot be expected to produce function time data that is exactly accurate to the original program; however, as discussed before what is important is the relative timing data of functions compared to each other. These relative function times can still give a picture of the program’s execution even if they are not exactly accurate to the original program. That being said, the performance overhead can skew the function timing results some since the timing of functions near the top of the call graph may be affected by the timing overhead of functions lower in the call graph. This effect is difficult to quantify and a more rigorous quantitative analysis is left to future work.
information at runtime in order to illustrate how easy it is for a user to collect data with the WasmProf tool.
6.4.1 Instrumentation Usage
Instrumenting a WebAssembly program using WasmProf is an easy process that only requires a few commands. The instrumentation procedure is as follows
• Run WasmProf on the original WebAssembly file. WasmProf will create two output files: an instrumented WebAssembly binary and a supporting JavaScript file.
• Replace original WebAssembly file with the instrumented binary.
• Either include the produced JavaScript file in a<script>tag before JavaScript code that instantiates WebAssembly or just prepend the contents of the pro-duced JavaScript file to the beginning of the existing JavaScript.
One thing to note is WasmProf works better with WebAssembly files that have a Names custom section as mentioned in Section 2.3.1. This allows the profiler to print out meaningful function names rather than numeric function IDs.
6.4.2 Runtime Usage
Once a WebAssembly binary is instrumented, runtime usage of WasmProf is very simple as well. The user just runs the program as usual in the browser after including the instrumented WebAssembly file and the supporting JavaScript.
Once the program is running, profiling data can be accessed using the browser’s JavaScript console. First, the following command needs to be run to save a snapshot of the profiler data collected until that point.
var results = window.WasmProf.saveResults();
and will produce an output like the one in Figure 5.4. Similarly, the flat profile can be printed with the commandresults.flatProfile();and will produce an output like the one in Figure 5.3. In either case, obtaining profiler data is simple for the user and could even be scripted to take snapshots of the profiler data at regular intervals. This scheme works well for both single run WebAssembly programs as well as WebAssembly programs that can be run continuously (the WasmBoy emulator can be run continuously but was tested as a single run of 1000 frames).
6.4.3 Output Inaccuracies
In a few of the results, there were inaccuracies in the value reported for self-time on some functions. An example of such an inaccuracy is shown in Figure 6.3, which shows a partial call graph of the Marker Detection benchmark program. The function findMarkersincorrectly reports a negative self-time.
i n d % t i m e s e l f c h i l d r e n c a l l e d name
<s p o n t a n e o u s>
[ 0 ] 9 9 . 9 9 3 . 0 0 0 1 6 7 7 5 . 0 539 d e t e c t
3 . 0 0 0 0 . 0 0 0 539/539 f r e e M a r k e r s [ 4 5 ]
5 . 0 0 0 1 6 7 6 3 . 0 0 0 539/539 ARDetector : : d e t e c t ) [ 1 ]
−−−−−−−−−−−−−−−−−−−−−−−−−−−−−−−−−−−−−−−−−−−−−−−−−−
5 . 0 0 0 1 6 7 6 3 . 0 0 0 539/539 d e t e c t [ 0 ]
[ 1 ] 9 9 . 9 3 5 . 0 0 0 1 6 7 6 3 . 0 0 0 539 ARDetector : : d e t e c t
2 3 2 . 0 0 . 0 0 0 539/539 CV : : g r a y s c a l e [ 2 0 ]
−309.0 9 6 8 . 0 0 0 539/539 ARDetector : : f i n d M a r k e r s [ 1 3 ]
−−−−−−−−−−−−−−−−−−−−−−−−−−−−−−−−−−−−−−−−−−−−−−−−−−
−309.0 9 6 8 . 0 0 0 539/539 ARDetector : : d e t e c t [ 1 ]
[ 1 3 ] 3 . 9 3 −309.0 9 6 8 . 0 0 0 539 ARDetector : : f i n d M a r k e r s
The reason this happens is that WasmProf is making assumptions about the behavior of the program that may not always be true; this can sometimes lead to strange and incorrect timing results. When estimating how much time is spent in a child function, WasmProf assumes that the execution time of that child function does not depend on where it was called from. So if child function c_func is called from parent function p_func 5 times, and c_func is called a total of 10 times (from anywhere) with a cumulative time of 10 seconds, then it is reasonable to estimate that 5 of those seconds can be attributed to the children ofp_func . However, this is not necessarily true and can skew the calculation ofp_func’s self-time. So the timing inaccuracy happens when a function is called from multiple places and the profiler must estimate how much of the function’s overall time to attribute to each of those calls. This case will never occur in programs where a function is never called from multiple other functions (i.e., when a function only ever has one parent in the call graph).
These inaccuracies do take away from WasmProf’s ability to meet the relative timing accuracy functional requirement but not to a great extent. The inaccuracies don’t occur on most functions, and in all cases, the cumulative time for each function is still correct. With this information, a user can deduce why the timing may be inaccurate (called from multiple places) and look at other portions of the data like cumulative time to determine what is going on in the program. The inaccuracy is a downside to using WasmProf, but no good solution exists under the current design. Gprof suffers from a similar problem [7]3. Collecting more complete profiler data rather than call arcs is the only way to completely avoid this problem (see Chapter 7).
Chapter 7 FUTURE WORK
7.1 Profiler Improvements
There are a number of profiler features that are out of the scope of this thesis but that may be interesting to explore in the future. One such feature is to intelligently detect small functions and remove some or all of the instrumentation from those functions. This has a potential benefit of eliminating some of the profiler’s overhead since the instrumentation overhead to function body ratio is very high for small functions. As an example, if a small add function were called millions of times deep in the call graph, that would add a lot of overhead to all the function timings higher up in the call graph and may skew results. Tracking the add function is probably not impor-tant so removing its instrumentation would reduce the overhead. Detecting these types of small functions could either be done manually by the user, automatically at instrumentation time, or dynamically at runtime.
Another potential feature would be call graph splitting. This would allow the profiler to differentiate call arcs not just based on source and destination, but also based on the parameters passed to the call instruction at runtime. This adds more information that the user can use to analyze the execution of their program. However, this adds a lot of runtime complexity to the profiler and will likely result in even higher overhead. Future work could explore the advantages and disadvantages of features such as this.
to the specific nuances of each runtime and further reduce the overhead of the profiled code.
7.2 Profiler with Future WebAssembly Features
WebAssembly is still evolving and many of the details of the language that were lim-itations for WasmProf may change in the future. As WebAssembly develops further and adds features, more work can be done to add new profiling capabilities. The most significant change that could drive future profiler work would be allowing for multiple linear memories in a single WebAssembly module1. With multiple linear memories, a profiler could declare a memory section for its own use and make use of more sophis-ticated dynamic data structures for tracking profiling data, all without affecting the memory of the original program. This would enable additional features such as fully traceable call stacks, rather than just tracking individual call arcs. It would also allow for an implementation of tracking indirect calls that would be completely contained in WebAssembly. This would have the added benefit of eliminating unused globals for call arcs that are never called. It would likely reduce binary size overhead and it would be interesting for future work to examine how using WebAssembly memory vs WebAssembly globals affects profiler performance.
Another feature that is about to be added to WebAssembly is threading 2. With the addition of threads, there is corresponding future work to be done in order for an instrumenting WebAssembly profiler to track function calls across every thread. This would add some complexity and race condition concerns to the profiler but should be able to be implemented in a similar manner as WasmProf.
Finally, as WebAssembly develops the runtime environments will get better and better. Improvements in runtime optimizations, faster WebAssembly to JavaScript
1https://github.com/WebAssembly/design/blob/master/FutureFeatures.md
calls, and faster access to system resources such as timers could all aid in reducing the overhead of an instrumenting profiler such as WasmProf.
7.3 Other Host Environments
Chapter 8 CONCLUSION
This thesis presented WasmProf, an instrumenting profiler for WebAssembly. Wasm-Prof seeks to fill a gap in the spectrum of tools available for analyzing the performance of WebAssembly applications. Sampling profilers exist in all major browsers to sup-port analyzing the performance of both JavaScript and WebAssembly code. These built-in profilers are readily available and have very little performance overhead, but they do not capture information about how many times a function is called and their statistical nature means it is possible to miss functions. On the other extreme, there has been some research into developing dynamic analysis tools for WebAssembly, most notably Wasabi [10]. Wasabi is able to instrument every WebAssembly instruction and does not miss any information. However, it relies entirely on calls out to the host environment to do anything useful with the information. This leads to high runtime overhead and requires the developer to include extra code to implement the Wasabi framework as a profiler. In the middle sits WasmProf, with the goal of instrumenting WebAssembly code to collect all information about function call counts and timing with as little overhead as possible while being easy to use.
The design of WasmProf was largely driven by this goal, as well as the necessity that it works within the constraints of WebAssembly’s current specification. We-bAssembly is only at version 1.0 and there are a lot of constraints (such as how memory is managed) that force WasmProf toward a design that tries to do as much work during the instrumentation phase in order to simplify the behavior of the in-strumentation code during runtime. The resulting profiler collects information about call arcs and outputs data much like the famous profiler gprof [7].
general the runtime performance of WasmProf matched or beat an implementation of a similarly capable profiler written using the Wasabi framework.
BIBLIOGRAPHY
[1] K. Basques and M. Kearney. Speed up javascript execution — tools for web developers — google developers, May 2019.
[2] Binaryen: Compiler infrastructure and toolchain library for WebAssembly, in C++, May 2019. https://github.com/WebAssembly/binaryen.
[3] W. Binder, J. Hulaas, and P. Moret. Advanced java bytecode instrumentation.
In Proceedings of the 5th international symposium on Principles and
practice of programming in Java, pages 135–144. ACM, 2007.
[4] L. Clark. A crash course in just-in-time (jit) compilers mozilla hacks - the web developer blog, Feb 2017.
[5] L. Clark. What makes webassembly fast? mozilla hacks - the web developer blog, Feb 2017.
[6] W. Fu, R. Lin, and D. Inge. Taintassembly: Taint-based information flow control tracking for webassembly. CoRR, abs/1802.01050, 2018.
[7] S. L. Graham, P. B. Kessler, and M. K. Mckusick. Gprof: A call graph execution profiler. In Proceedings of the 1982 SIGPLAN Symposium on
Compiler Construction, SIGPLAN ’82, pages 120–126, New York, NY,
USA, 1982. ACM.
[8] A. Haas, A. Rossberg, D. L. Schuff, B. L. Titzer, M. Holman, D. Gohman, L. Wagner, A. Zakai, and J. Bastien. Bringing the web up to speed with webassembly. InProceedings of the 38th ACM SIGPLAN Conference on
Programming Language Design and Implementation, PLDI 2017, pages
[9] C. Hammacher. Liftoff: a new baseline compiler for webassembly in v8, Aug 2018.
[10] D. Lehmann and M. Pradel. Wasabi: A framework for dynamically analyzing webassembly. CoRR, abs/1808.10652, 2018.
[11] S. Liang and D. Viswanathan. Comprehensive profiling support in the java virtual machine. 05 1999.
[12] N. Nethercote and J. Seward. Valgrind: A framework for heavyweight dynamic binary instrumentation. SIGPLAN Not., 42(6):89–100, June 2007.
[13] Profiling with the firefox profiler, Apr 2019. https://developer.mozilla.org/en-US/docs/Mozilla/Performance/Profiling with the Built-in Profiler.
[14] A. Rossberg. Webassembly core specification. W3C working draft, W3C, Sept. 2018. https://www.w3.org/TR/2018/WD-wasm-core-1-20180904/.
[15] P. Spiess and J. Swift. Webassembly: A new hope, 2017.
https://pspdfkit.com/blog/2017/webassembly-a-new-hope/.
[16] M. Trivellato. Webassembly load times and performance, Sep 2018. https://blogs.unity3d.com/2018/09/17/webassembly-load-times-and-performance/.
[17] A. Turner. WasmBoy, May 2019. https://github.com/torch2424/wasmboy. [18] Wasmtime: a WebAssembly Runtime., May 2019.
https://github.com/CraneStation/wasmtime.
[20] J. Whaley. A portable sampling-based profiler for java virtual machines. In
Proceedings of the ACM 2000 conference on Java Grande, pages 78–87.
Citeseer, 2000.
[21] A. Zakai. Emscripten: An llvm-to-javascript compiler. In Proceedings of the ACM International Conference Companion on Object Oriented
Programming Systems Languages and Applications Companion, OOPSLA
APPENDICES
Appendix A
EXAMPLE OF INSTRUMENTED WEBASSEMBLY IMPORTING REQUIRED FUNCTIONS
1 ( t y p e $ t 1 ( f u n c ( r e s u l t f 6 4 ) ) )
2 ( t y p e $ t 2 ( f u n c ) )
3 ( t y p e $ t 3 ( f u n c ( param i 3 2 i 3 2 i 3 2 f 6 4 ) ) )
4 ( i m p o r t ” p r o f ” ” getTime ” ( f u n c $ p r o f . getTime ( t y p e $ t 1 ) ) )
5 ( i m p o r t ” p r o f ” ” c l e a r R e s u l t s ” ( f u n c $ p r o f . c l e a r R e s u l t s ( t y p e $ t 2 ) ) )
6 ( i m p o r t ” p r o f ” ” addArcData ” ( f u n c $ p r o f . addArcData ( t y p e $ t 3 ) ) )
7 ( i m p o r t ” p r o f ” ” s e t A r c D a t a ” ( f u n c $ p r o f . s e t A r c D a t a ( t y p e $ t 3 ) ) )
Appendix B
PROGRAM TO VALIDATE RELATIVE FUNCTION TIMING OF WASMPROF
B.1 Validation Code
1#define MAIN ITERATIONS 1 0 0 0 0 0 0 0
2#define HALF ITERATIONS (MAIN ITERATIONS/ 2 )
3#define QUARTER ITERATIONS (MAIN ITERATIONS/ 4 )
4
5 i n t add (i n t a , i n t b )
6 {
7 return a + b ;
8 }
9
10 // f u n c t i o n w h i c h l o o p s many t i m e s
11 i n t f m a i n 1 ( )
12 {
13 i n t sum = 0 ;
14 f o r(i n t i = 0 ; i < MAIN ITERATIONS ; i ++){
15 sum += add ( 1 , i ) ;
16 }
17 return sum ;
18 }
19
20 // i d e n t i c a l t o f m a i n 1 b u t i t e r a t i n g t h e o t h e r way
21 i n t f m a i n 2 ( )
22 {
23 i n t sum = 0 ;
24 f o r(i n t i = MAIN ITERATIONS−1; i >= 0 ; i−−){
25 sum += add ( 1 , i ) ;
26 }
28 }
29
30 // d o e s h a l f t h e i t e r a t i o n s o f f m a i n
31 i n t f h a l f (i n t s t a r t )
32 {
33 i n t sum = s t a r t ;
34 f o r(i n t i = 0 ; i < HALF ITERATIONS ; i ++){
35 sum += add ( 1 , i ) ;
36 }
37 return sum ;
38 }
39
40 // d o e s q u a r t e r t h e i t e r a t i o n s o f f m a i n
41 i n t f q u a r t e r (i n t s t a r t )
42 {
43 i n t sum = s t a r t ;
44 f o r(i n t i = 0 ; i < QUARTER ITERATIONS ; i ++){
45 sum += add ( 1 , i ) ;
46 }
47 return sum ;
48 }
49
50 // r u n s f h a l f t w i c e ( s h o u l d b e a b o u t t h e same a s f m a i n )
51 i n t f m a i n 3 ( )
52 {
53 return f h a l f ( 1 ) + f h a l f ( 2 ) ;
54 }
55
56 // r u n s f q u a r t e r 4 t i m e s ( s h o u l d b e a b o u t t h e same a s f m a i n )
60 }
61
62 // r u n s f q u a r t e r t w i c e ( s h o u l d b e a b o u t t h e same a s f h a l f )
63 i n t f h a l f 2 ( )
64 {
65 return f q u a r t e r ( 1 ) + f q u a r t e r ( 2 ) ;
66 }
67
68 //sum i s t h e r e t o p r e v e n t −O1 o p t i m i z a t i o n s from r e m o v i n g f u n c t i o n c a l l s
69 i n t main (i n t a r g c , char ∗∗a r g v )
70 {
71 i n t sum = 0 ;
72 // t i m i n g o f f i r s t t h r e e s h o u l d match
73 sum += f m a i n 1 ( ) ;
74 sum −= f m a i n 2 ( ) ;
75 sum += f m a i n 3 ( ) ;
76 sum −= f m a i n 4 ( ) ;
77
78 // t i m i n g s h o u l d b e a b o u t h a l f o f f i r s t o n e s
79 sum += f h a l f ( 0 ) ;
80 sum −= f h a l f 2 ( ) ;
81
82 // t i m i n g s h o u l d b e a b o u t a q u a r t e r o f f i r s t o n e s
83 sum −= f q u a r t e r ( 0 ) ;
84
85 return sum ;
86 }
B.2 WasmProf Validation Output
C a l l Graph :
<s p o n t a n e o u s>
[ 0 ] 1 0 0 . 0 0 . 0 0 0 3 6 6 6 3 . 0 0 0 1 main
3 5 3 6 . 0 0 0 3 4 6 7 . 0 0 0 1/1 f m a i n 1 [ 4 ]
3 5 0 9 . 0 0 0 3 4 7 9 . 0 0 0 1/1 f m a i n 2 [ 5 ]
5 2 2 3 . 0 0 0 5 2 8 8 . 0 0 0 1/3 f h a l f [ 3 ]
6 1 3 0 . 0 0 0 6 0 3 1 . 0 0 0 1/7 f q u a r t e r [ 2 ]
0 . 0 0 0 6 9 5 3 . 0 0 0 1/1 f m a i n 3 [ 6 ]
0 . 0 0 0 6 9 5 3 . 0 0 0 1/1 f m a i n 4 [ 7 ]
0 . 0 0 0 3 4 7 7 . 0 0 0 1/1 f h a l f 2 [ 8 ]
−−−−−−−−−−−−−−−−−−−−−−−−−−−−−−−−−−−−−−−−−−−−−
3 4 7 9 . 0 4 8 0 . 0 0 0 10000 k /52500 k f m a i n 1 [ 4 ]
3 4 7 9 . 0 4 8 0 . 0 0 0 10000 k /52500 k f m a i n 2 [ 5 ]
5 2 1 8 . 5 7 1 0 . 0 0 0 15000 k /52500 k f h a l f [ 3 ]
6 0 8 8 . 3 3 3 0 . 0 0 0 17500 k /52500 k f q u a r t e r [ 2 ]
[ 1 ] 4 9 . 8 2 1 8 2 6 5 . 0 0 0 0 . 0 0 0 52500 k add
−−−−−−−−−−−−−−−−−−−−−−−−−−−−−−−−−−−−−−−−−−−−−
3 5 0 2 . 8 5 7 3 4 4 6 . 2 8 6 4/7 f m a i n 4 [ 7 ]
1 7 5 1 . 4 2 9 1 7 2 3 . 1 4 3 2/7 f h a l f 2 [ 8 ]
8 7 5 . 7 1 4 8 6 1 . 5 7 1 1/7 main [ 0 ]
[ 2 ] 3 3 . 1 7 6 1 3 0 . 0 0 0 6 0 3 1 . 0 0 0 7 f q u a r t e r
4 5 6 6 2 5 0 0 0 0 0 0 . 0 0 0 17500 k /52500 k add [ 1 ]
−−−−−−−−−−−−−−−−−−−−−−−−−−−−−−−−−−−−−−−−−−−−−
3 4 8 2 . 0 0 0 3 5 2 5 . 3 3 3 2/3 f m a i n 3 [ 6 ]
1 7 4 1 . 0 0 0 1 7 6 2 . 6 6 7 1/3 main [ 0 ]
[ 3 ] 2 8 . 6 7 5 2 2 3 . 0 0 0 5 2 8 8 . 0 0 0 3 f h a l f