MANAGING DEMAND FOR SCARCE WATER RESOURCES: AN EVALUATION OF CURRENT APPROACHES
Ahmed Rachid El-Khattabi
A dissertation submitted to the faculty at the University of North Carolina at Chapel Hill in partial fulfillment of the requirements for the degree of Doctor of Philosophy in the
Department of City and Regional Planning in the College of Arts and Sciences.
Chapel Hill 2020
© 2020
ABSTRACT
Ahmed Rachid El-Khattabi: Managing Demand for Scarce Water Resources: An Evaluation of Current Approaches
(Under the direction of T. William Lester)
Increasing water scarcity due to droughts and competition for water resources is threat-ening the ability of cities all over the world, even those that are well-resourced, to provide their residents with basic water services. My three-paper dissertation addresses three different areas of intervention aimed at addressing water scarcity.
In my first paper, I address incentives to create technologies that address water scarcity. Concerns of a “deficit” of water-related technologies question the widely held belief that we can innovate our way out of water crises. In the context of the United States, I exploit temporal and spatial variation in the incidence of drought and the implementation of water technology clusters to explain changes in water-related patenting activity. I find that patenting activity does not increase following droughts, which suggests few incentives to innovate exist. I do find that water technology clusters boost water-related innovation, suggesting that additional policy interventions may be warranted.
novel measure of local hydrological stress. Contrary to prior research, I find households with presumably strong preferences for irrigation are no less price sensitive than other households.
ACKNOWLEDGMENTS
I would like to acknowledge the members of my dissertation committee members as their comments, insights, and suggestions have been instrumental in formulating and strengthening various aspects of my work. I would like to especially thank Professor Andrew Yates for helping me develop a much deeper appreciation for the amount of time and energy needed to produce a well-written article, lessons that will certainly serve me well throughout my career. I would also like to thank Professor Dale Whittington for both his critical feedback that has strengthened my work as well as thoughtful career advice. Most importantly, I would like to thank my dissertation committee chair, Professor T. William Lester, to whom I owe a huge debt of gratitude. This dissertation would not have been possible but for his guidance and tireless, steadfast commitment to the “get it done” plan. I will always be grateful for his mentorship and hope to pay my debt forward some day.
Beyond my committee, I would like to acknowledge the invaluable support from several faculty members in the Department of City and Regional Planning and the Department of Economics at UNC. I would like to especially thank Professors Roberto Quercia, Todd BenDor, Lutz Hendricks, Neville Francis, Helen Tauchen, and the late Tiago Pires for their support and encouragement. I would also like to thank Professor Brian McManus for his mentorship and his role co-supervising part of my dissertation work. I am greatly appreciative of this his thoughtful comments, feedback, and advice.
Among others, I thank soon to be Drs. Julien Isnard, Matt Wilson, Atticus Jaramillo, Allison Lacko, Kyle Onda, Saumitra Sinha, and Drs. Sasha Neumenko and Aisling Winston for their intellectual support as well as excellent proofreading.
PREFACE
“We will never miss the water till the stream gets dry. It is not like human nature to prize highly that which costs us nothing, but the taking.”
-S.J. Rosamund, 1905
In 1994/95, I experienced firsthand one of Morocco worst droughts on record. In Tangier, my hometown, reservoir levels fell to about 10% of overall capacity; levels so low that desperate measures had to be taken. Four tankers (bateaux-citernes) were chartered to barge in from Jorf Lasfar, a port city 461km (286mi) away. For seven months, city planners rationed water, limiting running water to only three days a week for four hours on each of those days. At home and at school, water dominated all aspects of everyday life. I can still recall helping to fill up empty bottles at every possible opportunity so that my family could wash, cook, drink, and clean. Even then, I realized that this event made an indelible mark on my way of thinking and living. Water insecurity is all too real and traumatic. To this day, my family still keeps an emergency supply of water stockpiled for fear of future water cutoffs or shortages despite improvements in water management and infrastructure.
for granted. In developed countries, people expect water to come out of their faucets 24/7 without giving a second thought to where the water comes from, where it goes, and with little knowledge of the costs associated with its provision. More importantly, it seems as if people are willing to use water with an almost callous disregard even when faced with the realization that it is a scarce resource. Not long afterwards, there was intense concern over the effect that a drought was having on the largely agriculture-based economy back in Morocco. Though 2014 had been an abundantly wet year, I remember the calls for national prayers for rain and predictions that 2016 would be as dry as 1994/95 during one of my visits to Morocco in 2015. By late 2016, Tétouan—a city only 63km (39mi) away from Tangier—had to resort to rationing water.
Though droughts are an increasingly important reason why water resources are scarce, they are not the only cause for concern. Notably, cities all over the world are growing thirstier due to rapid urbanization and economic development. As a result, cities are constantly seeking out new water supplies and often competing over water resources to keep up with demand. Traditional strategies that focus purely on managing water supplies are therefore not enough. It is increasingly important to explore options that manage the demand for water and delay the need for expensive capacity expansions, rather than increasing capacity to meet demand.
aware of how to manage water resource and minimize conflict in the context of increasing urban growth and climate change.
The foresight that I had about going into this field was borne out a few months before I defended my dissertation proposal in March 2018. On January 19th, 2018, the Western Cape Water Supply District—the water utility serving the city of Cape Town, South Africa—announced that it was coming dangerously close to running out of water due to drought. Experts predicted that the city would run out of municipal water (referred to in the media as “Day Zero”) in a matter of months. Cape Town’s near brush with what is arguably every water utility manager’s worst nightmare serves a powerful reminder that increasing water scarcity is threatening the ability of cities all over the world, even those that are well-resourced, to provide their residents with basic water services.
I structure my dissertation as a series of three papers on distinct policies related to water demand management. My aim is highlight successes and failures in current approaches to provide guidance in the years to come.
if we are to innovate our way out of water scarcity, we must first understand what drives—or does not drive—the creation of new water technologies. An often-cited concern is that water resources are underpriced because prices are not set through the market but through highly political processes. In the absence of market prices, an important question is whether existing institutional mechanisms signal scarcity, a necessary step for encouraging innovation.
This paper contributes to the literature in two ways. First, I shed light on the extent to which water scarcity prompts innovative activity, using droughts as observable and exogenous events that generate water scarcity. I empirically test this by examining patenting activity following droughts. Second, I assess the effectiveness of a public policy intervention, the establishment of a Water Technology Innovation Clusters Initiative, as a potential solution to increase water-related technological innovation. Overall, I find evidence that patenting activity does not change following the incidence of droughts, suggesting that water-scarcity alone does not induce more innovation. This finding supports the notion that there is a lack of innovation in the water sector. I also find evidence to suggest that water technology clusters increase overall patenting activity. Together, these findings suggest that additional policy interventions may be warranted to support innovation in the water sector.
are to be used effectively as a demand management tool, water utilities need to analyze their data to understand the effect of pricing policies.
This study contributes to the rich literature on water demand in two ways. First, I define households in terms of past usage and wealth simultaneously instead of in isolation to underscore the fact that both dimensions are necessary for understanding household responses, but neither is sufficient by itself. For example, households with similar wealth levels may have different preferences for outdoor water usage, or households with comparable levels of past usage may respond to changes in price differently given the resources at their disposal. Second, I estimate price responses for single family residential households under price variation that is much larger than typically observed in studies of the water sector. I use a highly detailed panel of households’ monthly water usage in Chapel Hill and Carborro, NC from 1999-2005 with a change in pricing policy that generated price changes of about 40%. To my knowledge, no other study has conducted a household-level longitudinal analysis for water under the same magnitude of price variation. Contrary to previous studies, I find that households that are most likely to irrigate are no less price-sensitive than other households. If anything, the point estimates suggest that heavy-usage households are more price elastic than households that are less likely to irrigate. These results provide an optimistic assessment of the utilities’ ability to use prices to reduce water consumption by households with high-usage.
rely on mandates that require water utilities to conserve. Mandates promote conservation through two mechanisms: (1) increasing political acceptance of local conservation efforts by shifting some of the responsibility from local water utilities to the state agency, and (2) the threat of fines and potential legal action against the water utility for noncompliance. To pursue conservation, water utilities implement one or more strategies to manage demand, including public awareness campaigns, rebates for turf replacement or water efficient fixtures, mandatory watering restrictions (caps on usage), and pricing strategies. Conservation is therefore ultimately a result of reductions made by water utility customers. The two-part nature of the problem presents a challenge for states because they often do not observe water utilities actions, or if they do, may not easily interpret them as water utilities implementing the same strategy may do so with varying degrees of “implementational intensity” (Halich and Stephenson, 2009).
TABLE OF CONTENTS
LIST OF TABLES . . . xvii
LIST OF FIGURES . . . xix
LIST OF ABBREVIATIONS . . . 1
IS DROUGHT “IN THE AIR”? EFFECT OF DROUGHTS ON WATER-RELATED PATENTING ACTIVITY . . . 1
1.1 Introduction . . . 1
1.2 Conceptual Framework . . . 5
1.3 Data . . . 12
1.3.1 Hydrological Drought . . . 12
1.3.2 Patent Data . . . 13
1.3.3 Water Technology Clusters. . . 17
1.3.4 Additional Data . . . 20
1.4 Estimation . . . 22
1.5 Conclusion . . . 30
HETEROGENEOUS RESPONSE TO PRICE: EVIDENCE FROM RESIDEN-TIAL WATER CONSUMERS . . . 33
2.1 Introduction . . . 33
2.2 Data . . . 37
2.2.1 Water Usage Data . . . 37
2.2.2 Water Prices . . . 38
2.2.4 Usage Profiles and Wealth . . . 41
2.2.5 Environmental Conditions . . . 45
2.3 Water Demand Estimation . . . 47
2.4 Additional Evidence on Usage Profiles . . . 53
2.5 Conclusion . . . 57
COMPLIANCE WITH STATE MANDATES FOR WATER CONSERVATION: THE ROLE OF SOCIAL OPPROBRIUM . . . 59
3.1 Introduction . . . 59
3.2 Conceptual Framework . . . 64
3.2.1 Water Utility Incentives . . . 68
3.2.2 Household Incentives . . . 70
3.2.3 Testable Predictions . . . 71
3.3 Data . . . 74
3.3.1 State Water Resource Control Board . . . 74
3.3.2 Urban Water Supply Plans . . . 80
3.3.3 Drought Conditions . . . 83
3.4 Estimation . . . 83
3.5 Conclusion . . . 88
Appendices . . . 91
Appendix Is Drought “in the Air”? . . . 91
Appendix 1.1 Innovation Results . . . 91
Appendix 1.2 Control Function Exclusion Restrictions . . . 93
Appendix 1.3 Patent Codes . . . 95
Appendix 1.4 Water Technology Clusters Locations and Establishment Dates . 99 Appendix 1.5 Engineering Departments with a Water Specialization . . . 101
Appendix Heterogeneous Response to Price . . . 106
Appendix 2.1 Deriving the Water Stress Index . . . 106
Appendix 2.2 Demand Estimation Results . . . 109
Appendix 2.3 Command-and-Control (CAC) Restrictions . . . 115
Appendix 2.4 Sensitivity Analysis: Usage Profile Assignment . . . 116
Appendix 2.5 Water Stress vs. Traditional Environmental Controls . . . 119
Appendix 2.6 Transitions in Usage Profiles By Wealth . . . 126
LIST OF TABLES
Table 1.3.1 Drought Classification using Palmer Drought Severity Index . 12
Table 1.3.2 Drought Characteristics . . . 14
Table 1.4.3 Control Function Exclusion Restrictions . . . 27
Table 2.2.1 Usage and Parcel Characteristics . . . 45
Table 2.4.2 Usage Profile Shares . . . 55
Table 2.4.3 Transitions in Usage Profiles . . . 56
Table 3.2.1 Typology of Service Areas: Effort Exerted by Water Utilities and Reporting by Households . . . 73
Table 3.3.2 Production Savings Achieved Relative to Conserva-tion Targets (June 2015-May 2016) . . . 76
Table 3.4.3 Results for Cumulative Production Savings . . . 89
Table 3.4.4 Results for Production Savings Relative to Assigned Conservation Target . . . 90
Appendix Table 1.1.1 Main Results . . . 91
Appendix Table 1.1.2 Main Results without spillover effects . . . 92
Appendix Table 1.3.1 IPC and CPC Codes for Technologies Aimed at Water Pollution Abatement . . . 95
Appendix Table 1.3.2 IPC and CPC Codes for Technologies Aimed at Water Supply Augmentation . . . 96
Appendix Table 1.3.3 IPC and CPC Codes for Technologies Aimed at Water Conservation . . . 97
Appendix Table 1.4.1 Water Technology Clusters Supported byWater Tech-nology Cluster Initiative. . . 99
Appendix Table 1.4.2 Other Water Technology Clusters Not Supported by Water Technology Cluster Initiative. . . 100
Appendix Table 2.2.1 Main Results . . . 109 Appendix Table 2.2.2 Main results allowing environmental controls to vary
by usage profile but not by wealth . . . 111 Appendix Table 2.2.3 Main results allowing environmental controls to vary
by wealth but not by usage profile . . . 112 Appendix Table 2.2.4 Main results not allowing environmental controls to
vary by wealth or usage profile . . . 113 Appendix Table 2.2.5 Main Results No Heterogeneity . . . 114 Appendix Table 2.4.1 Usage and Parcel Characteristics, Different Reference Year . . . 116 Appendix Table 2.4.2 Main Results, Different Reference Year . . . 117 Appendix Table 2.4.3 Transition in Usage Profiles, Different Reference Year . . . 118 Appendix Table 2.5.1 Goodness of Fit Results. . . 120 Appendix Table 2.5.2 Main Results with Ad hoc Collection 1 instead of
Block Group Water Stress . . . 122 Appendix Table 2.5.3 Main Results with Ad hoc Collection 2 instead of
Block Group Water Stress . . . 123 Appendix Table 2.5.4 Main Results with Ad hoc Collection 3 instead of
Block Group Water Stress . . . 124 Appendix Table 2.5.5 Main Results with Regional Level Water Stress
LIST OF FIGURES
Figure 1.3.1 Water-Related Patenting Activity Over Time . . . 17
Figure 1.4.2 Water-Related Patenting Activity in MSAs that do and do not Establish a Water Technology Cluster . . . 25
Figure 1.4.3 Patenting Activity after Drought . . . 28
Figure 1.4.4 Effect of Water Technology Cluster on Patenting Activity . . . . 29
Figure 1.4.5 Patenting Activity after Drought in MSA with Water Technology Cluster . . . 30
Figure 2.2.1 Seasonal Prices and CAC Restrictions . . . 40
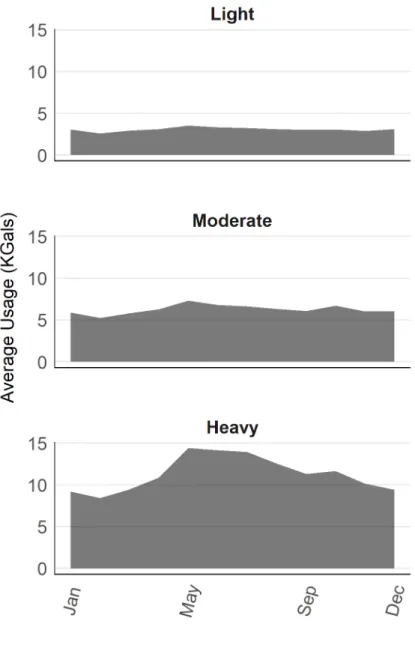
Figure 2.2.2 Usage Profiles from Clustering . . . 43
Figure 2.3.3 Water Price Elasticities . . . 51
Figure 2.3.4 Effect of Environmental Factors on Water Usage . . . 52
Figure 2.3.5 Effect of Command and Control Policies on Water Usage . . . . 53
Figure 3.2.1 Illustration of Double Principal-Agent Model . . . 68
Figure 3.3.2 Reductions in Water Production . . . 75
Figure 3.3.3 Cumulative Savings Relative to Conservation Targets . . . 77
Figure 3.3.4 Number of complaints received per capita and the number of cases followed up by water utilities . . . 80
Appendix Figure 1.6.1 Impact of Water Technology Clusters on Patenting Activity . 104 Appendix Figure 1.6.2 Impact of Water Technology Clusters on Patenting Activity: 50mi radius . . . 105
Appendix Figure 1.6.3 Impact of Water Technology Clusters on Patenting Activity: 100mi radius . . . 105
Appendix Figure 2.1.1 Water Stress During the 2002 Drought . . . 108
PAPER 1: IS DROUGHT “IN THE AIR"? EFFECT OF DROUGHTS ON WATER-RELATED PATENTING ACTIVITY
1.1
Introduction
Technological innovation has played a pivotal role in addressing resource scarcities by relaxing binding resource constraints for resources such as food, copper, iron, nickel, silver, tin, coal, and natural gas through the development of new processes that enable the use of substitutes, improve efficiency, or enable access to untapped resources (e.g. Krautkraemer, 2005). In this context, longstanding concerns of a “deficit of innovation" in the water sector have led scientists and policymakers to question whether technology can deliver “solutions commensurate to the impending stresses on urban water systems" (Kiparsky et al.,
2013).1 Given the substantial welfare consequences associated with water shortages,2 these concerns prompted the U.S. Environmental Protection Agency (EPA) to spearhead theWater Technology Cluster Initiative in 2011 to identify and support local efforts with funding and
other types of assistance.3
1Stressors include increased demand (Averyt et al., 2013), uncertain precipitation patterns (Milly
et al., 2008), aging infrastructure (Kalogo, Monteith and Eng, 2008), and contamination of water supplies (Addams et al., 2009).
2Water scarcity negatively impacts energy production (Gleick, 1994; Spang et al., 2014), food
security (Schmidhuber and Tubiello, 2007), and public health (Haines et al., 2006).
3Similar initiatives have since been launched in other parts of the world (e.g. Water Test Network
In this paper, I analyze the extent to which water scarcity prompts innovative activity by treating droughts as observable and exogenous events that generate water scarcity and patent data as an observable measure that proxies for innovative activity and R&D expenditure. In addition, I assess the impact of the Water Technology Innovation Clusters Initiative as a public policy solution aimed at increasing water-related technological innovation. I construct a panel data set that allows me to describe changes in regional water-related patenting activity using variation in the timing and geographic location in both the incidence of droughts and establishment of water technology clusters. Overall, I find evidence that patenting activity does not change following the incidence of droughts, suggesting that water-scarcity alone does not induce more innovation. This finding supports the notion that there is a lack of innovation in the water sector.4 I also find that the support provided by the EPA initiative significantly increased water-related patenting activity. Together, these findings suggest that additional policy interventions may be warranted to support innovation in the water sector.
Innovating our way out of water scarcity requires inventing (and deploying) appropriate technologies quickly enough to address continuously emerging needs.5 Specifically, arguments that “necessity is the mother of invention" hinge on our ability to recognize scarcity quickly enough to act. Notably, the economic argument rests on the assumption that scarcity drives prices upwards. These increased prices then signal to innovators that they can make a profit by inventing new processes that enable the use of substitutes, improve efficiency, or enable access to untapped resources (e.g. Shumpeter, 1934). Prices in the water sector, however, are not set through the market but instead through highly political processes. As a result, water
4The “water sector" is used broadly to describe actors who participate and are dependent on water
for day-to-day operations such as utilities, end-users, firms, and others.
5Adoption of water-related technologies is a significant barrier to innovation. Adoption of technologies
resources are often under-priced (e.g. Renzetti, 1999; Elnaboulsi, 1999; Timmins, 2002). The inability to price water using market-based principles is often cited as a reason for the lack of water-related innovative activity. In the absence of market prices, the question is whether other institutional mechanisms encourage innovation.
Some scholars have posited that the threat of scarcity itself may be sufficient to spark human ingenuity (e.g. Boserup, 1981; Simon and Bartlett, 1985). In support of this argument, previous droughts over the past few decades garnered significant media attention and triggered significant policy changes (Wiener, Pulwarty and Ware, 2016). For example, several droughts (1976-77, 1988, 1998, 2000-2004, 2011-12) have led to requirements to create water shortage response plans, long-range water plans, land-use integration policies, and other frameworks to better manage water supplies. Droughts have also spurred interest in water markets6 and crop insurance.7 With respect to technological innovation, previous studies have documented high financing gaps (Krozer et al., 2010) and low rates of water-related patenting activity (Ajami, Thompson and Victor, 2014). Little is known, however, on the dynamics of innovation in the water sector.8
I contribute to body of work on environmental innovation by shedding light on the inventive phase (i.e. the timing of inventions) of water-related technologies. This paper also
6The first major economic investigation of water marketing and the property right to water occurred
in the context of policy debate over a state and federal involvement in a California water project in the middle of a drought (Hirshleifer, De Haven and Milliman, 1969).
7In 2014, for example, the USDA announced additional targeted assistance for areas affected by the
most extreme and exceptional drought, namely in California and Texas (USDA, 2014). The USDA manages several insurance programs related to drought (USDA, n.d.).
connects the environmental innovation literature to the growing literature on the economic effects of natural disasters (Becerra, 2012; Kellenberg and Mobarak, 2011; Miao and Popp, 2014), further contributing to the literature on endogenous technological change by assessing the impact of droughts as a stimulus for innovation (Miao and Popp, 2014).
My approach contrasts with previous work on environmental innovation by examining innovative activity through the lens of regions instead of at the firm level (e.g. Hemmelskamp, 1999; Horbach, 2008; Di Stefano, Gambardella and Verona, 2012).9 In doing so, I bridge the literature on environmental innovation to the body of work on Regional Innovation Systems (RIS), two literatures that have largely operated independent of each other. I ground my study in the RIS literature because firms do not innovate in isolation but through interactions with other and industry-related actors in their regional ecosystem (e.g. universities and public administrations). These interactions produce regionally specific knowledge that then generates more innovation (Cooke, 1992, 1998; Feldman and Florida, 1994; Feldman and Audretsch, 1999; Feldman, 2001; Camagni, 1995; Asheim, 1996; Crevoisier, 2004).10 Moreover, these interactions create dense regional “learning networks" of mutually reinforcing industries that allow innovators to quickly capitalize on new ideas and innovative solutions to pressing problems in a process that Alfred Marshall once described as being “in the air." More importantly, the RIS literature explains the basis for theWater Technology Innovation Cluster Initiative as an explicit attempt to leverage learning networks to increase and accelerate the rate of water-related innovation.
9A few studies have examined innovative activity at national levels (e.g. Miao and Popp, 2014).
1.2
Conceptual Framework
In this paper, I investigate whether droughts generate interest in creating technologies that address water scarcity. Though prices for water resources are not set through market mechanisms, water scarcity may still promote innovation because individuals, firms, and other organizations that heavily reliant on water resources for daily activities may seek to reduce the risk and uncertainty of drought-related disruptions to water supplies.
Moreover, drought-related water scarcity may generate increased competition over water resources that may in turn generate interest in water-related technologies. Resource-based theory of organizational behavior, for instance, holds that an organization faced with scarcity will engage in increased competitive behavior if it can secure access to scarce resources that can confer it with a competitive advantage (Selznick, 1957; Andrews, 1971; Barney, 1986; Chandler, 1990).11 Similarly, firms may seek a competitive advantage by developing technologies that increase local water supplies (e.g. process that recycle water resources) or by developing new processes or technologies that reduce the intensity with which water resources are used.12 Innovation is therefore an important means of creating and maintaining a sustainable competitive advantage. Transaction cost economics (TCE) holds environmental uncertainty will entice firms for vertical integration (e.g. Helfat and Teece, 1987; Williamson, 1988). This theory holds that the process of vertically integration itself may help the acquiring firm reconfigure resources or integrate resources, increasing innovative activity (Iansiti, 1995). Alternatively, resource dependence theory (RDT) contends that firms will attempt to reduce
11Organizations, for instance, might adopt a “race to the bottom for extraction-profit" strategy
by developing technologies to access water resources at lower depths (Maldonado and del Pilar Moreno-Sanchez, 2016).
12Firms may also choose to mitigate against local scarcity by importing water. Transferring water
environmental uncertainty by renegotiating interorganizational relationships to minimize dependency (Pfeffer and Nowak, 1976; Pfeffer and Salancik, 1978). For instance, support industries often re-purpose their technological know-how to create technologies that can be applied to other sectors of the economy (Kuramoto and Sagasti, 2006; Lorentzen, 2015).
Assuming that disruptions to water supply caused by droughts is sufficient to generate interest in creating water technologies, the question that naturally arises is where one would expect innovation to occur. One the one hand, innovative activity may not necessarily be confined to a particular geographic location. Innovators, for example, can create a technology and market it anywhere where there is demand for that technology. Innovators could learn about droughts occurring in areas far from their own locations through media or other sources. In the United States, for example, several droughts have received nationwide attention (Wiener, Pulwarty and Ware, 2016). Depending on where a particular firm decides to locate its R&D facility, they could be creating solutions to address problems experienced by another branch experiencing drought.
On the other hand, one would expect innovative activity to be particularly strong in geographic locations that experience drought. Droughts represent exogenously determined instances of local scarcity (i.e. unusual departures in average precipitation levels for a particular climate).13 Power-plants, oil and gas companies, farmers, and others that are heavily dependent on water for operations may invest in developing new technologies to address their particular operational concerns. Furthermore, one would expect competition over water resources to be a a largely localized phenomenon since transporting water over long distances may cost-prohibitive or illegal in some situations.
13Definitions include a lack of precipitation (meteorological drought), a lack of soil moisture
The RIS literature contends that innovation is largely a local process that arises due to both competitive and cooperative interactions between firms and other innovative agents in local economic environments. This literature describes innovation as these interactions that lead to innovation in terms of “learning networks," an interactive process determined by the interdependent choices that innovative agents, users, and other market actors make. For instance, firms often compete with each other over resources and often draw on the same labor pool but also cooperate with other each other on projects and obtain advice from neighboring firms. These “learning networks" are thought to generate and diffuses knowledge locally. Firms and organizations that are part of these networks are often interdependent and mutually reliant on each other for resources, often acting as external supply chain partners. Industries also tend to cluster spatially around universities and other public research institutions (Feldman, 1994).14
The RIS literature attributes the development of “learning networks" primarily to spatial proximity (e.g. Asheim and Gertler, 2005; Cooke et al., 2008; Stuck, Broekel and Revilla Diez, 2016). The importance of spatial proximity can in part be explained by the role of regional institutions. Firms and industry-related actors in close spatial proximity share a common institutional framework. In the United States, for instance, legal doctrines for water management have evolved differently in western states relative to eastern states. Moreover,
14Firms rely significantly on academic research (Arora, Belenzon and Patacconi, 2018) and may also
state governments have significant autonomy over environmental regulation.15 For instance, water-related technologies must get approved by each state in which it is marketed and sold. In some states, regulation may be highly localized, enacted at a municipal level rather than a state level. Institutions–both formal and informal–are important for shaping incentives for technical innovation and provide the basis for the type of social interactions between organizations. The sharing of a common institutional framework can be also be related to sharing common social and cultural understanding necessary to build trust (Lundvall, 1992). The spatial proximity to universities and other public research institutions have been associated with positive effects on R&D expenditure (Fritsch and Slavtchev, 2011).
The importance of spatial proximity for innovation can also be explained by the reductions in transaction costs associated with exchanging and communicating knowledge and information locally. This gives rise to locally specific tacit knowledge that is facilitated through face-to-face contact with individuals or organizations in close spatial proximity. There is substantial evidence that the importance of local relationships are important for innovation even in the context of modern information and communication technologies (e.g. internet) (e.g. Kaufmann, Lehner and Tödtling, 2003). Though internet-based communication technologies lower transaction costs of co-operating with potential innovation partners around the world, they are not perfect substitute for face-to-face interaction. Notably, innovation requires interactions between innovators with different sets of specialized knowledge (Grant, 1996) and the development of a shared language and overlapping knowledge structures that cannot be easily accomplished using internet-based communication technologies (Kaufmann, Lehner
15On the one hand, the Porter-Linder hypothesis states that environmental regulation can drive
and Tödtling, 2003). Moreover, physical proximity can facilitate “serendipitous encounters" that in turn lead to creative opportunities (Campa, 2008; Brinks et al., 2018).
The emphasis on local knowledge is especially relevant for the water sector as water availability is largely determined by local physical and social processes. Differences in institu-tions, culture, and conceptualizations of what solutions may be socially acceptable play an important role in how water is managed (Cosgrove and Loucks, 2015). Solutions are therefore contingent on local factors and would depend on local knowledge for appropriate design of technologies and products to address local challenges (Andersen, Marìn and Simensen, 2018). To motivate this anecdotally, many Israeli innovators–leaders in water-related technologies– have moved to California to work on solutions to address the issue of water scarcity locally instead (Peleg, 2018). Firms may locate in proximity to suppliers and customers to better market their technologies to downstream customers (e.g. Fujita, Krugman and Venables, 1999) or to facilitate testing and prototype work (Howell and Higgins, 1990).
Instead of studying innovation at an individual firm-level, I draw on the RIS literature and study innovative activity through the lens of regions. I model each region’s capacity for innovation, i, at time t, as:
Cit =f(Ii, Fit, Wit) (1.1)
where I represents the presence of key institutional actors (e.g. universities),F represents overall economic activity in the regional economy, and W represents the presence of water resources. In this paper, I use Metropolitan Statistical Areas (MSA) as the geographically relevant spatial unit to capture regions.16
16MSAs represent localized and economically coherent areas based on commuting and employment
I draw on the natural hazards literature to model the effect of drought. Previous studies have found that experience with natural disasters shape the perceived risk associated with the disaster. In order for a drought to elicit a response, however, organizations must first notice and recognize the incidence of a drought as a significant event that affects their respective objectives (Cowan, 1986). This information is processed at the organization level and converted to response (Gresov and Drazin, 1997). For instance, the severity level of a natural disaster can play an important role in shaping responses (Perry and Lindell, 2008). This suggests that more severe droughts may have a greater impact on innovation than less severe droughts.
The perceived risk of drought can also be affected by previous experience with the particular hazard. On the one hand, previous experience with natural disasters may increase risk perceptions and levels of preparedness, though these increases may often be short-lived in nature (Perry and Lindell, 1986). On the other hand, previous experience may have a desensitizing effect.
I model the perceived risk of drought,Rit, is as a function of attributes of
contempora-neous drought and experience with prior droughts, given by (1.2):
Rit=f(d(l, s)it, hit) (1.2)
hit= t−1 X
x=0
di,x
where dit represents drought episodes experienced in MSA, i, in year, t, with each drought
Using this, I express regional-level innovative activity,Pit, as:
Pit =f(Cit, t−1 X
t=0
Rit, d−it) (1.3)
where d−it represents drought conditions in other regions. This model can then be simplified as the following reduced-form model:
Pit =f(Ii, Fit, Wit, dit, hit, d−it) (1.4)
The lag betweendit and innovation,Pitis of particular interest because pressing concerns
over relatively low patenting activity would be allayed if patenting activity increases following instances of scarcity. Specifically, this finding would lend credence to the argument that the threat of scarcity is sufficient to spark “human ingenuity,” suggesting that innovators are attuned to the needs of the water sector and the presence of institutions and economic infrastructure necessary to support innovative activity.
Patents are generally filed at the end of the applied research phase. If water scarcity does lead to an increase in patenting activity, one would expect to see an increase approximately 6-8 years following a drought as that is the average duration of the applied research phase for water technologies (O’Callaghan et al., 2018).17
17Patents are generally filed at the end of the Applied Research Stage when the scientific basis for
1.3
Data
1.3.1 Hydrological Drought
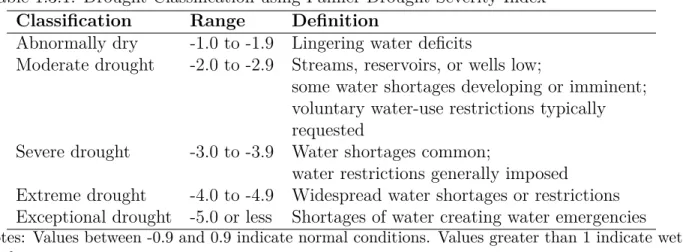
I measure droughts using the Palmer Drought Severity Index (PSDI), a measurement of dryness based on a physical water-balance model, to capture water stress and relative dryness.18 The index ranges from -10 (extreme dryness) to 10 (extreme wetness). A major strength of this index is its effectiveness in quantifying long-term drought.19 This accounts for possibility that it may take several rain cycles to refill reservoirs and aquifers or restore soil moisture conditions. I follow the United States Drought Monitor in their classification of drought, shown in Table 1.3.1.20
Table 1.3.1: Drought Classification using Palmer Drought Severity Index Classification Range Definition
Abnormally dry -1.0 to -1.9 Lingering water deficits
Moderate drought -2.0 to -2.9 Streams, reservoirs, or wells low;
some water shortages developing or imminent; voluntary water-use restrictions typically requested
Severe drought -3.0 to -3.9 Water shortages common;
water restrictions generally imposed
Extreme drought -4.0 to -4.9 Widespread water shortages or restrictions Exceptional drought -5.0 or less Shortages of water creating water emergencies
Notes: Values between -0.9 and 0.9 indicate normal conditions. Values greater than 1 indicate wet conditions.
18The model uses primarily relies on precipitation and temperature as inputs.
19Other measures include PHDI, SDI.
20The United States Drought Monitor is a collaboration between National Drought Mitigation
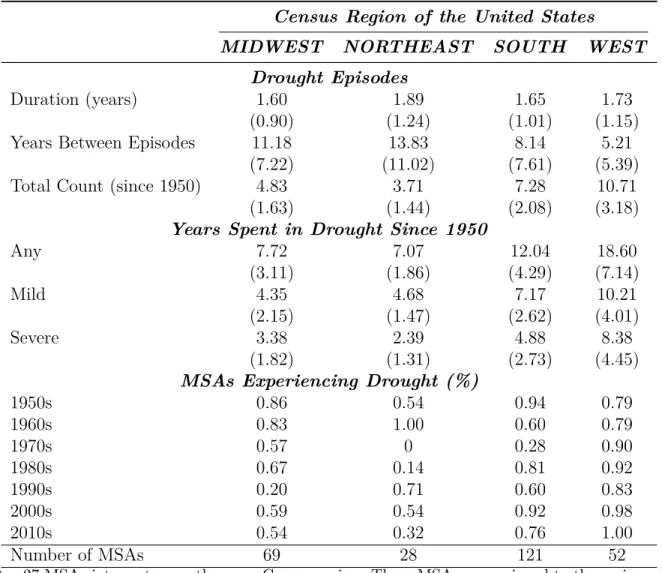
A historical time series of the PDSI is collected from the National Oceanic and Atmo-spheric Administration (NOAA) from 1930-2018.21 I define drought episodes as two or more years of uninterrupted drought, where a year of drought is defined as a calendar years with at least 6 months with PDSI ≤-2.0 (moderate, severe, extreme, or exceptional drought). Table 1.3.2 summarizes drought characteristics for all MSAs by Census Region. For each drought episode, I identify the most severe drought year.
1.3.2 Patent Data
Following standard practice in prior work on innovation, I use patent data to proxy for innovative activity. Patents are the most commonly used proxy used in the literature on innovation as they represent innovations that are: (i) novel; (ii) nonobvious; and (iii) useful (Brunnermeier and Cohen, 2003; Jaffe and Palmer, 1997; Horbach, 2008; Johnstone, Haščič and Popp, 2010; Horbach, Rammer and Rennings, 2012). Patenting activity has been shown to be a good proxy for general innovative activity since they are strongly correlated with R&D spending (e.g. Griliches, 1998). Though patents do not cover innovation in financial or managerial practices, innovation in these areas may positively impact technological innovation (Benner and Tushman, 2002). More importantly, there are very few examples of inventions that have had significant economic and social welfare impacts that have not been patented (Pakes and Griliches, 1980; Griliches, 1990; Gallini, 2002).
Patent data used in this study consists all utility patents filed in the U.S. between 1976 and 2018, compiled from bulk data files made available by USPTO’s Bulk Data Storage
21These data are available at the USGS climate division level. For MSAs that intersect with multiple
Table 1.3.2: Drought Characteristics
Census Region of the United States
MIDWEST NORTHEAST SOUTH WEST
Drought Episodes
Duration (years) 1.60 1.89 1.65 1.73
(0.90) (1.24) (1.01) (1.15)
Years Between Episodes 11.18 13.83 8.14 5.21
(7.22) (11.02) (7.61) (5.39)
Total Count (since 1950) 4.83 3.71 7.28 10.71
(1.63) (1.44) (2.08) (3.18)
Years Spent in Drought Since 1950
Any 7.72 7.07 12.04 18.60
(3.11) (1.86) (4.29) (7.14)
Mild 4.35 4.68 7.17 10.21
(2.15) (1.47) (2.62) (4.01)
Severe 3.38 2.39 4.88 8.38
(1.82) (1.31) (2.73) (4.45)
MSAs Experiencing Drought (%)
1950s 0.86 0.54 0.94 0.79
1960s 0.83 1.00 0.60 0.79
1970s 0.57 0 0.28 0.90
1980s 0.67 0.14 0.81 0.92
1990s 0.20 0.71 0.60 0.83
2000s 0.59 0.54 0.92 0.98
2010s 0.54 0.32 0.76 1.00
Number of MSAs 69 28 121 52
Note: 27 MSAs intersect more than one Census region. These MSAs are assigned to the region with the largest overlap. Where appropriate, Combined Statistical Areas (CSAs) are used instead of MSAs.
System.22 Patents are published with an average publication lag of 18 months after the actual filing date. This would primarily affect the ability to observe many of the patents filed during 2018 and would also affect 2017, though to a more limited extent.
22I restrict the data to utility patents to as they protect the way a manufactured article is used and
Following Hascic and Migotto (2015), water-related patents are identified using sets of International Patent Classification (IPC) and Cooperative Patent Classification (CPC) codes that are closely associated with specific types of inventions. The main advantage of using these codes is that they are heavily reliant on the detailed knowledge of patent examiners (Haščič and Migotto, 2015). Technologies produced in the water sector are produced for a variety of different end-users, including residential, industrial, and agricultural users. Technologies range from low-flow devices, aimed at reducing water consumption, and smart meters, devices to help monitor water usage to water purification and treatment technologies developed for industrial users and utilities to help meet stricter environmental standards and reduce costs of compliance. Water reuse and water recycling technologies, for example, help relieve pressure on traditional sources of water (Bichai, Grindle and Murthy, 2018). Water-related are therefore further categorized as technologies that promote conservation, technologies that augment water supply, and technologies that aim to improve water quality (also referred to as water pollution abatement or treatment technologies).23 All IPC and CPC codes used to identify water-related patents are presented in Appendix 1.3.24 Between 1975 and 2018, a total of 4,336,280 patents were filed by inventors in the the United States.25 Of these, 4,215,624 patents were filed by at least one inventor living in an MSA. Of the patents with at
23Droughts affect water quality by increasing the concentration of point source pollution—sewer
outfalls, industrial discharges, and thermoelectric power plant return flows—and non-point source pollution—stormwater runoff. This makes it harder to filter and decontaminate drinking water. Furthermore, reduced water flows can lead to saltwater intrusion, further burdening most water treatment plants, many of which are not equipped to remove salts (Mosley, 2015).
24The categorization a patent is mutually exclusive as the same patent can have multiple IPC or
CPC codes assoicated with different areas of innovation.
least one inventor geographically located within an MSA, 121,197 patents are identified as water-related.26
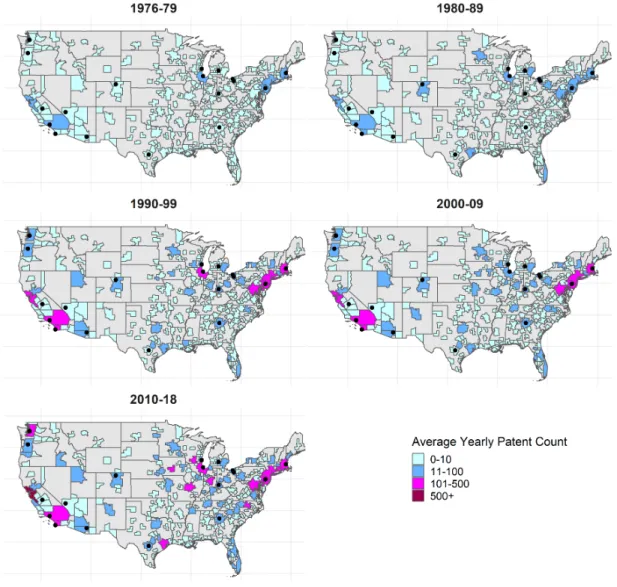
I measure of innovative activity using the count of patents filed in each year by MSA. Where appropriate, Combined Statistical Areas (CSAs) are used instead, resulting in a total of 270 geographic regions. I use the location information associated with the patent inventor(s) listed on the patent application to assign each patent to a MSAs. This location reflects the inventors’ location at the time the patent was filed. If the patent had two or more inventors located in the same MSA, the patent count for the MSA is only incremented by one to avoid counting the same invention more than once for a particular region. If the patent had two or more inventors located in the different MSAs, the patent count for each MSA associated with the patent is incremented by one to reflect that each location was involved in the creation of the invention. The average yearly patent count for each MSA is displayed by decade in Figure 1.3.1. There has been an increase in water-related patenting since the 1990s. This trend is observed in MSAs located in the West, Northeast, and the Midwest regions of the US.
I trim the data to remove outlier MSAs at the bottom of the distribution for patenting activity. Specifically, I remove MSAs in the lowest percentile of overall innovative activity (unrelated to water) and MSAs in the top 5% percentile of zero water-related patents to exclude MSAs that don’t have the necessary economic infrastructure in place to support innovative activity in the water sector. This removes a total of 29 MSAs from the sample.
Figure 1.3.1: Water-Related Patenting Activity Over Time
Note: The figure represents average patenting activity for all water-related patenting activity for each MSA by decade. Black points on the maps represent the locations of the 18 recognized water technology clusters. Black points included in all time periods to help visualize patenting activity in locations that establish a water technology cluster across time and space.
1.3.3 Water Technology Clusters
are therefore largely built around industries with an already established presence and the presence of key regional stakeholders which include end-users, universities, research centers, large firms, government and other relevant institutions.
Water utilities are a key stakeholder in the water sector, responsible for the provision of water services and waste-water treatment. Many water utilities, however, are cash constrained which may limit their ability to collaborate or innovate. In particular, many innovators in the water sector aim to improve water utilities’ ability to recover resources from wastewater and reduce the energy intensity of water utility operations (Daigger, 2009; Naik and Stenstrom, 2014).
A key goal of water technology clusters is to mitigate some of the risk associated with the development of new technologies. Many of the water technology clusters provide funding and opportunities to test, validate, and verify new technologies, serving as a credible third-party vetting system to screen new technologies. The screening of technologies is important for two reasons. First, water-related technologies are expensive to test and scale. More importantly, development of water technologies generally require long testing and review periods because of factors such as requirements that technologies be piloted in each state as a pre-condition to commercialized nationally (e.g. Forer and Staub, 2013). Adoption of several successful technologies in the water sector have taken up to 14 years after pilot testing (O’Callaghan et al., 2018). Private venture capital funding for the development of water-related technologies is relatively scarce because of want to take on projects with shorter time horizons.
they often do not address actual market needs due to a lack of end-user engagement during the development process (EPA, 2014).
In 2011, the EPA established aWater Technology Innovation Cluster Initiative (WTICI) to jump-start innovation in the water sector by supporting the development of local water technology clusters. In this paper, reference to technology clusters specifically refers to the technology clusters that are managed as part of the WTICI.27 The EPA’s official recognition of water technology clusters represents formal and additional support to reduce barriers to innovation. As part of the initiative, for example, EPA and other federal agencies help ease regulatory hurdles and provide support for meetings, networking, planning, coordination to promote the creation of new technologies that address pressing environmental and public health challenges and encourage sustainable economic development. In 2018, the EPA transferred coordination of the water technology program to the Water Environment Federation to be managed as part of the Leaders Innovation Forum for Technology (LIFT) program, whose goal is to “establish the conditions that promote accelerated development and implementation of innovative technologies and approaches" in the water sector (Barillo, 2018).
A total of 18 water technology clusters across the United States are recognized by the WITCI.28 Each of the established clusters’ technology focus vary based on each regions’ particular needs or strengths. These foci range from water scarcity, reuse, agriculture challenges, aging water infrastructure, and water quality. A list of the 18 existing water-related technology clusters, along with their relative foci, is provided in Appendix Table 1.4.1 in Appendix 1.4. Several of the water technology clusters existed prior to WTICI. For the
27There is no universally accepted definition of a technology cluster (Arthurs et al., 2009). Existence
of a technology clusters for various industries, including water, is measured in several ways (Wood, Harten and Gutierrez, 2018).
technology clusters that formed prior to WTICI, I use 2011, the start of the initiative, as the first year.
1.3.4 Additional Data
The main goal of this study is to examine the relationship between scarcity and water-related technological innovative activity. It is therefore important to control for other drivers of innovative activity unrelated to scarcity. Additional data is collected at the MSA level to capture attributes at a regional scale that may affect the level of water-related innovation and innovative activity, more generally.
1.3.4.1 Toxic Release Inventory.
Water Quality is measured using data from the Toxic Release Inventory (TRI) from 1986-2017, which is maintained by the EPA (EPA, 2019).29 The program requires facilities in various industries which manufacture, process, or use significant amounts of toxic chemicals, to report annually on storage, use, and releases of these chemicals, including information on the medium in which the substance is released (e.g. air, water, landfill). An advantage of these data is that firms are not fined for the content of their reports. Firms are fined for not reporting information. This minimizes concern over incentives for misreporting.30
29Congress created the Toxic Release Inventory (TRI) in 1986 under Section 313 of the Emergency
Planning and Community Right-to-Know Act (EPCRA) in response to a deadly chemical release at a chemical plant in West Virginia in 1985.
30Other potential data sources on water pollution include federal data repositories: Storet Legacy,
The main purpose of the data compiled by TRI is to provide information about industrial management of potentially dangerous chemicals to inform the public, help communities plan for potential chemical emergencies, and assist local governments in accessing information on possible exposures. A count of the number of chemicals released that are known carcinogens is used to capture the effect of informal regulation on innovative activity. Given that the program was established in 1987, these measures do not exist prior to 1987. These measures are set to 0 in years before the program was established to reflect the fact that this type of informal regulatory pressure was non-existent.
1.3.4.2 Census Data
Decennial censuses from 1970–2010 are used to collect data on education to proxy for the availability of a skilled workforce, measured as the proportion of the population with a college degree or higher. Data for years in between collection are linearly interpolated.31 Yearly population estimates for MSAs are obtained from the Complete Economic and Demographic Data Source (CEDDS). Using these data, a measure of population growth is constructed to capture development pressures that may put strain on existing water supply.
1.3.4.3 Municipal Financial Records
The state of the existing water-related infrastructure may affect both firm location as well as firm investment in water-related technologies. Municipal spending on water-related infrastructure is measured using data from the 1967-2015 Annual Survey of State and Local Government Finances. These data include reports for annual capital and total expenditures for waste-water, solid waste management, and natural resources for each local government.
31Data collected from IPUMS NHGIS (Manson et al., 2017) and Longitudinal Tract Data Base
These annual estimates are averaged at the MSA level and linearly interpolated for missing years.
1.4
Estimation
I adopt a “treated-within-the-treated" approach, extending the difference-in-difference framework to evaluate both the impact of establishing a Water Technology Cluster on water-related patenting activity in addition to changes in patenting activity following the incidence of drought. This approach makes use of variation in both the timing and geographic location in the incidence of droughts and the recognition of water technology clusters to explain differences in patenting water-related patenting activity.
In this setup, MSAs that experience drought are considered exposed to a “water scarcity treatment." Following the event study literature, I capture the dynamic effects of a drought shock in MSA i, using indicator variables. Letdi denote a year in which MSA i experiences a drought shock; t−di therefore represents the number of years elapsed since a drought shock,
i.e. “relative time” (Borusyak and Jaravel, 2017; Schmidheiny and Siegloch, 2019). Indicator variables for each year following a drought shock can be expressed asP∞
τ=11{t−di = τ},
where τ = 1 represents the first year following a drought shock andτ =∞ is the maximum lag possible given the data. Pre-trends (i.e. τ ≤0) are not included because the incidence of a drought episode is considered to be as-good-as-randomly assigned.32
Additionally, MSAs in which a water technology cluster is established are considered to have received a “policy treatment." These MSAs are treated at various times and, once treated, remain treated thereafter. Specifically, the policy treatment is defined as, Tit ∈[0,1],
32Droughts are usually predicted up to a month in advance. In certain rare instances, droughts are
where Tit = 0 if MSA ihas not established a Water Technology Cluster by year t and Tit = 1
if it has. MSAs that never establish a Water Technology Cluster are included in the analysis as control locations. An interaction term,P∞
τ=11{t−di =τ}Tit is included to capture the
dynamic effect of a drought shock that occurs in MSAs with an established water technology cluster. The basic modeling approach is given by (1.5):
Pit= Ji X
j ∞
X
τ=1
γτ1{t−dij =τ}+βTit+ Ji X
j ∞
X
τ=1
θτ1{t−dij =τ}Tit+δXit+ηi+it (1.5)
where i indexes MSAs,t indexes calendar years, and j indexes drought events. MSA fixed effects,ηi, are included to capture time-invariant characteristics that vary by MSA. Specifically, ηi would account for the general propensity to generate water-related patents and capture
factors that account for these differences, such as institutions, regulatory environments, the presence of water resources, or differences in knowledge stocks that would affect the level of patenting across MSAs. Standard errors are adjusted for both heteroscedasticity and autocorrelation due to potential persistence of drought shocks that would be captured by
it. I estimate this equation separately for each technology type (All, Conservation, Supply,
Water-Quality) to account for heterogeneous effects across the broad range of activities that droughts affect.
The coefficient γτ represents patenting activity in years following droughts in MSAs
patent in the same location that they experience drought, i.e. they do not move locations between when drought occurred and when patent is filed.33
The vectorXit represents time-varying observed covariates to controls for factors may
affect water-related patenting activity. First, I control for local innovative activity using a measure of per capita patenting activity unrelated to water as proxy for the general propensity to patent in each yeart and MSA i. Second, I control for regulatory pressure to create new water-related technologies unrelated to scarcity using a count of the number of chemicals released that are known carcinogens. Lastly, I control for temporal variations in patenting incentives for water-specific technologies using the number of successful U.S. applications in yeartin non-MSA areas, including those filed by foreign corporations (Jaffe and Palmer, 1997). I also include US census region-specific linear time trends to capture long-term patenting trends due to differences in climate and regional institutions.
The coefficient, β, captures the mean change in patenting activity observed pre- and post-establishment of a water technology cluster. Causal interpretation of β requires that the establishment of a water technology cluster be uncorrelated with water-related patenting activity. A priori, there is reason to be concerned that the location of a technology clusters is not random because its establishment is a result of local initiatives. The policy treatment,
Tit, may therefore be endogenous as MSAs select into treatment. Simply comparing locations
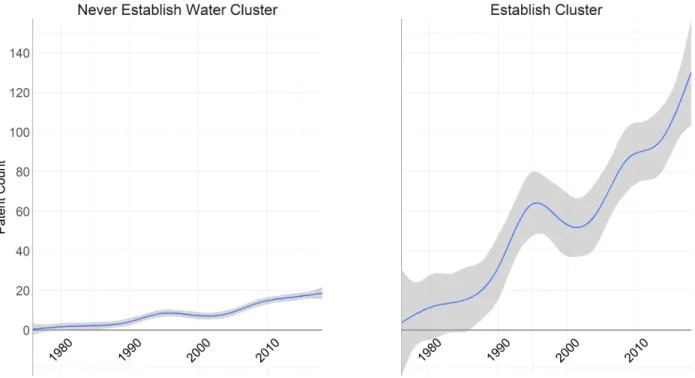
with that establish a water technology cluster to those that do not is not sufficient because locations in which a cluster was created may be systematically different than those where one was not created. More importantly, these differences might due to unobserved characteristics that would also be systematically correlated with the outcome of interest (i.e. water-related patenting activity). These unobserved characteristics will be subsumed in it. As shown
Figure 1.4.2: Water-Related Patenting Activity in MSAs that do and do not Establish a Water Technology Cluster
Note: The solid lines represent average patenting activity. The shaded region represents the associated 95% confidence interval.
in Figure 1.4.2, patenting trends in MSAs that eventually establish a water technology cluster are significantly different from MSAs that have not established a cluster.
In the main specification, I account for the potential endogeneity of the policy treatment using a parametric control function approach motivated by Heckman (1978) extensively used in the literature (Semykina and Wooldridge, 2010; Papke and Wooldridge, 2008; Imbens and Wooldridge, 2009; Semykina and Wooldridge, 2010; Fernández-Val and Vella, 2011; Wooldridge, 2015; Kawatkar et al., 2018). As a robustness check, I also estimate the effect of water technology clusters using a Baysian Structural Time-Series approach in Appendix 1.6. This alternative approach constructs a synthetic control using untreated MSAs. The results from this alternative approach are consistent with the results presented in this section.
each cross-section, year t, to obtain estimates of time variant unobserved heterogeneity that explains the selection into treatment. These estimates are then used to construct the Inverse Mills Ratio, ˆλit. The control function is then included as a regressor in the outcome equation
to purge it of the factors that led to selection. This approach is inherently an instrumental
variable method. The first stage is specified as follows:
P(Ti = 1|zit) =φ(zitδt+ ¯ziξt) (1.6)
where zit are instrumental variables and ¯zi are time means of these instruments.34 The set
of exclusion restrictions used in the first stage consist of factors related to water-specific concerns and the RIS literature. These variables are summarized in Table 1.4.3 and discussed in Appendix 1.2.
In the second stage, the ˆλit is included as an additional explanatory variable to control
for selection bias.35 MSA fixed effects are replaced with time means of the instruments to purge the idiosyncratic error term of the factors that led to selection in addition to including the constructed control function as an additional explanatory variable. The resulting error
34Binary instrumental variables are not time-meaned.
Table 1.4.3: Control Function Exclusion Restrictions
Variable Description Data Source
Time-Invariant Factors
EPA office Distance to the nearest regional EPA office EPA
CEE MSA with a Civil and Environmental
Engi-neering Dept.
SR
Time-Varying Factors
Previous drought episodes the total number of drought episodes that a MSA experienced from 1930 through time
t−1
NOAA
WaterExp Expenditure on operation, maintenance, and construction of public water supply systems
ASSLGF
SewExp Expenditure on provision, maintenance, and operation of sanitary and storm sewer sys-tems and sewage disposal and treatment fa-cilities
ASSLGF
Notes: EPA- Environmental Protection Agency; SR- Shanghai Ranking; NOAA-National Oceanic and Atmospheric Administration; ASSLGF - Annual Survey of State and Local Governments
term in the new outcome equation is theoretically orthogonal to the explanatory variables.36 The second stage is specified as follows:
Pit = Ji X j ∞ X τ=1
γτ1{t−dij =τ}+βTit+ Ji X j ∞ X τ=1
θτ1{t−dij =τ}Tit+δXit+ ˆλit+ ¯zi+it
(1.7)
The results of estimating (1.7) are shown graphically in Figure 1.4.3 through Figure 1.4.4 for various subsets of the coefficients of interest. The full numerical results are given in Appendix Table 2.2.1. Starting with patenting activity following the incidence of drought,
36This was first proposed by (Mundlak, 1978) and (Chamberlain, 1979). In the absence of selection
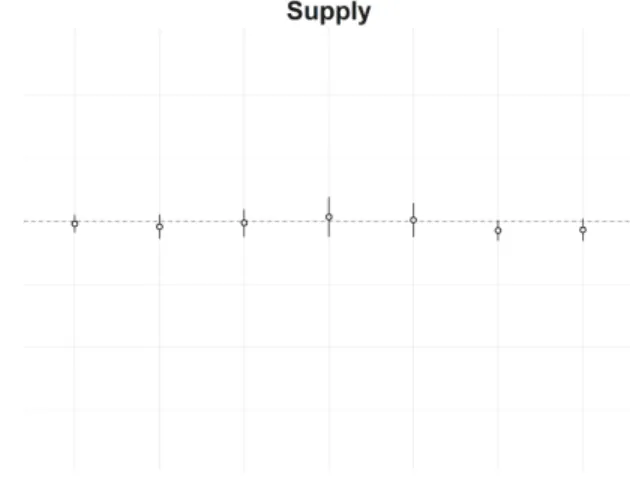
Figure 1.4.3: Patenting Activity after Drought
Note: Coefficients represent the change in patent counts at each lag following the occurrence of a drought shock.
the results suggest no evidence that water-scarcity shocks induce more innovation. As shown in Figure 1.4.3, the magnitude of the lagged coefficients, P∞
τ γτ, are relatively small and
insignificant from zero, especially for supply and pollution abatement technologies.
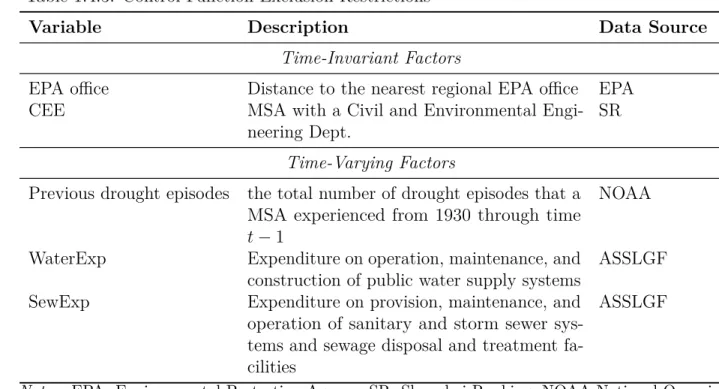
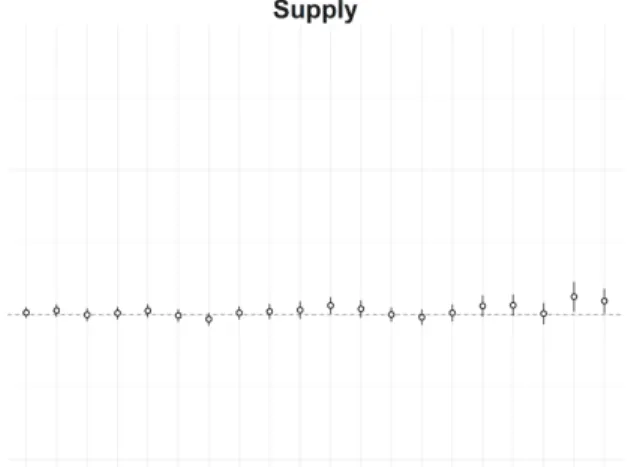
Figure 1.4.4: Effect of Water Technology Cluster on Patenting Activity
Note: The 0mi column is the additional patenting activity that occurs in MSAs with an established technology cluster. Subsequent columns represent the change in patenting activity for MSAs within the specified radius of a water technology cluster.
with increases in average patent count of approximately 7 and 11 respectively. I also find evidence of spillover effects for MSAs within a 50mi radius of a treated MSA (i.e. MSA with a water technology cluster). I find that MSAs further than 50mi do not significantly increase patenting activity. Moreover, I find evidence that MSAs further between 150-200mi of a treated MSA may decrease patenting activity. One potential explanation for this is that innovators that would have filed for patents in these locations filed for them in the treated MSA instead.
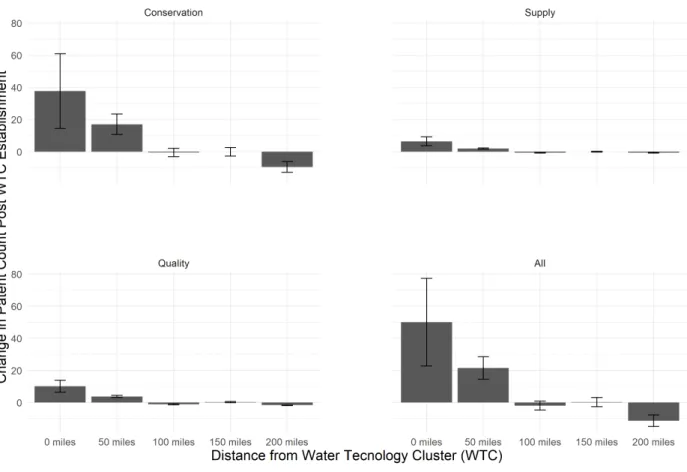
Figure 1.4.5: Patenting Activity after Drought in MSA with Water Technology Cluster
Note: Coefficients represent the change in patent counts at each lag following the occurrence of a drought shock in MSAs with an established water technology cluster.
for the effect of drought in MSAs with water technology clusters, P∞
τ θτ, are not significantly
different from zero.
1.5
Conclusion
themselves. Specifically, I estimate the extent to which water scarcity motivates innovators to create new water-related technologies, using the incidence of drought as exogenous water scarcity shocks.
In general, findings indicate that patenting activity does not increase following water scarcity shocks. This finding is important as droughts are expected to become more severe.37 Several explanations exist for why this may be the case. First, it is possible that the droughts observed during the sample period were not considered to be serious ‘scarcity signals.’
Second, the uncertainty in the incidences of drought may influence preferences for investmenting in new technologies. Previous research has shown that people tend to overweigh the likelihood of the most favorable outcomes and are consequently less likely to invest or demand technologies (Bernedo and Ferraro, 2017). Similarly, empirical evidence also suggests that government insurance programs that insure against crop losses due to extreme heat (e.g. subsidized crop insurance program) may potentially distort inventivies to create or adopt technologies in the agricultural sector (Annan and Schlenker, 2015).
Third, it is also possible that technologies already in existence are being increasingly adopted following instances of drought. Taking this perspective, adoption of already existing technologies may be considered “innovative" as it would be addressing an issue in a way that is new for that location as water issues intersect strongly with local concerns and solutions are contingent on local conditions. This study points to the need to better understand the adoption behavior of water-related technologies in the context of scarcity.
37With few exceptions, most droughts have not lasted that long as the period under study happens
Lastly, it is also the case that extreme droughts create conditions that may inhibit innovative activity. For instance, extreme water scarcity can lead to or exacerbate other natural disasters (e.g. wildfires, floods, sinkholes) or lead to social unrest (Westerling et al., 2003; Ichoku et al., 2016; Hand, Thompson and Calkin, 2016; Scasta, Weir and Stambaugh, 2016).38 These secondary effects may draw resources away from innovating on water-related issues.
With respect to water technology clusters, I find that the establishment of water technology clusters increases local patenting activity as well as activity in nearby locations. I find no evidence, however, that innovators operating in the context of a water technology cluster increase innovative activity after experiencing a drought. The most likely reason for this finding is that there are too few years of post-drought data to be able to detect a different response. Further research is needed to understand this finding. This finding would support the notion that there are significant barriers to innovation that technology clusters address. Though further work is needed to investigate the attributes of water clusters that specifically enable them to promote innovative activity, this study also points to the need to evaluate policies that leverage market forces to promote water-related innovation.
38In California, wildfire related-damages in 2018 totaled over $2.5 billion. Land subsidence can
PAPER 2: HETEROGENEOUS RESPONSES TO PRICE: EVIDENCE
FROM RESIDENTIAL WATER CONSUMERS1
2.1
Introduction
Public or regulated utilities, such as water and electricity providers, often face demand or supply fluctuations that make it difficult to satisfy all demand with a single year-round price. Utilities may respond to these challenges with rationing, either through prices or explicit usage restrictions, or by increasing capacity. In recent years, price-based rationing has gained popularity as a demand management tool (Cuthbert and Lemoine, 1996; Newsham and Bowker, 2010; Kenney et al., 2011; Mayer, Hunter and Smith, 2018). Price increases can be used to reduce quantity demanded to meet (perhaps reduced) supply while allocating the utility’s product to consumers with the greatest marginal benefit. The benefits of this approach are likely to increase in the coming decades due to aging infrastructure, changes in climate and population, and the increasing cost of creating new capacity.2
In this paper, we provide new insights into price-based rationing by exploiting a detailed panel of households’ monthly water usage. The data allow us to describe how households of different wealth and water usage patterns respond, potentially differently, to variation in water prices, environmental conditions, and usage restrictions. Most notably, we find
1Co-authors include Shadi Eskaf, Julien Isnard, Brian McManus, and Andrew J. Yates.
2Most of the electrical grid and over 30% of water utilities already operate at or near maximum