Kinematics of
z
≥
6
galaxies from [C
II
] line emission
M. Kohandel
1
?
, A. Pallottini
1
,
2
, A. Ferrara
1
, A. Zanella
3
, C. Behrens
4
, S. Carniani
1
,
S. Gallerani
1
, L. Vallini
5
,
6
1Scuola Normale Superiore, Piazza dei Cavalieri 7, I-56126 Pisa, Italy
2Centro Fermi, Museo Storico della Fisica e Centro Studi e Ricerche “Enrico Fermi”, Piazza del Viminale 1, Roma, 00184, Italy 3European Southern Observatory, Karl Schwarzschild Straße 2, 85748 Garching, Germany
4Institut für Astrophysik, Georg-August Universität Göttingen, Friedrich-Hundt-Platz 1, 37077, Göttingen, Germany 5Leiden Observatory, Leiden University, PO Box 9500, 2300 RA Leiden, The Netherlands
6Nordita, KTH Royal Institute of Technology and Stockholm University Roslagstullsbacken 23, SE-106 91 Stockholm, Sweden
Accepted XXX. Received YYY; in original form ZZZ
ABSTRACT
We study the kinematical properties of galaxies in the Epoch of Reionization via the [CII]158µm line emission. The line profile provides information on the kinematics as well as structural properties such as the presence of a disk and satellites. To understand how these properties are encoded in the line profile, first we develop analytical models from which we identify disk inclination and gas turbulent motions as the key parameters affecting the line profile. To gain further insights, we use “Althæa”, a highly-resolved (30 pc) simulated proto-typical Lyman Break Galaxy, in the redshift rangez=6−7, when the galaxy is in a very active assembling phase. Based on morphology, we select three main dynamical stages: I) Merger , II) Spiral Disk, and III) Disturbed Disk. We identify spectral signatures of merger events, spiral arms, and extra-planar flows in I), II), and III), respectively. We derive a generalised dynamical mass vs. [CII]-line FWHM relation. If precise information on the galaxy inclination is (not) available, the returned mass estimate is accurate within a factor 2 (4). A Tully-Fisher relation is found for the observed high-zgalaxies, i.e.L[CII]∝ (FW H M)1.80±0.35for which we provide a simple, physically-based interpretation. Finally, we perform mock ALMA simulations to check the detectability of [CII]. When seen face-on, Althæa is always detected at>5σ; in the edge-on case it remains undetected because the larger intrinsic FWHM pushes the line peak flux below detection limit. This suggests that some of the reported non-detections might be due to inclination effects.
Key words: galaxies: high-redshift – galaxies: kinematics and dynamics – ISM: evolution – methods: analytical – methods: numerical
1 INTRODUCTION
Answering the fundamental questions related to the formation, build-up, and mass assembly of galaxies is one of the main goals of modern astrophysics. The first stars and galaxies formed when the diffuse baryonic gas in the Intergalactic Medium (IGM) was able to collapse into the potential well of the dark matter halos in the early universe. The ultraviolet (UV) radiation produced by these first sources ionised the hydrogen atoms in the surrounding IGM. This process, called cosmic reionization (Madau et al. 1999;Gnedin 2000;Barkana & Loeb 2001), took about 1 billion years to reach completion atz∼6 (Fan et al. 2006;McGreer et al. 2011). After the formation of first sources, as time progressed, those objects grad-ually evolved, merging with their neighbours and accreting large quantities of gaseous fuel from a filamentary IGM. Then, through
?
mahsa.kohandel@sns.it
a combination of galaxy-galaxy mergers, rapid star formation, and secular evolution, the morphology of those galaxies transformed into what is observed locally. Both observationally and theoreti-cally, understanding the details of the assembly process has proven very challenging as the internal structure of these system should be resolved.
Integral field spectroscopy and adaptive optics technology have enabled us to obtain diagnostic spectra of spatial regions resolved on scales of roughly∼1 kpc at intermediate redshifts (z∼2−3). These remarkable experiments revealed that such galaxies have irregular and clumpy morphologies while their velocity structures are often consistent with rotating disks (Genzel et al. 2011;Förster Schreiber et al. 2018;Leung et al. 2019). The question remains if the situation is the same for the galaxies at even higher redshifts.
Over the last few years, observations have also managed to probe galaxies at progressively higher redshifts (for a recent review seeDayal & Ferrara 2018), producing a first, albeit partial, census
of galaxy populations well into the Epoch of Reionization (EoR). Although with UV surveys (e.g.Smit et al. 2014;Bouwens et al. 2015) the discovery of such galaxies has become possible, physical insights on the properties of the Interstellar Medium (ISM) of these sources rely on the detection of far-infrared (FIR) lines. It has now become possible with the advent of the Atacama Large Millimeter Array (ALMA) to detect these emission lines from high-zgalaxies. Among the FIR lines, the fine-structure transition 2P3/2 →
2P1/2of singly ionised carbon atλ=158µm is the brightest one,
accounting for 0.1% to 1% of the total FIR luminosity (Stacey et al. 1991), making it as one of the most efficient coolants of the ISM (Malhotra et al. 1997;Luhman et al. 1998,2003). Neutral carbon has a relatively low ionisation potential (11.3 eV) and its distinctive line transition ([CII]) is very easy to excite (E/k ≈92 K). These properties are such that the line can arise from nearly every phase in the ISM. It can emerge from diffuse HI clouds, diffuse ionised gas, molecular gas and from the photodissociation regions (PDRs). So far, the [CII]158µm line has been measured in a rapidly increasing number of galaxies atz>6 (e.g.Maiolino et al. 2015;Capak et al. 2015;Pentericci et al. 2016;Carniani et al. 2017;Jones et al. 2017;
Matthee et al. 2017;Smit et al. 2018;Carniani et al. 2018a,b). Alongside observations, theoretical attempts have been made to model the [CII] emission and interpret the observations atz>6 (Vallini et al. 2013,2015;Pallottini et al. 2017a;Olsen et al. 2017;
Katz et al. 2019) using numerical simulations of galaxies. So far, the purpose of theoretical modellings was mostly to estimate the total [CII] luminosity of galaxies at the EoR and understanding the relative contribution from different ISM phases. These theoretical works agree on the fact that most of the total [CII] luminosity arises from the dense PDRs (Pallottini et al. 2017a) with a slight depen-dence on galaxy mass (Olsen et al. 2017). Still no clear consensus has been reached whether or not the local [CII] star formation rate (SFR) relation that is observed locally (De Looze et al. 2014) holds forz >6 galaxies (cfrCarniani et al. 2018a). For instance while
Vallini et al.(2015) andPallottini et al.(2017a) show that a deviation is present,Katz et al.(2019) show that for their suite of simulations atz∼9, the local relation holds. The [CII] -SFR relation is further analysed in different works (Ferrara et al., in prep. 2019;Pallottini et al. 2019), where it is connected to galaxy evolutionary properties. With the improvement of the quality of the view that ALMA is giving us from the high-zuniverse, the [CII] line is starting to be considered as a suitable tool for studying the gas kinematics as well. For instance,Smit et al.(2018) recently presented [CII] ob-servations of two galaxies atz ∼7 characterised by velocity gra-dients consistent with undisturbed rotating gas disks. Also inJones et al.(2017), using the [CII] line emission from az ∼6 Lyman break galaxy, conjectured that their observed system represents the early formation of a galaxy through the accretion of smaller satel-lite galaxies along a filamentary structure. However, the build-up process, kinematics, and morphology of these galaxies are almost uncharted territories. Also, whether a disk structure is expected at those early epochs and whether it can survive the frequent collisions with merging satellites and accreting streams are key questions for galaxy formation theories.
In this work, we explore these questions by modelling the spec-tral profile of the [CII] emission coming from galaxies atz >6. To this aim, we first construct a simple galaxy model with control-lable parameters and study the emerging [CII] spectra. Then, we trace the evolution of a prototypical Lyman Break Galaxy (LBG) – “Althæa” (Pallottini et al. 2017b) – fromz=7 toz=6 through its [CII] emission maps and corresponding synthetic spectral line profiles.
The paper is organised as follows. In Sec.2, we detail the emis-sion model used throughout the paper, in particular analysing the effects of various assumptions made; this is followed by the descrip-tion of our analytical galaxy model (Sec.3) and the corresponding results. Then in Sec.4, the description of the hydrodynamical sim-ulation used in this work is given, along with the results obtained by combining it with our emission model. Then in Sec.5, we compare our findings with the available [CII] observations. Finally, conclu-sions are summarised in Sec.6.
2 [CII] EMISSION MODEL
The [CII] transition can be excited via collisions of singly ionised carbon atoms (CII) with other species present in the gas. Following
Dalgarno & McCray(1972), we consider a partially ionised volume of gas in which carbon atoms are maintained in CIIstage by far UV radiation in the Habing band (6< hν/eV <13.6,Habing 1968). The [CII] emissivity (ε), excited by collisions with free electrons and hydrogen atoms, is written as a function of the gas (n), electron (ne), and neutral hydrogen (nH) number densities as follows:
ε(n,T)=n( Z
Z
)AC
nH
1+nH/ncrH
ΛH+ ne
1+ne/ncre Λe
, (1)
whereΛH=ΛH(T)andΛe=Λe(T)are the specific cooling rates due to collision withHatoms and free electrons at temperatureT. Zis the metallicity of the gas, Z=0.0134 is the solar metallicity (Asplund et al. 2009), andAC =2.69×10⁻⁴is the adopted solar ratio of carbon to hydrogen number densities (Asplund et al. 2009). Note that we have included in an approximate manner the effects of the critical densityncrH =3000 cm−3andncre =8 cm−3(Goldsmith et al. 2012) for hydrogen and electron collisions to ensure the validity of eq.1in high density regimes1.
We requireεto vanish in highly ionised regions (T >104K) where our assumption that all the carbon is singly ionised would not be valid anymore. In this treatment we also assume that the [CII] line is optically thin (see discussion inGoldsmith et al. 2012), which means that the integrated intensity is proportional to the CII column density along the line of sight (l.o.s.), irrespective of the optical depth of the medium (see also Sec.4.1). In this approximation, for each gas parcel of volumeV, we then compute the [CII] luminosity asL=εV.
2.1 CMB effects
The Cosmic Microwave Background (CMB) has a thermal black body spectrum at a local temperature ofTCMB0 =2.725 K, increasing with redshift asTCMB(z)=(1+z)TCMB0 . Assuming local thermal
equilibrium, this sets the minimum temperature of the ISM, which at high redshift becomes non-negligible. Any emission coming from the ISM will be seen against the CMB background. As discussed inDa Cunha et al.(2013), the contrast of the emission against the CMB radiation in the rest-frame is given by:
∆Iν=[Bν(Ts) −Bν(TCMB)] 1−e
−τ,
(2)
1
For each type of collision partner, the critical densitync ris defined by the collisional de-excitation rate being equal to the effective spontaneous decay rate. If the density is well belownc r, one can use theDalgarno & McCray(1972) definition for cooling rate as the product of singly ionised carbon density with hydrogen/electron number density.
0.0 0.5 1.0 1.5 2.0 2.5 3.0
log(n/cm
3)
0.0 0.2 0.4 0.6 0.8 1.0
z = 6
19
500
1000
T(
K)
Figure 1. CMB suppression of [CII] emission (η) as a function of gas number density (n). Different lines indicate different gas temperature (T). The suppression is calculated at redshiftz=6 via eq.3; see the text for the details of the calculation.
whereB(ν)is the Planck function andTsis the spin temperature of the FIR line. Assuming the [CII] line to be optically thin in the sub-mm band, i.e.e−τν ≈1−τν, the ratio between the flux observed against the CMB and the intrinsic flux emitted will be2:
η≡
Fobs ν/(1+z)
Fint ν/(1+z)
=1−Bν(TCMB) Bν(Ts)
. (3)
AsTsapproachesTCMB,η→0; in this case the CMB
com-pletely suppresses the line flux. For [CII], the spin temperature is defined using the ratio of the thermal equilibrium population of the upper (u: 2P3/2), and lower (l: 2P1/2) level of fine structure transition:
nu nl =
gu
gle
−T∗/Ts,
(4)
whereT∗ =91.7 K is the equivalent temperature of the level tran-sition, andgu = 4,gl =2 are the statistical weights. Following the procedure used inVallini et al.(2015) (see alsoPallottini et al. 2015),Tsis defined as:
T∗
Ts =ln
Aul(1+c 2Iν
2hν)+neC e ul+nHC
H ul
Aul(c
2Iν
2hν3)+neC
e ule
−T∗/T+n
HCulHe−T∗/T
, (5)
whereAulis the Einstein coefficient for spontaneous emission and Cule (CulH) is the collisional de-excitation rate for collisions withe
(H-atoms). For the [CII] line emissionAul=2.36×10⁻⁶s−1( Sug-inohara et al. 1999) andClue(T)=(8.63×10⁻⁶/gl
√
T)γlu(T)e−T∗/T withγlu(T)being the effective collision strength computed based onKeenan et al.(1986).CluH(T)is tabulated inDalgarno & McCray
(1972).
As discussed inGong et al.(2012), at high redshifts the soft UV background at 1330 Å produced by the first galaxies and quasars can pump the CII ions from the energy level 2s22p2P1/2 to
2s2p2 2D3/2(λ=1334.53 Å ), and 2s22p2P3/2to 2s22p22D3/2
2
FIR flux observed against CMB is defined asFobs
ν/(1+z)=(1+z)A∆Iν/d2L,
whereAis the physical area of the galaxy anddLis the luminosity distance.
(λ =1335.66 Å). This pumping effect can lead to the [CII] tran-sition 2D3/2 → 2P3/2 → 2P1/2 which would mix the levels of
the [CII] line. Similarly toVallini et al.(2015), we add this UV pumping effect in eq.5.
To summarise, withne,nH andT we can compute the spin temperature of [CII] line using eq. (5) and the CMB suppression using eq. (3). In Fig.1, the CMB suppression factor,η, is shown as a function of gas density for different temperatures and forz =6. We fix the metallicity to beZ =0.5 Zand vary the temperature. 3 The cooler the gas, the more the [CII] emission is suppressed.
Note that, independently ofT, the emission is suppressed by about 90% for low-density gas (n. 1 cm−3), because collisions are not efficient enough to decoupleTsfrom the temperature of the CMB, in agreement with results in the literature (Gong et al. 2012;Vallini et al. 2015;Pallottini et al. 2015).
3 SEMI-ANALYTICAL INSIGHTS
We start by developing a simple analytical model of a disk galaxy to elucidate the physics involved in shaping the line profile, and to build a controlled environment for the analysis of [CII] emission from high-zgalaxies. We consider a geometrically-thin disk and assume that the surface-brightness profile of the disk has an exponential form:
I(r) ∝exp(−r/rd), (6)
whererdis the disk scale length. If the mass surface density is also exponential with the same scale length, i.e.:
Σ(r)=Σ0exp(−r/rd), (7)
the potential that such a disk would generate at the equatorial plane is (Binney & Tremaine 2008):
Φ(r,0)=−πGΣ0r[I0(y)K1(y) −I1(y)K0(y)], (8) wherey =r/2rdandIn,Knare the modified Bessel functions of first and second kind, respectively. If we differentiate this potential with respect tor, we obtain the circular speed of the exponential disk (Freeman 1970):
v2
c(r)=4πGΣ0rdy2[I0(y)K0(y) −I1(y)K1(y)]. (9)
Using the circular velocityvc, we can define the velocity along the l.o.s. as follows:
v(r, θ, φ)2=4πGΣ
0rdy2[I0(y)K0(y) −I1(y)K1(y)]cos2φsin2θ ,
(10)
whereθis the angle between the l.o.s axis and the normal to the disk plane andφis the polar angle on the plane of the face-on disk. We assume a thin disk withΣ0=1000 M/pc2,rd=3 kpc, and a thickness of 100 pc.
For our kinematic analysis, it is useful to define a 2D Carte-sian grid centred on the galaxy centre. We choose a grid of size
(24 kpc)2divided in a total of(4×10³)2cells, i.e. each cell has a linear resolution of 6 pc. In each cell, surface density and velocities are computed using eqs.7and 10, respectively. We also account
3
200 150 100 50 0 50 100 150 200
v[km/s]
0 2 4 6 8 10 12 14
dL
/d
v[
10
9
L
/km
s
1
]
0
45
90
200 150 100 50 0 50 100 150 200
v[km/s]
0.0 0.5 1.0 1.5 2.0 2.5 3.0 3.5
dL
/d
v[
10
9
L
/km
s
1
]
0.2 0.3 0.4 0.5 0.6 0.7 0.8
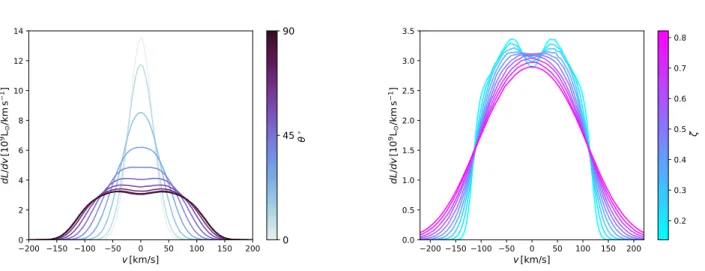
Figure 2. Spectral profile of a geometrically thin disk with an exponential profile.Left panel: Disk inclination is betweenθ =0◦(face-on) andθ =90◦ (edge-on). In addition to rotational velocities, isotropic turbulent motions extracted from a Gaussian distribution having an r.m.s. amplitude of 20 km s−1are added to the disk.Right panel: The inclination of the disk is fixed to be edge-on and we vary the amplitude of turbulent motions. Both inclination and large turbulent motions broaden the wings of the line and lower the amplitude by a factor of∼4 and∼1.2 respectively.
for random turbulent motions (i.e. deviations from perfect circular orbits) by adding in each cell a random velocity, the components (t) of which are extracted from a Gaussian distribution:
p(t)= 1
p
2πvt2 e−t2/2v2
t,
(11)
wherevtis the standard deviation of the distribution. We further assume isotropic turbulence so the three added components have the same magnitude.
Assuming a uniform temperature of 100 K4 for the disk, an ionisation fraction of xe =0.2, and a metallicity of Z =Z, we compute the [CII] luminosity using the model described in Sec.2. Having the l.o.s velocity and luminosity for each cell, we extract the integrated spectral profile by computing the histogram of velocities weighted by the corresponding value of [CII] luminosity.
First, we explore the effect of inclination of the disk by focusing on the spectral profile of the emission. In the left panel of Fig.2, we show the [CII] spectra from our disk galaxies including turbulent velocities withvt=20 km s−1. Different lines correspond to a dif-ferent inclination of the disk. As discussed byElitzur et al.(2012), the spectral profile of such a disk in the edge-on view (θ =90◦) should show a double peak structure. We see in Fig.2that inclining the disk from face-on view (θ =0) to the edge-on one smoothly changes the spectral profile from having a Gaussian shape to the double peak structure. Also inclining the disk towards edge-on pro-duces broader wings compared to the face-on case. In addition, the peak amplitude of the line decreases by factor of∼4 in the edge-on case. These effects happen because by inclining the disk towards the edge-on view, sin(θ) →1 (see eq.10) allows for stronger contribu-tions from high l.o.s. velocities. Consequently, the peak amplitude of the line decreases to keep the total [CII] luminosity, given by the integral below the curve, constant.
Random motions also change the spectral profile. In the right panel of Fig.2, we set the inclination of the disk to be edge-on
4
The reference temperatureT=100Kis the mean temperature found for molecular gas in our high-zgalaxies simulations, see Fig. 8 inPallottini et al.(2017b).
(double peak profile) and then varyvt. For each of the cases with different turbulence velocities, we calculateζ = vt/v¯c in which ¯
vc '75 km s−1 is the mass-weighted average circular velocity of the exponential disk. We find (Fig.2, right panel) that ifζ >0.5 the double peak profile is erased, which means that turbulent motions can mask the presence of the disk in the spectrum. Furthermore, and similarly to the effect of inclination discussed above, turbulence broadens the line wings and decreases the line intensity at the peak by a factor of∼1.2.
With these controlled case examples, we conclude that de-pending on the inclination of the disk and the amount of turbulent motions, emission from a rotating disk might produce quite a range of different line profiles. In particular, inclination and turbulence have a degenerate effect in changing the spectral shape of emission. The double peak signature of our rotating edge-on disk is erased either by changing the inclination (θ <70◦) or significant turbulent velocities (ζ >0.5). Similarly, the single Gaussian shape can be the signature of a highly turbulent disk or simply a face-on view of a disk with moderate turbulent motions.
Here, for a better comparison with the following analysis of the simulation (Sec.4), it is convenient to define two cases of our analytical model; Smooth Disk: a smooth disk withζ < 0.5 featuring a symmetric double-peak profile in the edge-on view and a single Gaussian profile in the face-on view and Turbulent dominated Disk: a Disturbed Disk withζ > 0.5, which has a smooth single Gaussian spectral profile both in the face-on and edge-on view.
4 HIGH REDSHIFT GALAXY SIMULATIONS
We now turn our analysis to the more realistic case of galaxies extracted from zoom-in cosmological simulations, whose main fea-tures are outlined below. This is a necessary step to produce reliable predictions that catch the ISM complexity during galaxy assem-bly and thus can be directly confronted with observational data. For details of the simulation, we refer the reader toPallottini et al.
(2017b).
Pallottini et al.(2017b) uses a customised version of the adap-tive mesh refinement code ramses (Teyssier 2002) to zoom-in on the evolution of “Althæa”, az ∼6 LBG hosted by a dark matter halo of mass'1011M. The gas mass resolution of the zoom-in region in this simulation is 1.2×10⁴Mand the additional adaptive refinement allows us to resolve spatial scales down to'30 pc at z∼6. In this simulation, a non-equilibrium chemical network has been implemented via the code krome (Grassi et al. 2014) which includes H, H+, H−, He, He+, He++, H2, H+2, and electrons (see also Bovino et al. 2016). Stars are formed according to the Kennicutt-Schmidt relation (Schmidt 1959;Kennicutt 1998) that depends on the molecular hydrogen density computed from the non-equilibrium chemical network. As described inPallottini et al.(2017a), stellar feedback includes supernovae, winds from massive stars, and radi-ation pressure. It also accounts for the blast wave evolution inside molecular clouds. The thermal and turbulent energy content of the gas is modelled similarly toAgertz & Kravtsov(2015).
At z = 6, Althæa is characterised by a stellar mass M? ∼
1010M and SFR ∼ 100 M/yr. During its evolution, the SFR-stellar mass relation of Althæa is comparable to what is inferred from high-z observations (Jiang et al. 2016). By modelling the internal structure of molecular clouds,Vallini et al. (2018) used Althæa to predict the CO line emission. By post-processing the simulation with radiation transfer through dustBehrens et al.(2018) were able to reproduce the observed properties of A2744_YD4 (Laporte et al. 2017), one of the most distant (z ≈8.3) galaxies where dust continuum is detected.
In this work we are interested in studying the evolution of Al-thæa fromz=7 toz=6 in its integrated [CII] surface brightness (luminosity), and the corresponding spectra along different l.o.s. identified by ˆn. Our aim is to investigate different kinematical fea-tures and their connection with the assembly process as imprinted in the [CII] line profile.
4.1 Computing [CII] maps and spectra
The first step is to compute the [CII] luminosity. For that, we need n,nH,ne,TandZas the inputs for the emission model (eq.1) and CMB suppression (eq.3). The first three parameters are computed by the simulation on-the-fly via the chemical network included in krome. Temperature in ramses is defined from the thermal pressure and the gas density (ρ= µmHn, where µandmH are the mean molecular weight and the hydrogen atom mass, respectively) by assuming an equation of state, i.e.T =(γ−1)Pk/ρ, withγ=5/3
being the adiabatic index.
To derive the spectrum, in addition to the above mentioned quantities, we need to know the l.o.s. velocity for each cell, namely
vi =V®i·nˆ, whereV®i is the simulated velocity field of the galaxy and ˆnthe l.o.s. direction. Having these quantities, we model the contribution of each simulatedithcell to the spectrum as a Gaussian function centred onvi with a widthσki,tand an amplitude equal to
the [CII] luminosity (LCIIi ) of that cell.σki,tis the broadening of the line for which we account for both the thermal and the turbulent
motions asσki,t =
q
(Pki +Pti)/ρi where Pti is the pressure due to the turbulent motions induced by the kinetic feedback in the simulation. For each velocity binvjwe compute the integrated line spectrumfj= fj(vj)as:
fj = Õ
i Li
CII
2
√
πσi k,t
e−
h
(vi−vj)/
√
2σki,t
i2
(12)
Having the spectrum as a function of the velocity bin, we define
Figure 3.Top panel: Surface brightness of [CII] emission of Althæa (view-ing face-on) at redshiftz =6.Bottom panel: The corresponding synthetic [CII] spectral profile. The spectrum either includes (red line) or does not include (yellow) turbulent broadening; in the latter case, only thermal broad-ening is taken into account. Turbulent motions smooth out the spectrum by erasing the spiky behaviour and decreasing the line intensity at the peak by 10%. The total spectrum shows two comparable peaks of emission with a relative difference of<15%.
the mean spectral velocity as:
hvi=
Í jvjfj Í
j fj
, (13)
which we use to centre the velocities in plotting the spectra. We compute the Full Width at Half Maximum (FWHM) of the line as the full width at which 68% of the light is contained.; note that in calculating FWHM we do not consider values of fj lower than 10 times the peak of the flux.
400 300 200 100 0 100 200 300 400
v[km/s]
0 1 2 3 4 5 6
dL
/d
v[
L
/km
s
1]
[CII] 157.74 m
0 30 45 60 90
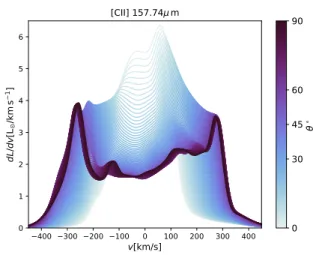
Figure 4.Synthetic spectra for Althæa atz =6 (see also Fig.3). Spectra are calculated for 100 inclinations between face-on (θ=0◦) and edge-on (θ =90◦) views. Changing the inclination clears the signature of rotating disk from the spectral shape, i.e. the two comparable peaks at the edges. From face-on to edge-on the peak amplitude of the line decreases by a factor of∼1.6.
4.2 An example of [CII] surface brightness and spectrum
We start by discussing the properties of [CII] emission coming from the face-on5view of Althæa atz =6 in a rectangular FOV of size 7 kpc around the centre of the galaxy. In Fig.3, we plot the l.o.s.-integrated surface brightness of the galaxy at this stage. The total [CII] luminosity isL[CII]=108.19L. The galaxy shows a relatively smooth disk-like structure, whose extent is∼2 kpc in [CII] emission. At this redshift, this translates to an angular size of 0.34 arcsec. For these early epochs, there is a clear hint of a broken spiral arm structure. The other interesting feature is the presence of bright clumps of size≈100 pc within the disk.
Also shown in Fig.3is the corresponding synthetic face-on [CII] line spectrum; for comparison, we also present the spectrum in which only thermal broadening is taken into account. The main effect of the inclusion of turbulent motions, self-consistently derived from the simulation in each cell, is to make the line profile smoother by erasing the narrow spikes visible in the thermal-only broadened profile. As seen in the analytical model (Sec.3), turbulent motions6 can suppress characteristic features of the spectrum, such as the double-peak profile of a rotating disk. Note that the maximum of the rotational velocity of the galaxy is of order∼190 km s−1(see also in Fig.7), while the level of turbulence for dense gas is of order ofσt ' 30 km s−1 (Vallini et al. 2018); thus the effect of micro-turbulence is limited with respect to the range of turbulence explored in the analytical model. Accounting for turbulent motions in Althæa decreases the line intensity at the peak by 10%, as it was expected from the analytical model.
5
With face-on we mean that we orient the l.o.s. parallel to the eigenvector of the inertia tensor of the gas density distribution with the largest eigenvalue. 6
Note that, the turbulence is defined differently in the simulation and the analytical model. In the analytical disk, every motion but the circular ones are treated as turbulence, while in simulation, turbulence is present because of the kinetic feedback. To make an exact comparison, one should fit a disk model to the simulated galaxy and then define the turbulence as it is in the analytical model.
As pointed out in Sec.3, a decreasing inclination can erase the signatures of a disk in the spectra, similar to what happens when increasing turbulent motions. To investigate the situation in our simulated galaxy, we extract [CII] spectra for 100 inclinations between the face-on and the edge-on view of Althæa disk atz=6 and we plot the result in Fig.4. Surprisingly, there are two com-parable peaks in the spectrum when Althæa is seen edge-on. This confirms that the gas in the ISM of this galaxy has already under-gone ordered rotation at such a high redshift. As expected from our analytical model (see Fig.2), changing the inclination of the disk washes out the signature of the rotating disk from the spectral pro-file. Changing the inclination of the disk fromθ=0◦toθ=90◦, the peak amplitude of the line decreases by a factor of 1.6. With respect to the analytical disk, spectral profiles contain complicated structures which are due to the asymmetries and clumpy structure of the [CII] emitting gas. The degeneracy between inclination and turbulent motions is also present in the case of simulated disk but it is more complicated (explored in the analytical model, Fig.2). Inclining the disk towards face-on not only masks the spectral sig-nature of the disk but also affects the appearance or disappearance of various bumps and structures in the profile.
4.3 Galaxy evolution traced by [CII]
With the tools in hand (emission maps and spectra), now we con-centrate on studying the evolution of Althæa in a redshift range of 6.09<z<7 (corresponding to a time span of 183 Myr) when the system is in a very active assembling phase. In Fig.5, we show the face-on emission maps of Althæa in that redshift range. The time lapse among different panels is∼16 Myr and the images are taken in a FOV of 7 kpc. At the earliest epochs, the galaxy is constituted by a small (≈500 pc) disk surrounded by several emission knots of size<100 pc, which are feeding the central part through filaments. As time progresses, the disk grows in size and mass in an inside-out fashion, forming a compact core while acquiring mass from the satellites which are progressively disrupted and embedded in the disk. Atz =6.48, a merger event occurs, which is clearly seen in Fig.5. The merger event dramatically perturbs the quasi-smooth disk structure, resulting in the very irregular and widespread emis-sion seen atz =6.38. However, the gravitational potential of the galaxy is able to restore the disk in less than 16 Myr.
Among these stages, we select three particularly interesting stages for further analysis based on their [CII] emission morphol-ogy:
Merger: atz=6.48, when Althæa experiences a merger event. The satellite in this stage has no stars but is hosted in a dark matter sub-halo that is about to merge with the galaxy. The total [CII] lu-minosity at this stage is 107.87L.
Spiral Disk: atz=6.28, the ISM of Althæa has relaxed into a disk which has a spiral arm in one side. The total [CII] luminosity at this stage is 107.71L.
Disturbed Disk: this stage corresponds toz=6.18 in which disk has been vertically disrupted. The total [CII] luminosity at this stage is 107.86L.
In the two middle panels of Fig.6, [CII] images for the face-on and edge-on views of the above selected stages are shown. These stages are selected because they have distinct differences in morphology and structure which in principle can evoke differences in the spectral profile of the emission. Furthermore, we plot the l.o.s. velocity profiles of these stages in Fig.7. These profiles are not monotonic and contain several bumps and peaks. This is an indication of the
3
2
1
0
1
2
3
kpc
3
2
1
0
1
2
3
kpc
z = 7.21
z = 7.1
z = 6.99
z = 6.88
3
2
1
0
1
2
3
kpc
3
2
1
0
1
2
3
kpc
z = 6.78
z = 6.68
z = 6.58
z = 6.48
3
2
1
0
1
2
3
kpc
2
0
2
kpc
3
2
1
0
1
2
3
kpc
2
0
2
kpc
z = 6.38
2
0
2
kpc
2
0
2
kpc
z = 6.28
2
0
2
kpc
2
0
2
kpc
z = 6.18
2
0
2
kpc
2
0
2
kpc
z = 6.09
3.0
4.5
6.0
7.5
log
(L
CII/L
/kp
c
2
)
3.0
4.5
6.0
7.5
log
(L
CII/L
/kp
c
2
)
Figure 5.[CII] surface brightness of Althæa during its evolution in redshift range of 6.09<z <7. Time is increasing from left to right, top to bottom. Neighbouring panels are separated by∼16 Myr.
complex velocity structure of the gas. In the following, we compare these stages of the simulation with each other and also with the cases defined in our analytical model in terms of their spectral profile.
Recall from the analytical model that a double-peak profile is a signature of having a rotating disk in the system while a single peak Gaussian profile can be a signature of either a Disturbed Disk or a face-on view of a rotating disk (Sec.3). We apply the spectra diagnostic to the face-on and edge-on views of the above defined stages. As visible in the [CII] images, multiple structures are present in the ISM of these systems, beyond the central 2 kpc. To distinguish between the central disk and the environment of the system, we extract the spectra for each of the stages in two FOV sizes, 7 kpc and 2 kpc. In the left panels of Fig.6, these spectra for the face-on view of the stages are plotted, while in the right panels the spectra for the edge-on views are plotted.
The profile of the face-on view of all the stages contain a dominant single peak but they are different in comparison to Smooth Disk and Turbulent dominated Disk defined in the semi-analytical model.
The face-on profile of the Merger stage has a FWHM = 167 km s−1 and the profile shows two merged peaks located at
v = −100 km s−1 and v = 0km s−1; the major peak is due to the central disk while the addition of [CII] from the starless satellite produces the secondary peak in the profile. The face-on view of the Spiral Disk with an asymmetric Gaussian shape has a FWHM=100 km s−1and peak flux of∼0.35mJy. The asymmetry of the profile reflects the asymmetric kinematics of the [CII] emit-ting gas. Instead the spectral profile of the Disturbed Disk in face-on view is semi-symmetric but it is wider (FWHM=143 km s−1) in
the core because of the extra-planar flows perpendicular to the disk plane; such extra-planar flows can contribute to∼10% of the total signal, as it is analysed inGallerani et al.(2018).
In summary, the presence of broken spiral arm, extra-planar flows and a merging satellite encode spectral signatures as asym-metric Gaussian peaks in the profile, broadening the core of the spectrum and a quite dominant peak very close to the disk’s main peak in the face-on spectral profiles respectively.
We perform a similar comparison for the edge-on spectra. The situation for the edge-on profiles is more complicated because the spectra of the simulated stages are very structured. The edge-on profile of the Merger stage (with peak of∼ 0.14 mJy) contains dominant asymmetric double-peaks (with relative difference of∼ 18%) because of the presence of the central rotating disk. Various bumps are present in the total spectrum and the most prominent one is due to the satellite: its magnitude is comparable to that of the horns of the disk, it is centred aroundv = +100 km s−1 and has a velocity extension of∼300 km s−1. Since this stage shows a clear hint of rotation in the spectrum, it implies that distinguishing systems with close mergers from a rotating system is very difficult using only spectra (Simons et al. 2019).
Spiral Disk
Disturbed Disk Merger
z = 6.48
z = 6.28
z = 6.18
Figure 6.Left panel: [CII] spectra for the face-on inclinations taken from FOV=7 kpc (red solid lines) and FOV=2 kpc (blue solid lines). Middle panels: Face-on and edge-on emission maps for Althæa in different representative stages of evolution: Merger stage (top), Spiral Disk (centre), and Disturbed Disk (bottom). Right panel: [CII] spectra for the edge-on inclinations taken from FOV=7 kpc (red solid lines) and FOV=2 kpc (blue solid lines).
0.0 0.5 1.0 1.5 2.0 2.5
r(kpc)
0 50 100 150 200 250 300
v(
km
/s)
Merger
Spiral Disk
Disturbed Disk
Figure 7.Velocity structure of Althæa in different evolutionary stages (see Fig.6) in the edge-on view.
in the profiles of the analytical disk. The bumps in the spectrum are due to external gas (>2 kpc) flowing into the disk. In this case, the contribution of the co-planar spiral arm to the edge-on spectrum becomes more prominent making the high-velocity tails.
As it is expected from the analytical model, the edge-on
pro-file of the simulated Disturbed Disk does not have rotating double peaks. However, instead of having a smooth single Gaussian profile, there is an asymmetric Gaussian profile(centred on v=200km s−1) including multiple peaks in the long skewed tail. There is a rela-tive difference of∼80% between the main peak of the spectrum and the lowest bump in the tail. The presence of extra-planar flows suppresses the blue part of the spectrum masking the signature of rotating disk which was present in the Spiral Disk profile. Recall that Disturbed Disk stage is just 16 Myr after the Spiral Disk stage in the evolution of Althæa.
The spectra for the simulated galaxy are very structured and complicated. To properly interpret the component analysis, it is required to apply full dynamical studies and extract the spectra for different velocity channels of the system. This is beyond the scope of the present paper and is left for future studies.
5 OBSERVATIONAL IMPLICATIONS
Investigating the evolution of Althæa, we have seen how the struc-tural and kinematical differences result in various spectral profiles which depend on morphological properties, and inclination of the galaxy (Fig.4). In this Section, we analyse the implications of these results from an observational point of view.
For the synthetic spectra, we use the three different stages of Althæa discussed in Sec.4.3. Our results are compared with observations of a sample of 5.2< z <7.1 galaxies for which the spectra of [CII] line have been obtained with ALMA (Ouchi et al.
Table 1.Sample of high-zgalaxies probed by [CII] line.
Target Name ID z log(L[CII]/L) FWHM/km s−1 Reference
UDS16291 U16 6.64 7.9 50 Pentericci et al.(2016)
RXJ1347:1216 RXJ 6.77 7 75 Bradač et al.(2017)
COSMOS13679 C13 7.15 7.9 90 Pentericci et al.(2016)
WMH5b WMH5b 6.07 8.4 94 Jones et al.(2017);Willott et al.(2015)
A385-5.1 A38 6.03 6.9 100 Knudsen et al.(2016)
BDF3299 B32 7.15 7.8 102 Maiolino et al.(2015);Carniani et al.(2017)
COS-2987030247 C29 6.81 8.6 124 Smit et al.(2018)
HZ8w HZ8W 5.15 8.3 136 Capak et al.(2015)
COSMOS24108a C24a 6.63 7.9 150 Pentericci et al.(2016)
COSMOS24108 C24 6.63 8.1 150 Pentericci et al.(2016)
BDF2203 B22 6.12 8.1 150 Carniani et al.(2018a)
CLM1 CLM1 6.17 8.4 162 Willott et al.(2015)
HZ1 HZ1 5.69 8.4 165 Capak et al.(2015)
HIMIKO HIMIKO 6.60 8.1 180 Ouchi et al.(2013);Carniani et al.(2018b)
HZ6 HZ6 5.29 9.2 188 Capak et al.(2015)
HZ3 HZ3 5.54 8.7 200 Capak et al.(2015)
COS-3018555981 C30 6.85 8.7 230 Smit et al.(2018)
NTTDF6345 N63 6.70 8.2 250 Pentericci et al.(2016)
WMH5 WMH5 6.07 8.7 251 Jones et al.(2017);Willott et al.(2015)
HZ8 HZ8 5.15 8.7 254 Capak et al.(2015)
WMH5a WMH5a 6.07 8.5 270 Jones et al.(2017);Willott et al.(2015)
HZ4 HZ4 5.54 9.0 297 Capak et al.(2015)
B14-65666 B14 7.15 9.1 349 Hashimoto et al.(2018)
HZ9 HZ9 5.54 9.2 351 Capak et al.(2015)
HZ2 HZ2 5.66 9.0 377 Capak et al.(2015)
HZ7 HZ7 5.25 8.7 483 Capak et al.(2015)
0 30 45 60 90
100 200 300 400 500
FWHM(km/s)
max
min
50%
75%
25%
Merger
Spiral Disk
Disturbed Disk
Figure 8. The FWHM of Althæa spectra as a function of inclination. Each line corresponds to a different evolutionary stage (see Fig.6). As a reference, we over-plot the statistical properties of the FWHM from observed in high-redshift galaxies (see Table1).
2013;Wang et al. 2013;Capak et al. 2015;Pentericci et al. 2016;
Jones et al. 2017;Carniani et al. 2017). For reference, these objects are listed in Table1, along with their redshift, total [CII] luminosity (LCII) and FWHM of the [CII] line.
5.1 Dynamical mass estimates
By assuming a rotating disk geometry (with radius R) for the [CII] emitting gas, the dynamical mass can be estimated as:
Mdyn=v
2 cR
G . (14)
From a [CII] spectrum obtained with a high signal to noise ratio and a good sampling of the velocity channels one can estimatevc from the FWHM of the line using the following expression:
FWHM=γvcsinθ , (15)
whereγis a factor of order of unity that depends on geometry, line profile, and turbulence. Different values have been assumed in the literature forγ: for example,Capak et al.(2015) assumedγ=1.32. Using eq.s14and15, the general expression for the dynamical mass is:
Mestdyn=2.35×10⁹M
1
γ2sin2θ
FWHM
100 km s−1
2
R
kpc
. (16)
Before discussing the mass estimates, let us consider the FWHM of the spectra. We plot them as a function of inclination in Fig.8. In general, the FWHM in Althæa is an increasing func-tion of inclinafunc-tion and varies from a minimum of 100 km s−1in the face-on case to a maximum of 480 km s−1for the edge-on case. In the same Figure we compare the simulated FWHM with the one inferred from observations of high-zgalaxies (Tab.1). The bulk of the observed spectra have a [CII] line FWHM around 180 km s−1 that is compatible with that found from Althæa seen face-on. Note that Althæa has a dynamical mass Mdyn ' 1010M, while the
150 200 250 300 350 400 450
FWHM (km/s)
1.00 0.75 0.50 0.25 0.00 0.25 0.50
log
M
from simulation
150 200 250 300 350 400 450
FWHM (km/s)
1.00 0.75 0.50 0.25 0.00 0.25 0.50
log
M
= 30
150 200 250 300 350 400 450
FWHM (km/s)
1.00 0.75 0.50 0.25 0.00 0.25 0.50
log
M
= 60
Merger
Spiral Disk
Disturbed Disk
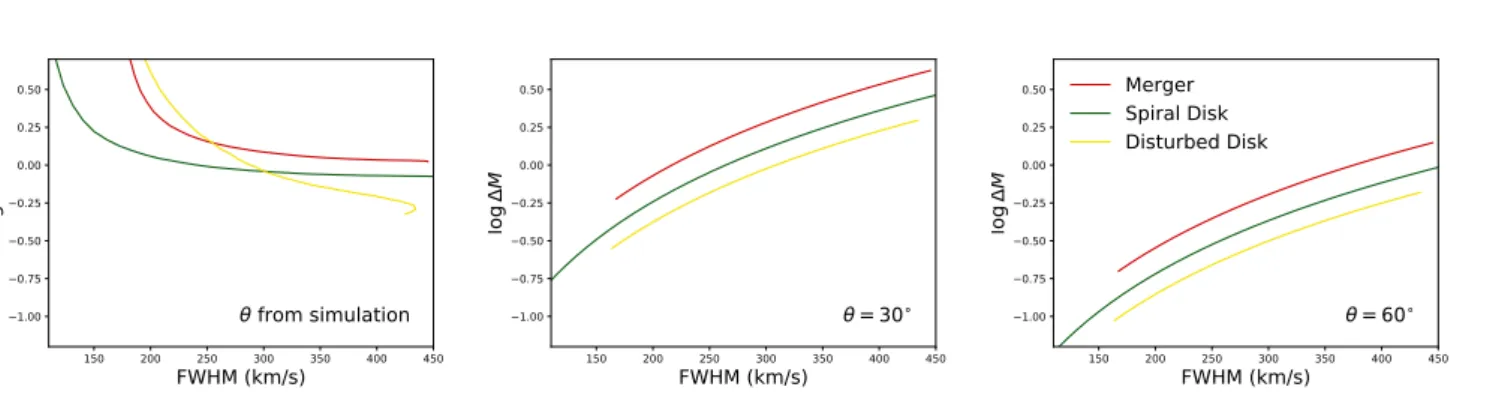
Figure 9. Analysis of the error in the dynamical mass determination using empirical estimates16. The mass-error-function (∆M, eq.17) is plotted as a function of the FWHM for known inclination, as calculated in the simulation (left panel), and by assuming a fixed inclination of 30◦(central panel) and 60◦ (right panel). Different lines indicate the three selected evolutionary stages (see Fig.6).
1.6 1.8 2.0 2.2 2.4 2.6
log(FWHM(km/s))
6.57.0 7.5 8.0 8.5 9.0 9.5
log
(L
CII/L
)
U16
RXJ C13 WMH5b
A38 B32
C29 HZ8W
C24aC24 HZ1
HZ6
HZ3
N63 HZ8 WMH5a
HZ4 B14HZ9HZ2 HZ7 CLM1
HIMIKO C30
WMH5 Fit: = 1.8, = 4.32
Theory: = 2, = 4.22 Merger
Spiral disk Disturbed disk
Figure 10.Correlation betweenLCIIand FWHM for the sample of observed high-zgalaxies (black dots, Tab.1). The red line indicates the fit to the data (functional form and parameters in eq.s18). The blue line indicates the approximate relation given in eq.21assumingR=1 kpc and sinθ=0.5.
We are interested in assessing the reliability of the dynamical mass estimates obtained from eq. 16 as a function of [CII] line FWHM. The radius of the disk is computed from the [CII] image asR'r80, i.e. the effective radius of of the system containing 80%
of the total [CII] luminosity. For the three aforementioned stages of Althæa, R' 1 kpc. It is convenient to define the “mass-error-function”, i.e.
∆M≡Mest
dyn/Mdyn, (17)
that parametrises the error in the mass estimates using eq.16, that depends onγ. We calculateγfrom our simulation depending on the stage of the evolution. The value ofγfor the Spiral Disk, Disturbed Disk and the merger stage is 1.78, 2.03 and 1.52, respectively.
In Fig.9, we plot∆Mas a function of the FWHM for Althæa. In the left panel estimates are performed by using the information on the inclination obtained from the simulation. The minimum of ∆M=0.4 is found for large FWHM (≥350 km s−1). At low FWHM ∆M becomes very large asMdynest ∝1/sin2θ. In all cases we find ∆M >1 for low FWHM and∆M <1 at high FWHM. This means
that by using eq.16 we tend to underestimate (overestimate) the
dynamical mass at high (low) FWHM, or, equivalently, inclinations (see the left panel of Fig.9).
It is interesting to calculate the mass-error-function for fixed inclinations,θ=30◦andθ=60◦. These two values are generally assumed whenθcannot be directly determined from observations. This can happen when the spatial resolution does not allow us to constrain the inclination, as inCapak et al.(2015), that calculate the dynamical masses by assuming sinθ=0.45−1. Results are shown in the central and right panels of Fig.9. Forθ=60◦,∆M<1 except for the high inclinations of the merger stage, while forθ=30◦the dynamical mass is typically overestimated, up to a factor'4. The error of the estimate is comparable with the one reported for the sample ofCapak et al.(2015), where the authors concluded that at z>5 the dynamical masses are typically a factor of∼3 greater than the stellar masses. This should be confronted with the analogous factor of 1.2−1.7 measured atz∼1−3 (Förster Schreiber et al. 2009).
The mass estimates eq.16is based on the assumption that the galaxy has a smooth disk. However, our simulations show that high-z galaxies have more complex dynamical structures which result in correspondingly complex spectra. As observations are progres-sively becoming more precise, a better modelling of kinematics and velocity structure of the galaxies is required (e.g.Di Teodoro & Fraternali 2015).
5.2 Tully-Fisher relation for high-zgalaxies
In Fig.10, we plot the observedL[CII]– FWHM relation for the high-zgalaxy sample in Tab.1. The best-fit to the data is
log(L[CII]/L)=αlog(FWHM/km s−1)+β , (18a) with
α=1.80±0.35, (18b)
β=4.32±0.78. (18c)
The Pearson coefficient is'0.74, suggesting a statistically reliable correlation between these two parameters. The three stages of Al-thæa (viewed face-on) are shown as triangles in this plot. They fall within 1σfrom the best-fit curve.
Such relation resembles theTully & Fisher(1977) relation. Its existence is not surprising because of the link betweenL[CII]
and the dynamical mass. As a rough estimate (see (Pallottini et al. 2017a) for an extensive discussion), we can assume a constant ratio
0.0
0.2
5
v =100km/s v =5km/s
0.0
0.2
5
v =100km/s v =5km/s
0.0
0.2
5
v =150km/s v =5km/s
0.0
0.2
5
v =150km/s v =5km/s
0.0
0.2
5
v =200km/s v =5km/s
0.0
0.2
5
v =200km/s v =5km/s
0.0
0.2
5
v =250km/sv =5km/s
0.0
0.2
5
v =250km/sv =5km/s
400
200
0
200
400
v[km/s]
0.0
0.2
F
v
[m
Jy]
5
v =300km/sv =5km/s
400
200
0
200
400
v[km/s]
0.0
0.2
5
v =300km/sv =5km/s
Figure 11. Comparison of the [CII] observability for face-on orientations (left panels) vs edge-on (right panels) ones when Althæa has log(LCII/L)=7.7, at
z=6.28 (Spiral Disk). From top to bottom the spectrum is re-binned with an increasing channel width (∆v). As a reference, the∆v=5km s−1case is reported in all panels. The dashed horizontal line corresponds to 5σnoise level, that is calculated by assuming a 10 hours ALMA observation.
between the total [CII] luminosity and the gas mass in a high-z galaxy; thus we can write
κ= L[CII]
Mg = L[CII]
fgMb
, (19)
where fgis the gas fraction of the baryonic mass (Mb). Using eq.
16and defining fDM=MDM/Mbas the ratio between dark matter
and baryonic mass, the relation betweenL[CII]and the FWHM of
the line reads as
L[CII]=
κR G
f
g
1+fDM
FWHM
γsinθ
2
. (20)
γ'1.7, fg'0.5, andfDM'0.5; thus eq.20can be written as
L[CII]'5.4×10⁷L
1
sin2θ
FWHM
100 km s−1
2
R
kpc
. (21)
Further, fixingR=1 kpc and sinθ=0.5 we can express logLCII vs FWHM as in18awith parameters
α=2 (22a)
β=4.22 (22b)
which is within 1σfrom the fit (eq.18).
As a final remark, we note that in Fig.10, there is a lack of data in both the low FWHM-highL[CII]and the high FWHM-low L[CII]regions. While the first occurence is physically motivated (it is unlikely that low mass galaxies have large luminosities), the sec-ond one might arise from an observational bias. In fact, as [CII] is optically thin, its luminosity is constant with inclination. As a con-sequence, as the FWHM increases, the peak flux might drop below the detection threshold. We investigate this issue in the next Section.
5.3 Observations of edge-on vs face-on galaxies
We now check the detectability of [CII] line for face-on and edge-one inclinations by performing mock ALMA observability sim-ulations. We select the Spiral Disk evolutionary stage, i.e. when Althæa has luminosity log(LCII/L)=7.7, similar to the one
in-ferred for BD3299 (Maiolino et al. 2015;Carniani et al. 2017). As for BD3299 observation (Carniani et al. 2017), we assume a 10 hours integration time with ALMA. We consider the edge-on and face-on inclinations and we re-bin the spectra with channel width in the range 100≤∆v≤300, i.e. the typical one used when searching for lines in normal star forming galaxies (SFR.100M/yr).
The results of such analysis are shown in Fig.11where we also plot the 5σnoise level for some selected values of∆v. The face-on case is detected at>5σfor all considered∆v, thus yielding a FWHM∼100 km s−1which is very similar to what is reported for BDF3299 inCarniani et al.(2017). However, the edge-on case with a larger intrinsic FWHM=479 km s−1would be always undetected. Stated differently, the large l.o.s. velocities smear out the spectrum, making the detection more challenging if the galaxy is seen edge-on. This suggests that some of the non-detections reported at high-z might be due to inclination effects when the target is close to edge-on. Note that here we are assuming that no beam smearing effects are in place, that is equivalent to assume that we marginally resolve the flux from the galaxy. This interpretation must be substantiated in a future work with better quantifying channel noise and spatial correlations of the ALMA beam.
6 SUMMARY AND CONCLUSIONS
We have studied the structural and kinematical properties of galaxies in the Epoch of Reionization (z ≥ 6) as traced by the spectral profile of the [CII] emission line. The emission is computed from an analytical model accounting for gas cooling via the [CII] line (Dalgarno & McCray 1972;Wolfire et al. 1995;Vallini et al. 2013), and it includes CMB suppression of the line intensity (Da Cunha et al. 2013;Pallottini et al. 2015;Vallini et al. 2015).
First, we have applied our model to an idealised rotating disk galaxy, in order to investigate the effect of disk inclination (θ) and turbulent velocities (vt) on the line profile. From this con-trolled environment, we have found that both large turbulent mo-tions (vt/v¯c=ζ >0.5, where ¯vc'75 km s−1is the galaxy circular
velocity) and inclination anglesθ <75◦erase the double-peak line profile, expected from a rotating disk galaxy. In particular, we find that the peak flux of [CII] emission for face-on (θ =0◦) can be a factor∼4 higher than in the edge-on view (θ =90◦). Next, we have used zoom-in cosmological simulations of a prototypical Ly-man break galaxy (“Althæa”, Pallottini et al. 2017b) to analyse the [CII] emission properties during its evolution in the redshift range 6. z . 7. Information on velocities, thermal, and turbu-lent motions included in the simulation, enabled us to build the [CII] surface brightness maps of Althæa and the synthetic spectra. Atz=6.0, Althæa has a total [CII] luminosityL[CII]=108.19L; this value accounts for a factor∼2 suppression due to the CMB (see Fig.A1). At this epoch and viewed face-on, the [CII] emission map shows a smooth, disk-like structure with an extent of∼2 kpc, on top of which are superimposed clumps with typical sizes of∼100 pc. From the analysis of the [CII] line profile, we find that the effect of turbulent motions is to smooth out the spectrum by broadening the thermal profiles and to decrease the peak line intensity by∼10%. The degeneracy between turbulent motions and inclination is also present in the spectra of Althæa, that has aζ '0.15. The edge-on spectral profile of this stage is indicative of a rotating disk, i.e. it shows a double peak profile. Decreasing the inclination progres-sively washes out the disk signature from the profile and increases the peak flux by a factor of'1.6.
Studying the morphology of Althæa in the redshift range 6≤z ≤7, we have identified three main evolutionary stages with distinct spectral signatures: I) Merger, II) Spiral Disk, and III) Dis-turbed Disk. The irregular and choppy structure of the l.o.s. velocity profiles resulting from the simulations (see Fig.7) translates into more structured [CII] line profiles with respect to the analytical model. Comparing the synthetic spectra for different stages of Al-thæa with the ones from the analytical model, we identify the spec-tral signatures of merger events, spiral arms and extra-planar flows in the respective stage both in the face-on and edge-on profiles. The main signatures are summarised as follows:
Merging Satellites: the face-on profile of the merger stage of Althæa has a peak flux of∼0.27 mJy, with a second peak in the blue part centred onv=−100 km s−1. The major peak of the spectrum is due to the central disk, while the second peak is produced by the starless satellite. In the edge-on case, the spectrum shows an asymmetric double peak along with multiple peaks in the core due to co-rotating clumps. The signature of the merging satellite is visible as a broad peak (with spectral extent of 300 km s−1) in the red side of the double peak profile (centred aroundv= +100 km s−1).
Spiral armsmanifest in the asymmetric Gaussian profile of the face-on spectrum of the Spiral Disk stage. In the edge-on view, the signature of spiral arms is contained in the asymmetry of the double-peak profile corresponding to the rotating disk.
Extra-planar flows: the [CII] spectrum for the face-on view of Disturbed Disk stage features a quasi-symmetric Gaussian profile which has a broader core and more prominent wings compared to the Spiral Disk. Instead, in the edge-on view, extra-planar flows tend to erase the blue peak of the line profile, hence masking the rotating disk characteristic feature.
Finally, we have discussed the observational implications of our analysis by comparing them to [CII] observations of high-z galaxies (see Tab.1). The bulk of the observed spectra have FWHM∼180 km s−1, that is compatible with face-on spectra of Althæa. Our key results are the followings:
Dynamical mass estimates: we derived a generalised form of
the dynamical mass vs. [CII]-line FWHM relation (eq.16) which depends on the dynamical state of the galaxy. If precise information on the galaxy inclination is available, the returned mass estimate is accurate within a factor∼2. If the inclination is not constrained, the error increases up to a factor of'4. These errors are due to the fact that high-zgalaxies have a complex dynamical structure and the assumption of a smooth disk used in the derivation of eq.16is not fully valid.
Tully-Fisher relation: we find a correlation between theL[CII]
and FWHM of the [CII] line by fitting the values for the sample of high-zgalaxies, i.e.L[CII]∝ (FW H M)1.80±0.35(eq.s18). This can be understood from simple physical arguments that are embedded in the relation given in eq.20. By fixing the inclination and radius of the galaxy, we find that such approximate theoretical expression (eq.21) is consistent with the empirical relation.
Inclination and detectability: we have performed mock ALMA simulations to check the detectability of [CII] line for face-on and edge-face-on views. We cface-onsider a fixed integratiface-on time (10 hr) and rebin the spectra of the Spiral Disk stage with channel width in the range of 100 km s−1 ≤∆v ≤300 km s−1. When seen face-on, the galaxy is always detected at > 5σ; in the edge-on case it remains undetected because the larger intrinsic FWHM pushes the peak flux below the detection limit. This suggests that some of the non-detections reported for high-zgalaxies might be due to inclination effects.
ACKNOWLEDGEMENTS
MK acknowledges the support from the ESO-SSDF 18/24 grant and hospitality by European Southern Observatory in Munich, where part of this work has been developed. MK, AF and SC ac-knowledge support from the ERC Advanced Grant INTERSTEL-LAR H2020/740120. LV acknowledges funding from the European Union’s Horizon 2020 research and innovation program under the Marie Sklodowska-Curie Grant agreement No. 746119. This re-search was supported by the Munich Institute for Astro- and Par-ticle Physics (MIAPP) of the DFG cluster of excellence “Origin and Structure of the Universe”. We acknowledge use of the Python programming language (Van Rossum & de Boer 1991), Astropy (Astropy Collaboration et al. 2013), Cython (Behnel et al. 2011), Matplotlib (Hunter 2007), NumPy (van der Walt et al. 2011), pym-ses (Labadens et al. 2012), and SciPy (Jones et al. 2001). Also, we are thankful to the anonymous referee for insightful comments and valuable suggestions.
REFERENCES
Agertz O., Kravtsov A. V., 2015,ApJ,804, 18
Asplund M., Grevesse N., Sauval A. J., Scott P., 2009,ARA&A,47, 481 Astropy Collaboration et al., 2013,A&A,558, A33
Barkana R., Loeb A., 2001,Phys. Rep.,349, 125
Behnel S., Bradshaw R., Citro C., Dalcin L., Seljebotn D., Smith K., 2011, Computing in Science Engineering, 13, 31
Behrens C., Pallottini A., Ferrara A., Gallerani S., Vallini L., 2018,MNRAS, 477, 552
Binney J., Tremaine S., 2008, Galactic Dynamics: Second Edition. Princeton University Press
Bouwens R. J., et al., 2015,ApJ,803, 34
Bovino S., Grassi T., Capelo P. R., Schleicher D. R. G., Banerjee R., 2016, A&A,590, A15
Bradač M., et al., 2017,ApJ,836, L2 Capak P. L., et al., 2015,Nature,522, 455
Carniani S., et al., 2017,A&A,605, A42 Carniani S., et al., 2018a,MNRAS,478, 1170
Carniani S., Maiolino R., Smit R., Amorín R., 2018b,ApJ,854, L7 Da Cunha E., et al., 2013,Astrophysical Journal, 766
Dalgarno A., McCray R. A., 1972,ARA&A,10, 375 Dayal P., Ferrara A., 2018, preprint, (arXiv:1809.09136) De Looze I., et al., 2014,A&A,568, A62
Di Teodoro E. M., Fraternali F., 2015,MNRAS,451, 3021
Elitzur M., Asensio Ramos A., Ceccarelli C., 2012,MNRAS,422, 1394 Fan X., et al., 2006,AJ,132, 117
Ferrara et al., in prep. 2019,-,0, 0
Förster Schreiber N. M., et al., 2009,ApJ,706, 1364 Förster Schreiber N. M., et al., 2018,ApJS,238, 21 Freeman K. C., 1970,ApJ,160, 811
Gallerani S., Pallottini A., Feruglio C., Ferrara A., Maiolino R., Vallini L., Riechers D. A., Pavesi R., 2018,MNRAS,473, 1909
Genzel R., et al., 2011,ApJ,733, 101 Gnedin N. Y., 2000,ApJ,535, 530
Goldsmith P. F., Langer W. D., Pineda J. L., Velusamy T., 2012,ApJS,203, 13
Gong Y., Cooray A., Silva M., Santos M. G., Bock J., Bradford C. M., Zemcov M., 2012,ApJ,745, 49
Grassi T., Bovino S., Schleicher D. R. G., Prieto J., Seifried D., Simoncini E., Gianturco F. A., 2014,MNRAS,439, 2386
Habing H. J., 1968, Bull. Astron. Inst. Netherlands,19, 421 Hashimoto T., et al., 2018, arXiv e-prints,p. arXiv:1806.00486 Hunter J. D., 2007,Computing in Science Engineering, 9, 90 Jiang L., et al., 2016,ApJ,816, 16
Jones E., Oliphant T., Peterson P., et al., 2001, SciPy: Open source scientific tools for Python,http://www.scipy.org/
Jones G. C., Willott C. J., Carilli C. L., Ferrara A., Wang R., Wagg J., 2017, ApJ,845, 175
Katz H., et al., 2019, arXiv e-prints,p. arXiv:1901.01272
Keenan F. P., Lennon D. J., Johnson C. T., Kingston A. E., 1986,MNRAS, 220, 571
Kennicutt Jr. R. C., 1998,ApJ,498, 541
Knudsen K. K., Richard J., Kneib J.-P., Jauzac M., Clément B., Drouart G., Egami E., Lindroos L., 2016,MNRAS,462, L6
Labadens M., Chapon D., Pomaréde D., Teyssier R., 2012, in Ballester P., Egret D., Lorente N. P. F., eds, Astronomical Society of the Pacific Conference Series Vol. 461, Astronomical Data Analysis Software and Systems XXI. p. 837
Laporte N., et al., 2017,ApJ,837, L21 Leung T. K. D., et al., 2019,ApJ,871, 85 Luhman M. L., et al., 1998,ApJ,504, L11
Luhman M. L., Satyapal S., Fischer J., Wolfire M. G., Sturm E., Dudley C. C., Lutz D., Genzel R., 2003,ApJ,594, 758
Madau P., Haardt F., Rees M. J., 1999,ApJ,514, 648 Maiolino R., et al., 2015,MNRAS,452, 54 Malhotra S., et al., 1997,ApJ,491, L27 Matthee J., et al., 2017,ApJ,851, 145
McGreer I. D., Mesinger A., Fan X., 2011,MNRAS,415, 3237
Olsen K., Greve T. R., Narayanan D., Thompson R., Davé R., Niebla Rios L., Stawinski S., 2017,ApJ,846, 105
Ouchi M., et al., 2013,ApJ,778, 102
Pallottini A., Gallerani S., Ferrara A., Yue B., Vallini L., Maiolino R., Feruglio C., 2015,MNRAS,453, 1898
Pallottini A., Ferrara A., Gallerani S., Vallini L., Maiolino R., Salvadori S., 2017a,MNRAS,465, 2540
Pallottini A., Ferrara A., Bovino S., Vallini L., Gallerani S., Maiolino R., Salvadori S., 2017b,MNRAS,471, 4128
Pallottini A., et al., 2019, arXiv e-prints,p. arXiv:1905.08254 Pentericci L., et al., 2016,ApJ,829, L11
3 2 1 0 1 2 3
kpc
3 2 1 0 1 2 3 kpc
3 2 1 0 1 2 3
kpc
3 2 1 0 1 2 3
kpc 33 22 11 kpckpc00 11 22 33 5.6 6.4 7.2 8.0
log
(L
CI
I
/L
/kp
c
2)
5.6 6.4 7.2 8.0
log
(L
CI
I
/L
/kp
c
2)
Figure A1.[CII] surface brightness of Althæa at redshiftz=6. In the left panel (Ltot =108.19L) the effect of CMB is included while in the right panel (Ltot=108.52L) it is not.
Stacey G. J., Geis N., Genzel R., Lugten J. B., Poglitsch A., Sternberg A., Townes C. H., 1991,ApJ,373, 423
Suginohara M., Suginohara T., Spergel D. N., 1999,ApJ,512, 547 Teyssier R., 2002,A&A,385, 337
Tully R. B., Fisher J. R., 1977, A&A,500, 105
Vallini L., Gallerani S., Ferrara A., Baek S., 2013,MNRAS,433, 1567 Vallini L., Gallerani S., Ferrara A., Pallottini A., Yue B., 2015,ApJ,813, 36 Vallini L., Pallottini A., Ferrara A., Gallerani S., Sobacchi E., Behrens C.,
2018,MNRAS,473, 271
Van Rossum G., de Boer J., 1991, CWI Quarterly, 4, 283 Wang R., et al., 2013,ApJ,773, 44
Willott C. J., Carilli C. L., Wagg J., Wang R., 2015,ApJ,807, 180 Wolfire M. G., Hollenbach D., McKee C. F., Tielens A. G. G. M., Bakes
E. L. O., 1995,ApJ,443, 152
van der Walt S., Colbert S. C., Varoquaux G., 2011,Computing in Science Engineering, 13, 22
APPENDIX A: CMB EFFECT
Suppresion due to the CMB is crucial for a correct analysis of the FIR emission coming from high redshifts (Da Cunha et al. 2013;
Pallottini et al. 2015;Vallini et al. 2015). In Fig.A1we compare the [CII] surface brightness maps with (see eq. 3) and without (η=1.0) the inclusion of CMB suppression. Primarily, the CMB suppresses the extended part of the signal, that is typically produced by diffuse gas (n.5cm−3). Note that some degree of suppression is present also for high density gas (n∼100cm−3), i.e. those dense regions that have kinetic temperature close toTCMB. This fact can
be understood from the trend ofηwith gas density and temperature (see Fig.1). As a consequence of CMB quenching, in this specific case the total luminosity is reduced by about a factor of'2, i.e. from 108.52Lto 108.19L.
This paper has been typeset from a TEX/LATEX file prepared by the author.
![Figure 1. CMB suppression of [C II ] emission (η) as a function of gas number density (n)](https://thumb-us.123doks.com/thumbv2/123dok_us/8254824.2187090/3.892.79.427.157.421/figure-cmb-suppression-ii-emission-function-number-density.webp)
![Figure 3. Top panel: Surface brightness of [C II ] emission of Althæa (view- (view-ing face-on) at redshift z = 6](https://thumb-us.123doks.com/thumbv2/123dok_us/8254824.2187090/5.892.471.800.108.665/figure-panel-surface-brightness-emission-althæa-view-redshift.webp)
![Figure 5. [C II ] surface brightness of Althæa during its evolution in redshift range of 6.09 < z < 7](https://thumb-us.123doks.com/thumbv2/123dok_us/8254824.2187090/7.892.104.769.155.618/figure-ii-surface-brightness-althæa-evolution-redshift-range.webp)
![Figure 6. Left panel: [C II ] spectra for the face-on inclinations taken from FOV = 7 kpc (red solid lines) and FOV = 2 kpc (blue solid lines)](https://thumb-us.123doks.com/thumbv2/123dok_us/8254824.2187090/8.892.101.787.163.614/figure-left-panel-spectra-inclinations-taken-solid-lines.webp)
![Table 1. Sample of high-z galaxies probed by [C II ] line.](https://thumb-us.123doks.com/thumbv2/123dok_us/8254824.2187090/9.892.124.751.198.618/table-sample-high-galaxies-probed-c-ii-line.webp)