arXiv:1607.06816v2 [astro-ph.GA] 26 Aug 2016
Chemical enrichment of the pre-solar cloud by supernova dust
grains
Matthew D. Goodson,
1⋆Ian Luebbers,
2Fabian Heitsch
1and Christopher C. Frazer
11Department of Physics&Astronomy, University of North Carolina at Chapel Hill, Chapel Hill, NC 27599-3255, USA 2Department of Physics&Astronomy, Macalester College, St. Paul, MN 55105, USA
Accepted 2016 July 20. Received 2016 July 18; in original form 2016 June 20
ABSTRACT
The presence of short-lived radioisotopes (SLRs) in Solar system meteorites has been inter-preted as evidence that the Solar system was exposed to a supernova shortly before or during its formation. Yet results from hydrodynamical models of SLR injection into the proto-solar cloud or disc suggest that gas-phase mixing may not be efficient enough to reproduce the observed abundances. As an alternative, we explore the injection of SLRs via dust grains as a way to overcome the mixing barrier. We numerically model the interaction of a supernova remnant containing SLR-rich dust grains with a nearby molecular cloud. The dust grains are subject to drag forces and both thermal and non-thermal sputtering. We confirm that the ex-panding gas shell stalls upon impact with the dense cloud and that gas-phase SLR injection occurs slowly due to hydrodynamical instabilities at the cloud surface. In contrast, dust grains of sufficient size (&1µm) decouple from the gas and penetrate into the cloud within 0.1 Myr. Once inside the cloud, the dust grains are destroyed by sputtering, releasing SLRs and rapidly enriching the dense (potentially star-forming) regions. Our results suggest that SLR transport on dust grains is a viable mechanism to explain SLR enrichment.
Key words: hydrodynamics – shock waves – stars:formation – supernovae:general – dust, extinction – ISM: supernova remnants
1 INTRODUCTION
1.1 Short-lived radioisotopes
Calcium–aluminium-rich inclusions (CAIs) in chondritic mete-orites are the oldest known Solar system solids, with ages over 4.567 Gyr (Amelin et al. 2002, 2010). Spectroscopic analyses of CAIs reveal isotopic excesses due to the in situ decay of short-lived radioisotopes (SLRs) (Lee et al. 1977), so named be-cause of their half-lifetimes of.a few Myr (Russell et al. 2001; McKeegan & Davis 2003). The radioactive decay of these SLRs, particularly26Al, was an important source of heat during the first 10 Myr of Solar system evolution (Urey 1955), fueling the dif-ferentiation of planetesimals (Sahijpal et al. 2007) and the internal melting of ice in rocky bodies (Travis & Schubert 2005). The sus-tained aqueous state due to SLRs in these bodies may have allowed the synthesis of amino acids – the biomolecular precursors for life (Cobb & Pudritz 2014).
The initial abundances of some SLRs in the early Solar sys-tem (ESS) may be enhanced above the Galactic background level (Diehl et al. 2006, however, seeJura et al. 2013). The presence of ‘live’ SLRs in the ESS seems remarkable; SLRs rapidly decay
⋆ E-mail: [email protected]
and must therefore either be produced locally or quickly trans-ported through the interstellar medium (ISM) from a nearby mas-sive nucleosynthetic source (Lee et al. 1977). In the latter case, the presence of a nearby massive star provides constraints on the birth environment of the Solar system, such as cluster size (Adams 2010) and dynamical evolution (Parker et al. 2013;Pfalzner 2013). However, the conditions leading to enrichment are uncertain. The initial SLR abundances in other planet forming systems are un-known, but conditions similar to those in the ESS may be common (Vasileiadis et al. 2013;Jura et al. 2013;Young 2014).
The origin scenarios and initial abundances for SLRs are still a matter of debate, but it seems likely that both solar and extra-solar enrichment sources are required to explain the observed variety. Local mechanisms such as solar radiation-induced spal-lation reactions can produce some SLRs (e.g. 10Be) but not all (e.g. 60Fe) (Heymann & Dziczkaniec 1976; Gounelle & Meibom
2008). Although recent estimates of the initial 60Fe/56Fe ra-tio argue against significant 60Fe enrichment (Tang & Dauphas
2012), the enhanced 26Al/27Al ratio probably requires external sources (Makide et al. 2013). Asymptotic giant branch (AGB) star winds (Wasserburg et al. 1994), Wolf–Rayet (WR) winds (Prantzos & Casse 1986), or Type II (core-collapse) supernova (SN) shock waves (Cameron & Truran 1977) could transport SLRs
c
and contaminate the ESS at some phase of its evolution (e.g. pre-solar molecular cloud, pre-stellar core, or proto-planetary disc).
1.2 Supernova enrichment
Among the various enrichment sources, Type II supernovae (SNe) have received the most attention in the literature (Cameron & Truran 1977; Foster & Boss 1997; Ouellette et al. 2005; Pan et al. 2012). SNe are naturally associated with star-forming regions, and predicted SLR yields from SNe match reason-ably well with ESS abundance estimates (Meyer & Clayton 2000). Additional evidence is provided by the anomalous ratio of oxygen isotopes ([18O]/[17O]) in the Solar system, which is best explained by enrichment from Type II SNe (Young et al. 2011).
Following the discovery of26Al in CAIs,Cameron & Truran (1977) suggested that a nearby SN could have simultaneously in-jected SLRs and triggered the collapse of the ESS. In this sce-nario, a single SN shock wave rapidly transports and deposits SLRs into an isolated marginally-stable pre-stellar core. The impinging shock wave compresses the core and triggers gravitational collapse while at the same time generating Rayleigh–Taylor (RT) instabil-ities at the core surface that lead to mixing of SLRs with the so-lar gas.Foster & Boss(1997) first demonstrated the plausibility of this scenario with hydrodynamical simulations, and subsequent it-erations of the experiment (Boss et al. 2010;Boss & Keiser 2012, 2013,2014,2015) have defined a range of acceptable shock wave parameters (e.g. speed, width, density) for enrichment. This ‘trig-gered collapse’ scenario requires nearly perfect timing and chore-ography. The SN must be close to the pre-stellar core (.0.1–4 pc) at the time of explosion to prevent significant SLR radioactive de-cay during transit; yet the SN shock must slow considerably (from
&2000 km s−1at ejection to.70 km s−1at impact) to prevent
de-struction of the core, requiring either large separation (&10 pc) or very dense intervening gas (&100 cm−3).Gritschneder et al.(2012) demonstrated that injection at higher velocities (up to 270 km s−1) may be possible, but this is yet to be confirmed in three-dimensional models.
The amount of SLRs injected in the ‘triggered formation’ scenario is typically below observed values; both Boss & Keiser (2014) andGritschneder et al.(2012) find SLR injection effi cien-cies. 0.01, compatible with only the lowest estimates for ESS values (Takigawa et al. 2008). Enrichment relies on hydrodynam-ical mixing of the ejecta into the pre-stellar gas, primarily via RT fingers (Boss & Keiser 2012). However, the (linear) growth rates of the involved fluid instabilities depend on the square root of the density contrast (Chandrasekhar 1961), resulting in an inevitable impedance mismatch between the hot, diffuse stellar ejecta and the cold, dense pre-solar core.
One possible solution to this mixing barrier problem is to concentrate the SN ejecta into dense clumps that can breach the cloud surface. The inner ejecta of Type II SNe are found to be clumpy and anisotropic in both observations (Grefenstette et al. 2014;Boggs et al. 2015) and simulations (Wongwathanarat et al. 2015).Pan et al.(2012) explore injection and mixing of clumpy SN ejecta into molecular clouds. The authors find that an over-dense clump can penetrate up to 1 pc into the target cloud, leaving a swath of enriched gas in its wake. Depending on the degree of clumpiness, the resulting enrichment can be comparable to ESS abundances.
Here, we explore an alternative mechanism to overcome the mixing barrier: the injection of SLRs via dust grains. The ejecta from both stellar winds and SNe have been predicted to condense and form dust grains (Clayton 1979;Elmegreen 1981;Kozasa et al.
1989). This prediction is supported by observations that find some SNe produce large amounts of dust (&0.1 M⊙) soon after explosion (Indebetouw et al. 2014;Matsuura et al. 2015). In addition, mete-orites contain pre-solar grains that originated in massive stars, in-cluding SNe (Clayton & Nittler 2004). Numerous authors (Clayton 1975;Ouellette et al. 2005;Gaidos et al. 2009) have suggested that these dust grains will contain SLRs, and in fact some pre-solar grains show evidence for in situ decay of26Al (Groopman et al.
2015). If the dust grains survive transport to the pre-solar cloud, they can dynamically decouple from the stalled shock front and penetrate into the dense gas, possibly delivering SLRs (Elmegreen 1981;Foster & Boss 1997).
Ouellette et al.(2010) have examined the role of dust grains in enrichment, considering injection into an already-formed proto-planetary disc. Although the disc’s small cross-section places strong constraints on the SN distance, the authors found that over 70 per cent of dust grains with radii greater than 0.4µm can survive the passage into the inner disc where they are either stopped or de-stroyed. Both fates contribute SLRs to the forming star, suggesting dust grains may favorably enhance enrichment. However, injection at the disc phase may be too late; CAIs containing SLRs probably formed within the first 300,000 years of Solar system formation (Young et al. 2005), prior to the proto-planetary disc phase.
Injecting dust grains at the pre-stellar core phase may be more difficult. For grains impacting a dense pre-stellar core of number density n & 105 cm−3, only grains with radii a
≥ 30 µm are able to penetrate the stalled shock front and deposit SLRs into the core (Boss & Keiser 2010). 30µm is greater than either simu-lated (Sarangi & Cherchneff2015) or meteoritic (Clayton & Nittler 2004) SN grain radii (typically a.1µm). Therefore, if injection via dust grains is to be a viable scenario, it must occur at an even earlier phase.
Enriching the pre-solar molecular cloud prior to core forma-tion has been suggested by several authors (Gaidos et al. 2009; Gounelle et al. 2009; Young 2014) but remains largely untested with simulations. In this scenario, one to several massive stars, pos-sibly across multiple generations, contribute SLRs to a large star-forming region. The Solar system then forms from the enriched gas, eliminating the need for injection into a dense core. To our knowl-edge, the only numerical simulations of this scenario are presented byVasileiadis et al. (2013), with a follow-up by Kuffmeier et al. (2016). The authors follow the enrichment of a massive (&105M
⊙)
star-forming region over 20 Myr. A turbulent periodic box is al-lowed to evolve subject to star formation and SN feedback. The combined effect of numerous explosions leads to an overall enrich-ment of26Al and60Fe in star-forming gas. The authors used passive particles to track SLRs, and they relied on numerical diffusion to mimic the mixing between SN ejecta and cold gas. While the re-sulting enrichment is broadly consistent with observed ESS values, a more detailed understanding of the injection mechanisms may be of interest.
1.3 Motivation
non-thermal sputtering, releasing SLRs into the gas phase. We estimate the amount of SLRs injected into the cloud and determine the dust grain radii needed for successful injection to occur.
We conclude from our simulations that sufficiently large (a& 1µm) dust grains can rapidly penetrate the cloud surface and de-posit SLRs within the cloud, long before any gas can hydrodynami-cally mix at the cloud surface. Nearly half of all incident dust grains sputter or stop within the cloud, enriching the dense (eventually star-forming) gas. Our results suggest that dust grains offer a viable mechanism to deposit SLRs in dense star-forming gas and may be the key to reproducing the canonical Solar system SLR abundances. We outline the numerical methods, including initial conditions and dust grain physics, in Section2. We describe measures and an-alytic estimates for the injection efficiency in Section3. We present the results of our simulations in Section4and discuss the implica-tions for enrichment scenarios in Section5. Finally, we summarize our conclusions in Section6.
2 METHODS
We use a modified version of Athena(Stone et al. 2008) version 4.2
to solve the equations of ideal, inviscid hydrodynamics including heating and cooling:
∂ρ
∂t +∇ ·(ρu) = 0 (1)
∂(ρu)
∂t +∇ ·(ρuu+PI) = 0 (2)
∂E
∂t +∇ ·[(E+P)u] = n(Γ−nΛ) (3) with the gas densityρ, the fluid velocity vector u, the gas pressure P, the unit dyadI, the total energy density E
E= P
γ−1+ 1 2ρ|u|
2
, (4)
the number density n≡ρ/(µmH), the mass of hydrogen mH, a mean atomic weightµ=1, a heating rateΓ, and a volumetric cooling rate Λ. We also evolve several passive tracer fields:
∂ρCc
∂t +∇ ·(ρCcu) = 0 (5)
∂ρCs
∂t +∇ ·(ρCsu) = 0 (6)
∂ρd
∂t +∇ ·(ρdu) = 0 (7) using colour field Cc to follow cloud material, colour field Cs to follow gas-phase SN ejecta, and four passive density fieldsρd to track sputtered particle mass (see Section2.4.2).
We use the directionally unsplit van Leer (VL) integrator (Stone & Gardiner 2009) with second order reconstruction in the primitive variables (Colella & Woodward 1984) and the HLLC Riemann solver (Toro 2009). Simulations are performed on Carte-sian grids in three dimensions. We use an adiabatic equation of state with the ratio of specific heats γ = Cp/CV = 5/3. Heating and cooling are included via composite curves (see Section2.2). As the cooling breaks the total energy conservation, we find it necessary to include first-order flux correction (Lemaster & Stone 2009) as well as internal energy fallback (see Section2.3) to maintain posi-tive states. Gravity, magnetic fields, and thermal conduction are not included. A summary of modifications made to Athenais given in
AppendixA.
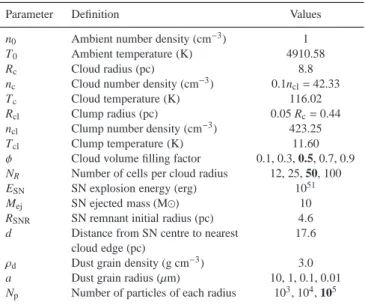
Table 1. Summary of model parameters. Fiducial values are given in bold where necessary.
Parameter Definition Values
n0 Ambient number density (cm−3) 1
T0 Ambient temperature (K) 4910.58
Rc Cloud radius (pc) 8.8
nc Cloud number density (cm−3) 0.1ncl=42.33
Tc Cloud temperature (K) 116.02
Rcl Clump radius (pc) 0.05 Rc=0.44
ncl Clump number density (cm−3) 423.25
Tcl Clump temperature (K) 11.60
φ Cloud volume filling factor 0.1, 0.3, 0.5, 0.7, 0.9
NR Number of cells per cloud radius 12, 25, 50, 100
ESN SN explosion energy (erg) 1051
Mej SN ejected mass (M⊙) 10
RSNR SN remnant initial radius (pc) 4.6
d Distance from SN centre to nearest 17.6 cloud edge (pc)
ρd Dust grain density (g cm−3) 3.0
a Dust grain radius (µm) 10, 1, 0.1, 0.01
Np Number of particles of each radius 103, 104, 105
2.1 Setup and initial conditions
We initialize a spherical gas cloud in a uniform ambient medium. We use a single fluid approximation with a mean atomic weight of
µ=1, treating all the gas as neutral hydrogen. The background is in thermal equilibrium with temperature T0 ≈4900 K and number density n0=1 cm−3, consistent with average values for the diffuse ISM (McKee & Ostriker 1977). The simulation domain extends from -53 to+35 pc in x and from -22 to+22 pc in y and z. Our fidu-cial simulation (run F) has a resolution ofδx=δy=δz ≈0.17 pc, corresponding to roughly 50 cells per cloud radius (NR=50). Table 1summarizes our simulation parameters and values.
2.1.1 Target molecular cloud
The target molecular cloud is stationary and centred at the origin with radius Rc=8.8 pc. To approximate the substructure observed in molecular clouds, we model the cloud as a distribution of small spherical clumps of number density ncl ≈420 cm−3and size Rcl = 0.05 Rc=0.44 pc, embedded in an intercloud medium (ICM) of number density nc =0.1 ncl. The clumps are generated randomly within the cloud radius Rcup to the desired volume filling factor
φ=0.5. The clumps can overlap, but the density is not cumulative. The density profiles of both the cloud and the individual clumps are smoothed at the edges, and both the cloud and clumps are in pressure equilibrium with the background at P/kB≈4900 K cm−3. The clumps have a temperature Tcl≈12 K, which also guarantees thermal equilibrium. The ICM is slightly warmer (Tc≈120 K) and is not in strict thermal equilibrium, but the subsequent cooling is negligible and does not affect the dynamics.
The cloud edge is smoothed using the profile
n(r)=n0+ nc−n0
1+(r/Rc)kn, (8)
2.1.2 Supernova remnant
We initialize the supernova remnant (SNR) at the start of the energy-conserving phase. The shock front has expanded to RSNR= (3Mej/(4πρ0))1/3 after time tSNR ≈ [RSNR(1.90ESN/ρ0)−1/5]5/2, where Mejis the mass ejected from the SN and ESNis the total en-ergy of the SN explosion. We set Mej=10 M⊙and ESN=1051erg, resulting in RSNR≈4.6 pc and tSNR≈1000 yr. We numerically cal-culate profiles for the density, radial velocity, and pressure based on the Sedov–Taylor (ST) blast-wave solutions (Taylor 1950;Sedov 1959) and interpolate these quantities on to the computational grid using a cubic spline. Athenauses a finite-volume method; hence if
we sample only the cell-centred location (as is usually done), the resulting SNR will suffer distortion from grid effects. We find it necessary to sub-sample 83support points within each cell to con-struct the volume-averaged cell-centred conserved variables.
The SNR is centred at a distance d=2 Rc ≈18 pc from the near edge of the cloud along the negative x-axis. This is broadly consistent with the separation distance of central stars in OB as-sociations from bordering molecular gas, such as in Cepheus OB2 (Patel et al. 1998). For our target (cloud) parameters, the ‘radioac-tivity distance’ (equation 2, Looney et al. 2006) for uniform26Al enrichment to the initial solar system abundance is (given uncer-tainties in SN yield) between 10 and 20 pc. As our distance is at the upper end of this range, our enrichment estimates should be con-sidered lower limits, as decreasing the separation would reduce the geometric dilution (see Section3.2).
To follow the SN gas-phase ejecta, we initialize the passive colour field Cs to unity within RSNRand zero elsewhere. For the dust-phase ejecta, we randomly place Np =105particles of each of the four radius groups (see Section2.4.1) within 0.9 RSNR, for a total of 4×10⁵ particles. The particle input radius is truncated to prevent interpolation errors at the discontinuity. Particles are ini-tialized with a radial velocity determined from the ST solution.
2.2 Thermal physics
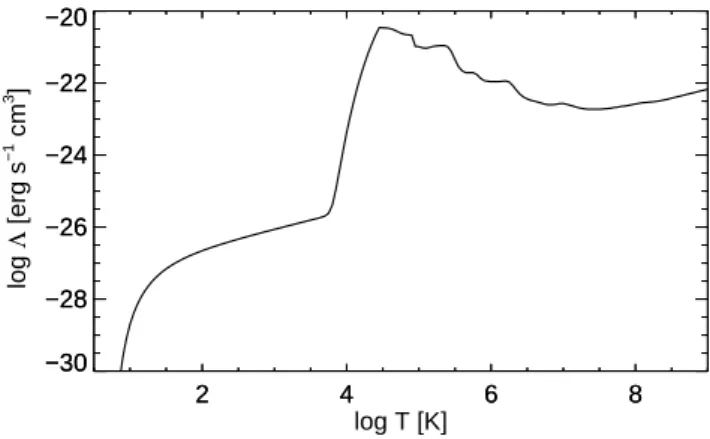
On the time and distance scales considered here, the dynamics of the SNR should not be strongly affected by radiative cooling. Cioffiet al. (1988) andBlondin et al. (1998) have estimated the time and location for SNR transition from the Sedov–Taylor phase to the radiative phase. For our SN parameters (ESN = 1051 erg, n0=1 cm−3), the transition radius is approximately 19 pc, slightly further than the distance from the SN to the cloud surface. How-ever, radiative cooling is expected to strongly affect the dynam-ics of the shock-cloud interaction.Melioli et al.(2005) have shown that cooling reduces the fragmentation and destruction of the cloud, andBoss et al.(2008) find cooling by molecular species is essen-tial to successfully inject SLR material into the pre-solar cloud. It is therefore critical to include radiative heating and cooling effects. The temperatures in our simulation span over eight orders of magnitude, from the hot SN ejecta (T &109K) to the cold molec-ular gas (T . 10 K). To cover this temperature range, we com-bine three standard composite cooling curves into a single cooling function, shown in Fig.1. For temperatures T <104 K, we use a modified version of equation (4) inKoyama & Inutsuka(2001):
ΛKI(T )=2×10⁻²⁶{107exp− 118400 T+1000
+0.014√T exp −22.75
max[1.0,(T−4.0)]}erg s
−1cm3. (9)
This is a fit to the cooling rates ofWolfire et al.(1995). For
tem-2 4 6 8
−30 −28 −26 −24 −22 −20
2 4 6 8
log T [K] −30
−28 −26 −24 −22 −20
log
Λ
[erg s
−1 cm 3 ]
Figure 1. Volumetric cooling rateΛ(T ) (solid line) as a function of temper-ature T from 3 to 109K. This composite cooling curve is constructed by
blending three cooling functions from the literature: for T<104K, a
mod-ified version of equation (4) fromKoyama & Inutsuka(2001); for 104K<
T < 108.5 K, the C.I.E. rates fromSutherland & Dopita(1993); and for
T>108.5K, the free–free rate of equation (5.15b) inRybicki & Lightman
(1985).
peratures 104 K < T < 108.5 K, we use the collisional ioniza-tion equilibrium cooling rates for solar metallicity given in table 6 ofSutherland & Dopita(1993). For temperatures T > 108.5 K, we use the free–free cooling rate given by equation (5.15b) in Rybicki & Lightman(1985):
ΛRL(T )=1.42554×10⁻²⁷g
√
T erg s−1cm3, (10) with a Gaunt factor g = 1.5. The transition between regimes is smoothed with a hyperbolic tangent function. For heating, we use Γ(T ) = 2×1026erg s−1 below 104 K and smoothly transition to Γ(T )=0 above 104K.
Heating and cooling are implemented as source terms for the total energy (and internal energy). The cooling time-scale is typically much shorter than the hydrodynamical time-step; we therefore use an iterative explicit method (adaptive Runge–Kutta– Fehlberg) to integrate the source terms in time. The update is per-formed each time step via operator splitting.
2.3 Dual energy formulation
The cooling function requires the temperature T , which is propor-tional to the internal energy density e=P/(γ−1) via the ideal gas law. Athenaevolves the total energy density E, and the internal
en-ergy is evaluated by subtracting the kinetic enen-ergy Ekin ≡ρ|u|2/2 from the total energy. In regions where the kinetic energy is a sig-nificant fraction of the total energy, the difference will be suscep-tible to numerical errors and the internal energy returned may be non-physical (e<0). Therefore, we simultaneously solve the inter-nal energy equation:
∂e
∂t +∇ ·(eu)=−P∇ ·u+n(Γ−nΛ). (11) If the internal energy is a small fraction of the total energy (e/E≤ 10−3), we revert to using e rather than E
−Ekin. This ‘Dual En-ergy Formulation’ is also used in Enzo (Bryan et al. 2014) and
Flash(Fryxell et al. 2000). Further details of our implementation
2.4 Dust grains
Dust grains are modelled using Lagrangian tracer particles, where each simulated particle represents a collection of dust grains with similar properties and motions. Trajectories of the particles are in-tegrated using the fully implicit method of Bai & Stone (2010), which we have incorporated into the VL integrator in Athena. In
a Cartesian coordinate system, Athenasolves an equation of
mo-tion for each particle given by
dvi
dt =− vi−u
tstop , (12)
with vi the velocity vector of particle i, u the local gas velocity vector, and tstopthe particle stopping time due to gas drag. Neglect-ing grain charges and assumNeglect-ing only pure hydrogen gas, the (colli-sional) drag law is given by (Draine & Salpeter 1979)
dvi dt ≈ −
2πa2nkBT G0(s)
(4/3)πρda3 , (13)
with
G0(s)≈ 8s 3√π(1+
9π
64s 2
)1/2 (14)
and
s≡(mHv 2 rel 2kBT )
1/2, (15)
where a is the dust grain radius, kBis the Boltzmann constant, T is the temperature of the gas, n is the gas number density, ρd is the internal density of the dust (which we treat as constant atρd= 3.0 g cm−3), m
H is the mass of hydrogen, and vrel ≡vi−u is the relative velocity difference between the dust and gas. The stopping distance is evaluated as
tstop=
√
π
2√2 aρd n√mHkBT(1+
9πmH 128kBT
v2 rel)−
1/2. (16)
The gas properties (n, T , u) at each particle’s location are calculated from nearby grid points using a triangular-shaped cloud (TSC) in-terpolation scheme (Hockney & Eastwood 1988). There is no mo-mentum feedback from the particles on the gas.
2.4.1 Dust grain sizes
The drag force and the sputtering rates depend on the dust grain radius a. Since the size distribution of grains formed in SN ejecta is still a matter of debate (Clayton & Nittler 2004; Bianchi & Schneider 2007; Nozawa et al. 2007; Sarangi & Cherchneff 2015; Marassi et al. 2015), we follow the approach of Ouellette et al. (2010) and implement an initial ‘distribution’ of four radii: a=10, 1, 0.1, and 0.01µm. Each radius group is initialized with the same number of particles (Np =105), and the sputtered mass from each radius group is tracked using a separate passive scalar field (ρd, see Section2.4.2).
2.4.2 Sputtering
The dust grains will be eroded by both thermal and non-thermal (kinetic) sputtering. We use sputtering rates estimated from the re-sults ofNozawa et al.(2006), neglecting the slight differences in sputtering rate due to dust composition.
Non-thermal sputtering results from high-speed collisions of a dust grain with gas molecules and depends on the magnitude of the relative velocity|vrel|between the gas and the dust. For simplicity,
−9 −8 −7 −6 −5 −4
−9 −8 −7 −6 −5 −4
log {n
−1
(da/dt)} [
µ
m yr
−1
cm
3 ]
4 5 6 7 8 9 10
1 2 3 4 5
log vrel [ km s
−1
] (non−thermal sputtering) log T [ K ] (thermal sputtering)
thermal non−thermal
Figure 2. Polynomial fits to the thermal (solid red line) and non-thermal (dashed blue line) sputtering rates, estimated from fig. 2 ofNozawa et al. (2006). The non-thermal sputtering varies with the relative velocity|vrel|
between the dust and the gas (bottom axis), and the thermal sputtering varies with the gas temperature T (top axis). Both rates depend on the gas number density n and are given in volumetric units (µm yr−1cm3).
we adopt the polynomial fit ofOuellette et al.(2010, eqs. 13,14)1 to the non-thermal (kinetic) sputtering rates ofNozawa et al.(2006, fig. 2b):
yk=−0.1084x4
k+1.7382x 3
k−10.5818x 2
k+28.1292xk
−32.7024 (17)
with xk=log10(|vrel|/1 km s−1) and (da
dt)k=−10 yk( n
1 cm−3)µm yr −1
, (18)
with the velocity difference between the dust and the gas|vrel|in km s−1, and the gas number density n. Fig.2shows the volumetric non-thermal sputtering rate n−1(da/dt) (solid blue line) as a func-tion of the relative velocity|vrel|(bottom axis).
Thermal sputtering is due to the thermal motion of the gas and depends on the temperature T . Similar to the procedure used by Ouellette et al.(2010) for the non-thermal sputtering rate, we gen-erate an average fit to the thermal sputtering rates ofNozawa et al. (2006, fig. 2a) with the polynomial
yt=−0.001911x4
t +0.12275x 3
t −2.4011x 2
t +18.6752xt
−56.2785 (19)
with xt=log10(T/1 K) and
(da dt)t=−10
yt( n
1 cm−3)µm yr
−1. (20)
Fig.2also shows the volumetric thermal sputtering rate n−1(da/dt) (dashed red line) as a function of the temperature T (top axis).
We treat thermal and kinetic sputtering independently, adding the contributions to determine the erosion. However, the thermal motions of the gas will skew the relative velocity difference be-tween the dust and the gas, particularly at high temperatures. We note that the more detailed treatment ofBocchio et al.(2014) leads to slightly lower sputtering rates in the high temperature regime, suggesting that our sputtering rates are overestimated and hence
1 Note thatOuellette et al.(2010) contain a typographical error in the
our injection efficiencies should be considered lower bounds in this regard.
The erosion rates (equations18 and20) are applied at first order via operator splitting. A particle is assumed to be com-pletely destroyed when its radius decreases to 1 Å. As the par-ticles are eroded, they release SLRs back into the gas phase. To continue tracking the sputtered SLRs in gas phase, we deposit the sputtered dust mass into a passive density fieldρd2. This field is initially set to zero and is advected with the gas. Each initial grain radius group has its own unique passive density field. The mass is distributed into nearby cell-centred field locations using the same TSC interpolation scheme used to determine gas proper-ties (Hockney & Eastwood 1988). Further details are given in Ap-pendixC.
3 ENRICHMENT ESTIMATES AND MEASURES
3.1 Dust production
We are interested in enriching a molecular cloud with SLRs from a nearby SN. The quantity of SLRs produced by a SN varies with progenitor mass (Chieffi& Limongi 2013), and any estimate is dominated by uncertainties in reaction rates (Iliadis et al. 2011) and progenitor models (Woosley & Heger 2007). Of this amount, some fraction will condense into dust grains of various sizes (Sarangi & Cherchneff2015;Marassi et al. 2015). Furthermore, the dust grains that form behind the SNR forward shock will subsequently be processed by the reverse shock (Bianchi & Schneider 2007; Nozawa et al. 2007; Biscaro & Cherchneff2016;Bocchio et al. 2016). Calculations of dust grain processing in the reverse shock predict survival rates of 0–100 per cent, depending on the grain size, grain composition, and local gas density (Nozawa et al. 2007;Bianchi & Schneider 2007; Silvia et al. 2010,2012). Additionally, inhomogeneities in the SNR produce small clumps of higher density that may shield the forming dust grains from destruction (Biscaro & Cherchneff 2014, 2016; Micelotta et al. 2016). For simplicity, we assume a homogeneous SNR and background medium. Because we begin our simulations at the end of the free-expansion phase, we neglect processing by the reverse shock. We therefore assume at least some amount of dust has survived and is still well-coupled to the gas, consistent with 1D simulations (Biscaro & Cherchneff2016;Bocchio et al. 2016). Our calculations are normalized such that the condensation efficiency and survival rate do not affect the evolution.
3.2 Geometric dilution
As the SNR expands, the ejecta become distributed over a larger surface area. For a spherical target of radius R, at a distance d from the SNR centre, the fraction of the total ejecta incident on the target cross-section is
ηgeom=
πR2
4πd2. (21)
For our fiducial set-up, d ≈ 18 pc and R ≈ 9 pc; thenηgeom ≈ 0.06. This factor is used to normalize our injection efficiencyη(see Section3.3).
2 Note that this is a passive density, rather than a colour (concentration),
field. The density is a conserved quantity, whereas the concentration is not.
3.3 Injection efficiency
The mixing of incident material with a target has been the subject of much previous numerical work, both in the context of the stan-dard shock-cloud interaction (Xu & Stone 1995;Shin et al. 2008; Pittard et al. 2009) and in Solar system enrichment (Boss & Keiser 2012;Ouellette et al. 2010). Defining a good measure of the mix-ing is difficult and depends on the context. We therefore quantify the mixing in two ways.
For the shock-cloud interaction, the mixing fraction is typi-cally defined by the dilution of cloud material into ambient ma-terial, using the cloud colour field (Cc). Conversely, we are inter-ested in the mixing of incident ‘shock’ material (SN ejecta) into the cloud. We therefore define the colour-based injection efficiencyηc as the total mass of SN ejecta in cells containing at least 10 per cent cloud material (i.e. Cc≥0.1), normalized by the initial ejecta mass and the incident ejecta fraction (ηgeom). If all of the ejecta incident on the cloud cross-section are ‘injected’ into the cloud,η=1.
In the context of Solar system enrichment, we are most in-terested in enriching the densest (potentially star-forming) regions of the target cloud. BothBoss & Keiser(2012) andOuellette et al. (2010) consider ejecta to be ‘injected’ above an absolute density threshold. We therefore calculate an alternate injection efficiency,
ηd, defined as the total mass of SN ejecta in cells with density greater than the ICM density (i.e. n>nc), also normalized by the incident mass fraction (ηgeom). This measure only probes the dense clumps; thus ifηd
≪ ηc, most of the ejecta are in diffuse cloud material.
For both measures, we useηgfor the gas-phase injection and
ηdfor general dust grain injection (note thatηdandηdare different quantities). We further determine the dust injection for each radius group, usingη10,η1,η0.1, andη0.01for the a=10, 1, 0.1, and 0.01
µm dust grains, respectively. Further details concerning the injec-tion efficiencies are given in AppendixD.
The unknown quantities discussed in Section3.1(e.g. SLR yield, dust production, dust destruction) can then be included when estimating final SLR abundances. Note that we do not account for radioactive decay during transit. The half-life of 26Al is t
1/2 ≈ 0.7 Myr. For our fiducial SNR, the shock impacts the cloud after roughly 0.03 Myr; therefore only∼3 per cent of the total ejected 26Al will have decayed by that time. Over the full duration of our
simulation (0.3 Myr),∼25 per cent of the26Al will have decayed. The short half-life of26Al underscores the need for both rapid trans-port and incorporation into the molecular cloud.
4 RESULTS
4.1 Dynamical evolution
t = 0.000 Myr
−40 −30 −20 −10 0 10
x [pc] −10
−5 0 5 10
y [pc]
t = 0.005 Myr t = 0.015 Myr t = 0.030 Myr
−3 0 3
log n [cm
−3 ]
−8 −7 −6 −5
log M
g
/M
0,g
−8 −7 −6 −5
log M
d
/M
0,d
−8 −7 −6 −5
log M
d
/M
0,d
−8 −7 −6 −5
log M
d
/M
0,d
−8 −7 −6 −5
log M
d
/M
0,d
density
gas ejecta
10µm ejecta
1µm ejecta
0.1µm ejecta
0.01µm ejecta
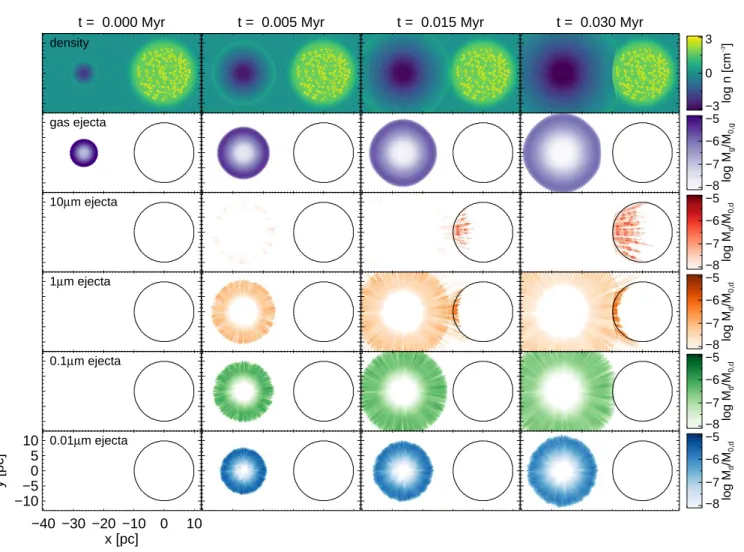
Figure 3. Time evolution of our fiducial simulation (run F) at early stages (the first 0.03 Myr). Each image is a mid-plane slice at z=0. The top row shows the total number density n in cm−3. All other rows show the mass fraction of each tracer on a per cell basis relative to the initial tracer mass. The second row
is the gas-phase ejecta, traced by the colour field Cs. The remaining rows are the sputtered mass of dust grains from each radius group. The black contour
traces the cloud boundary, defined where the cloud colour field Cc≥0.1. The particles located within the central midplane slice (−δz/2<z<+δz/2) are overlaid in grey according to their initial radius group. The smallest grains (a=0.01µm) remain well-coupled to the inner ejecta by the drag force and sputter almost completely before impacting the cloud. The 0.1µm grains outpace the inner ejecta but stall in the forward shock. The large (a&1.0µm) dust grains decouple and outpace the shock front due to their larger inertia, reaching the cloud and depositing SLRs before the shock impacts the surface. The sputtering of individual particles is visible in the form of radial contrails from the SN centre.
thermal sputtering dominates and erodes nearly 80 per cent of the smallest (a=0.01µm) grains.
As the remnant expands into the ambient medium, the forward shock accumulates more material, eventually slowing and cooling into a dense shell. The smallest grains (a=0.01µm) remain well-coupled to the inner gas ejecta. Slightly larger (a=0.1µm) grains outpace the inner ejecta but stall in the dense forward shock. The relative velocity difference then generates non-thermal sputtering, which contributes almost equally to the destruction of the 0.1µm grains (compare the dashed and dash–dotted green lines in Fig.4). Both of the smaller grain groups are almost completely stopped and destroyed by sputtering within the remnant. In contrast, the larger grains (a≥1.0µm) remain largely intact and dynamically decouple from the ejecta due to their higher inertia. The large grains also pass through the forward shock and ballistically impact the cloud before the shock arrives. Once in the cloud, the grains rapidly slow and kinetically sputter due to the increased densities and high relative velocities.
The behaviour of the dust grains in the SN remnant agrees well
with the results ofBocchio et al.(2016). The authors performed 1D simulations of the growth and erosion of dust in SNRs including multiple grain compositions, plasma drag, and detailed sputtering. Despite using simplified dust physics, we obtain very similar results to the evolution of Mg2SiO4 presented in fig. 3 ofBocchio et al. (2016): (1) small grains (a = 0.01 µm) are highly eroded in the remnant and remain within the ejecta region; (2) slightly larger (a=0.1µm) grains pass through the ejecta but remain within the forward shock; and (3) the larger (a=1.0µm) grains are eroded very little and eventually move beyond the forward shock.
stand-0.00 0.02 0.04 0.06 0.08 0.10 0.0
0.2 0.4 0.6 0.8 1.0
0.00 0.02 0.04 0.06 0.08 0.10
t [Myr] 0.0
0.2 0.4 0.6 0.8 1.0
sputtered mass fraction
10 µm
1.0 µm
0.1 µm
0.01 µm
10 µm
1.0 µm
0.1 µm
0.01 µm
thermal non−thermal combined thermal non−thermal combined
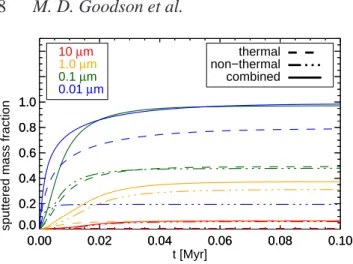
Figure 4. Fraction of total particle mass eroded by thermal sputtering (dashed), non-thermal sputtering (dash-dot), and the combination of both (solid) during the first 0.1 Myr of the fiducial simulation (run F). colours indicate the initial radius group (red: 10µm; orange: 1µm; green: 0.1µm; blue: 0.01µm). The 0.01µm grains are rapidly and significantly eroded, predominately by thermal sputtering in the hot SNR. Over 20 per cent of the total mass is lost in the first kyr, and nearly 100 per cent in the first 10 kyr. The 0.1µm grains also experience rapid destruction but with almost equal contributions from both thermal and non-thermal sputtering, and nearly all are destroyed. The larger grains fare better, with roughly 40 and 10 per cent destruction rates for the 1 and 10µm groups respectively. In both instances, the destruction is dominated by non-thermal sputtering as the grains pass through the shock front and into the cold, dense cloud.
offshock, which is usually observed in the adiabatic shock–cloud interaction (Nakamura et al. 2006) and could drastically limit the SLR injection (see Section4.6). At late times, the Rayleigh–Taylor instability begins to manifest at the cloud surface, driving fingers into the cloud that will eventually mix and inject SLRs in the gas phase.
In contrast to the hydrodynamical (gas-phase) mixing, the large dust grains rapidly inject SLRs throughout the cloud. Fig.6 shows the evolution of the dust grains, as well as a combined view of the sputtered mass from each initial radius group. The largest (a = 10 µm) grains penetrate furthest, sputtering most of their mass in the leading edge of the cloud. The smaller grains have been largely stopped and sputtered before entering the cloud. Still, the SLR contents of the 0.1µm grains have outpaced the inner ejecta and mix into the dense gas∼0.05 Myr earlier. Nearly all grains in-cident on the cloud are sputtered and stopped within the cloud, i.e. only grains at grazing angles can re-emerge from the cloud interior.
4.2 Injection of SLRs
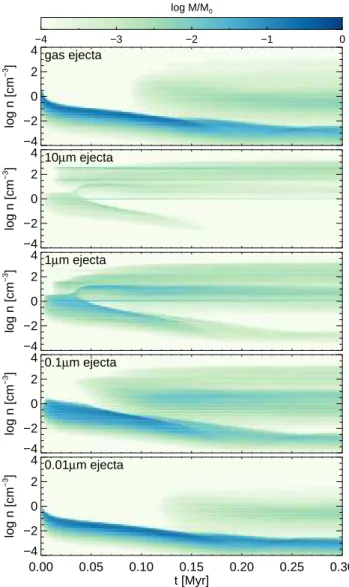
We are interested in the enrichment of the densest (eventually star-forming) gas. Therefore, we analyse the SLR deposition as a func-tion of density (Fig.7). Comparing the dust ejecta to the gas ejecta, the gas ejecta are mostly distributed in the diffuse SNR and back-ground ISM. In contrast, the 10µm grains deposit a significant fraction of mass into the densest gas, and smaller particles deposit smaller fractions in the dense gas. This effect is further quantified in Fig.8, which compares the injection efficiencyηof both dust and gas as a function of time. At late times, the colour-based injection efficiency is roughly equivalent for all grain sizes (ηc
∼0.5), indi-cating that nearly half the incident material has been mixed into the cloud. However, the density-based injectionηddecreases with creasing grain size, to the point that the smallest grains and gas
de-posit only negligible amounts of ejecta in the densest regions. This agrees qualitatively withBoss & Keiser(2012), who found only a small fraction of incident gas-phase material is injected into a dense pre-stellar core (ηd
g≈0.03). This indicates that only the large grains are able to enrich the densest gas (n>nc). Table2provides a sum-mary of final injection efficiencies from all simulations performed. Because the SLRs decay, the enrichment needs to occur rapidly. As seen in both Figs7and8, the particles are able to de-posit SLRs in the cloud∼0.1 Myr before gas phase mixing occurs. For all dust grain sizes, the injection of SLRs occurs rapidly, reach-ing peak values in less than 0.1 Myr. This is contrasted with the gas, which slowly mixes and is still increasing its injection amount when the simulation ends. The gas injection efficiency only be-comes comparable to the dust injection efficiencies after 0.2 Myr.
4.3 Resolution convergence
In inviscid hydrodynamics, the degree of mixing is controlled by numerical viscosity. As the numerical diffusion decreases with in-creasing resolution, adequate resolution is necessary to properly capture the dynamics. In the two-dimensional shock-cloud inter-action, previous work has found that about 100 cells per cloud ra-dius (NR & 100) are necessary for convergence of global quan-tities (Klein et al. 1994;Nakamura et al. 2006). This requirement may be reduced in three-dimensional simulations to NR &32−64 (Pittard & Parkin 2016), and our fiducial simulation falls within this range (NR ≈ 50). However, because the instabilities tend to grow fastest on the smallest scales, the details of the small-scale mixing could be dominated by resolution effects.Shin et al.(2008) found that all quantities except the cloud mixing fraction show con-vergence, and our definition of the injection efficiency is similar to their mixing fraction.
Fig.9compares the fiducial result to simulations performed at both lower and higher resolution (runs R1–R4), up to 100 cells per radius (1024×512×512 grid points). The injection efficiency of the larger grains (a ≥0.1µm) increases only slightly with in-creasing resolution. In contrast, the injection of smallest grains (a = 0.01µm) and the gas ejecta decreases as the resolution in-creases. The larger injection efficiencies at lower resolution may be attributable to increased numerical diffusion, leading to increased mixing at the cloud interface. Overall, the trend is sufficiently flat to conclude our three-dimensional simulations are well-resolved at NR=50, in agreement withPittard & Parkin(2016).
In the previous resolution test, we kept the number of parti-cles fixed at Np=105. We do not expect the particles to be strongly affected by simulation resolution. However, the number of parti-cles used may alter the injection. As the partiparti-cles are placed ran-domly within the SNR, a sufficient number of particles are required to eliminate any gaps when the shock wave encounters the cloud surface. We repeat our fiducial simulation varying the number of particles from Np =104 (run N1) to Np =106(run N2). We find no significant variation in injection efficiency with particle number (see Table2).
4.4 Effect of supernova remnant model
t = 0.050 Myr
−40 −30 −20 −10 0 10
x [pc] −10
−5 0 5 10
y [pc]
t = 0.100 Myr t = 0.200 Myr t = 0.300 Myr
−3 0 3
log n [cm
−3 ]
−8 −7 −6 −5
log M
g
/M
0,g
−8 −7 −6 −5
log M
d
/M
0,d
−8 −7 −6 −5
log M
d
/M
0,d
−8 −7 −6 −5
log M
d
/M
0,d
−8 −7 −6 −5
log M
d
/M
0,d
density
gas ejecta
10µm ejecta
1µm ejecta
0.1µm ejecta
0.01µm ejecta
Figure 5. Same as Fig.3, but at later stages. The forward shock impacts the cloud within∼0.03 Myr, but the inner ejecta does not arrive until t∼0.06 Myr. The clumpy substructure of the cloud creates channels for the impinging gas to penetrate and mix. At later times, Rayleigh–Taylor instabilities lead to injection of gaseous SLRs through the cloud surface. After 0.3 Myr, nearly all the grains within the cloud have either been stopped or sputtered. Nearly half of the dust grains incident on the cloud are captured, and the largest grains penetrate furthest.
−4 −2 0 2 4
log n [cm
−3
]
−4 −2 0 2 4
log n [cm
−3 ]
−4 −2 0 2 4
log n [cm
−3
]
−4 −2 0 2 4
log n [cm
−3 ]
0.00 0.05 0.10 0.15 0.20 0.25 0.30
t [Myr] −4
−2 0 2 4
log n [cm
−3
]
−4 −3 −2 −1 0
log M/M0
gas ejecta
10µm ejecta
1µm ejecta
0.1µm ejecta
0.01µm ejecta
Figure 7. Tracer mass fraction binned logarithmically by density across time for the fiducial simulation (run F). The top panel shows the SNR gas tracer (ρCs). The rest of the panels show the mass deposited into gas
phase by dust grain sputtering (ρd) for each initial grain size (10, 1, 0.1, and
0.01µm). While hydrodynamical mixing is largely restricted to later times and low cloud densities (top panel), the large (a≥1µm) dust grains enrich higher densities at earlier times. Only the smallest grains do not reach higher densities. The prominent horizontal line at n=1 cm−3corresponds to the ambient medium, while lower densities are located in the diffuse SNR.
shown to evolve approximately into the ST solution after only 2 kyr (Kim & Ostriker 2015) and is therefore often used for its simplicity (Vasileiadis et al. 2013). Because the SNR has no initial kinetic en-ergy, injecting the particles at the start of the simulation would gen-erate non-physical drag. We therefore let the thermal pulse evolve for 3 kyr before injecting the particles, which are then placed in the forward shock with the local gas velocity.
The final state of the simulation is displayed in the second col-umn of Fig.10. Overall, the result obtained using the thermal pulse is almost indistinguishable from the ST model – the shock thick-ness, velocity, and arrival time are approximately the same, and the injection efficiencies at simulation termination are nearly identical (see Table2). There is a small difference in the dust grains due to the initialization; because we wait 3 kyr to insert the dust in the
0.00 0.05 0.10 0.15 0.20 0.25 0.30
0.0 0.2 0.4 0.6 0.8 1.0
0.00 0.05 0.10 0.15 0.20 0.25 0.30
t [Myr] 0.0
0.2 0.4 0.6 0.8 1.0
η
gas ejecta
10 µm
1.0 µm
0.1 µm
0.01 µm
ηc
(Cc > 0.1)
ηd
(n > nc)
Figure 8. Injection efficiencyηas a function of time for the ejecta in our fiducial simulation (run F). Injection is measured using the cloud tracer (solid) and density threshold (dashed). Each tracer is colour-coded as in Fig. 3(purple: gas; red: 10µm; orange: 1µm; green: 0.1µm; blue: 0.01µm). The largest grains (a≥1µm) arrive within the first 0.01 Myr and rapidly deposit a substantial fraction (&20 per cent) of their SLR mass within 0.1 Myr. The intermediate grains (a =0.1µm) are sputtered and stopped in the forward shock and arrive slightly ahead of the gas. The smallest grains (a=0.01µm) sputter significantly before entering the cloud, yet injection of SLRs from these grains continues as gas at the leading edge of the cloud is subsequently mixed by Rayleigh-Taylor instabilities. While the colour-based injection is approximately the same (ηc&0.4) for all ejecta types, the density-based injection (ηd) decreases with grain radius, indicating most of
the smaller grain deposition is in diffuse intercloud gas.
20 40 60 80 100
0.0 0.2 0.4 0.6 0.8 1.0
20 40 60 80 100
NR (cells per cloud radius)
0.0 0.2 0.4 0.6 0.8 1.0
η
(t=0.3 Myr)
gas ejecta
10 µm
1.0 µm 0.1 µm
0.01 µm
ηc
(Cc > 0.1)
ηd
(n > nc)
Figure 9. Injection efficienciesηas a function of simulation resolution, rep-resented by the cells per cloud radius NR.ηis evaluated at simulation ter-mination (t=0.3 Myr) using the cloud tracer (solid) and density threshold (dashed). Each tracer is colour-coded as in Fig.3(purple: gas; red: 10µm; orange: 1µm; green: 0.1µm; blue: 0.01µm). The injection efficiency of the largest grains increases slightly for both measures, as the density peaks within the clumps are better resolved and capture more material. Injection decreases for the smallest grains and the gas due to decreased numerical diffusion at the cloud surface.
thermal pulse model, the grains experience less thermal sputtering and arrive later.
4.5 Effect of sputtering
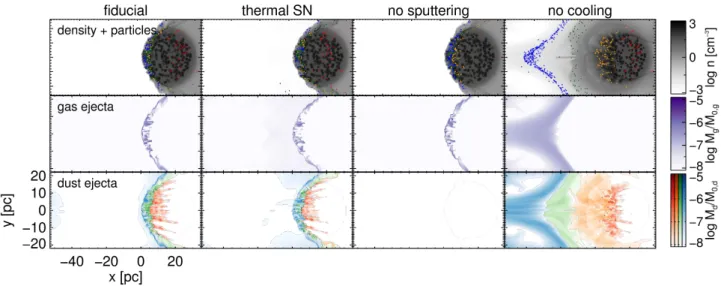
feed-Figure 10. Similar to Fig.6, but comparing different simulations at t=0.3 Myr. From left to right, the columns show (a) the fiducial simulation (run F); (b) the SNR initialized as a thermal pulse rather than a ST solution (run FT); (c) no sputtering of dust grains (run NS); and (d) no thermal physics, i.e. purely adiabatic with no heating or cooling (run NC). The middle row shows the gas ejecta tracer field. Comparing the fiducial to the thermal pulse, the initialization of the SNR does not appear to drastically alter the evolution or injection. Without sputtering, there are no SLRs released in gas phase; hence the bottom panel is blank. The 10µm dust grains are not stopped in the cloud by drag and re-emerge. Without cooling, the impact of the SNR creates a bow shock that deflects incoming gaseous ejecta. The large, intact grains still decouple and penetrate the cloud surface, injecting SLRs.
back from the particles to the gas. The drag force depends on the dust grain radius, and therefore the dust dynamics are altered by the lack of sputtering. The largest grains pass almost entirely through the target cloud. The rest of the grains also travel further into the cloud but are eventually stopped by the drag force. Since there is no sputtering, no SLRs are released into the gas phase and the injection is measured solely by the stopped grain criterion (see AppendixD).
4.6 Effect of radiative cooling
We compare the fiducial results to a simulation run without radia-tive heating and cooling (run NC). As seen in the fourth column of Fig.10, the behaviour of the gas is radically altered. As the shock wave impacts the cloud surface, the purely adiabatic equation of state results in the formation of a stand-offshock at the leading edge of the cloud, diverting impinging material and preventing mixing. The gas-phase ejecta and the smaller grains (which are either cou-pled to the gas or sputtered) do not mix at all with cloud material, and the injection efficiency is essentially zero (see Table2). Cooling lowers the effective adiabatic index of the shock-cloud interaction. As the gas is compressed, the strong radiative losses reduce the shock stand-offdistance, allowing mixing of phases and enhancing injection. The larger dust grains are less affected as they are largely intact at impact and still penetrate the cloud surface.
4.7 Filling factors
In contrast to previous shock–cloud and SN injection simulations, we include substructure in the target cloud through high-density clumps randomly embedded in an ICM. The fiducial simulation has a cloud volume filling factor ofφ=0.5. We expect the SN shock wave to interact differently as the filling factor is varied. Clumps at the cloud surface provide channels for injection, reducing the need for Rayleigh–Taylor fingers. We examine the effect of varying the filling factor fromφ =0.1 to 0.9 (runs F1–F9); results are given
in Table2. Overall, the dust grain injection is largely unaffected by the filling factor. A higherφleads to slightly increased injection ef-ficiency, most notably in the 10µm grains, as the additional clumps capture grains on trajectories near the periphery of the cloud.
5 DISCUSSION
5.1 The Role of dust grains
We investigate the role of SN dust grains in enriching a nearby molecular cloud with SLRs. Our results indicate that dust grains formed in SN ejecta can survive transport through the ISM and significantly enrich neighbouring clouds. We find that sufficiently large grains (a ≥ 1µm) decouple from the expanding SN rem-nant, pass through the shock front and cloud surface, and deposit a significant fraction of their SLR mass into the cloud (ηd &0.4). In particular, large dust grains enrich the dense gas rapidly, preventing significant SLR decay. Smaller grains (a≤0.1µm) sputter and stall in the SNR and contribute SLRs predominately through gas-phase mixing. The gas-phase ejecta mix slowly through hydrodynamic and thermal instabilities at the cloud surface.
Our results agree with those ofOuellette et al.(2010) despite using very different targets (molecular cloud versus proto-stellar disc) and SN distances (18 pc versus 0.1–2 pc). The authors found that a considerable fraction (η &0.8) of grains larger than 1µm are injected into the target, which compares favorably with our es-timates (ηd&0.4). Similarly, the smallest grains (a=0.01µm) are slowed and completely destroyed. We also find approximate agree-ment with our estimate for gaseous injection;Ouellette et al.(2010) estimatedηg.0.01, while we findηdg≈0.1.
5.2 60Fe/26Al ratio
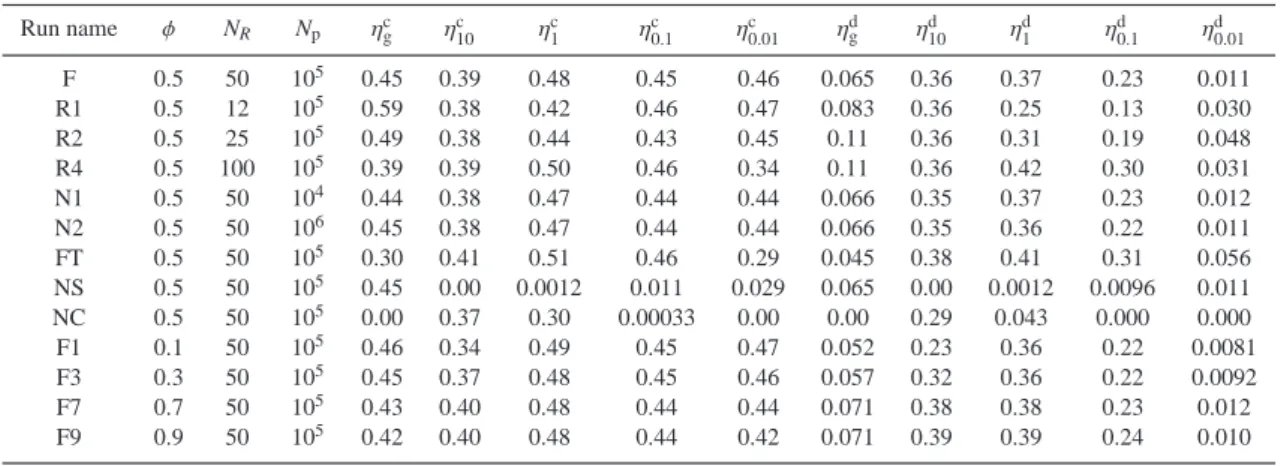
illus-Table 2. Summary of simulations and results.
Run name φ NR Np ηcg ηc10 η
c
1 η
c 0.1 η
c 0.01 η
d
g ηd10 η d
1 η
d 0.1 η
d 0.01
F 0.5 50 105 0.45 0.39 0.48 0.45 0.46 0.065 0.36 0.37 0.23 0.011
R1 0.5 12 105 0.59 0.38 0.42 0.46 0.47 0.083 0.36 0.25 0.13 0.030
R2 0.5 25 105 0.49 0.38 0.44 0.43 0.45 0.11 0.36 0.31 0.19 0.048
R4 0.5 100 105 0.39 0.39 0.50 0.46 0.34 0.11 0.36 0.42 0.30 0.031
N1 0.5 50 104 0.44 0.38 0.47 0.44 0.44 0.066 0.35 0.37 0.23 0.012
N2 0.5 50 106 0.45 0.38 0.47 0.44 0.44 0.066 0.35 0.36 0.22 0.011
FT 0.5 50 105 0.30 0.41 0.51 0.46 0.29 0.045 0.38 0.41 0.31 0.056
NS 0.5 50 105 0.45 0.00 0.0012 0.011 0.029 0.065 0.00 0.0012 0.0096 0.011
NC 0.5 50 105 0.00 0.37 0.30 0.00033 0.00 0.00 0.29 0.043 0.000 0.000
F1 0.1 50 105 0.46 0.34 0.49 0.45 0.47 0.052 0.23 0.36 0.22 0.0081
F3 0.3 50 105 0.45 0.37 0.48 0.45 0.46 0.057 0.32 0.36 0.22 0.0092
F7 0.7 50 105 0.43 0.40 0.48 0.44 0.44 0.071 0.38 0.38 0.23 0.012
F9 0.9 50 105 0.42 0.40 0.48 0.44 0.42 0.071 0.39 0.39 0.24 0.010
trated in Fig.6. One of the leading arguments against a SN en-richment source is that the SLR abundances in our Solar sys-tem do not precisely match predicted SN yields. In particular, some estimates of the ratio of 60Fe/26Al in the ESS are or-ders of magnitude lower than expected in SNe (Tang & Dauphas 2012), casting doubt on a SN origin for 26Al (Gounelle 2015). However, if the primary carriers of 60Fe and 26Al condense into grains of different characteristic radii, these isotopes may not end up in the same dense gas reservoirs. In addition, the ejecta of SNRs are not spatially homogeneous (Grefenstette et al. 2014). Both observational (DeLaney et al. 2010) and simulation (Wongwathanarat et al. 2015) results indicate that iron-group ele-ments may be preferentially ejected in a particular direction. If the pre-solar cloud was not in this narrow window, it would receive far less60Fe than predicted, and a SN may still be the injection source.
5.3 Other considerations
We do not consider the evolution of the SN progenitor prior to explosion. The progenitor’s stellar wind and ionizing radiation will shape the circumstellar environment, resulting in a strati-fied medium (ρ ∝ r2) rather than a uniform medium. This den-sity gradient will affect the transit of the shock wave and grains through the intervening gas. Furthermore, the stellar wind will contain dust grains that may also be enriched with certain SLRs, such as26Al, produced during main sequence and post-main se-quence evolution (Limongi & Chieffi 2006;Palacios et al. 2005). These enriched dust grains will be swept up by the passage of the subsequent SNR and may further enhance SLR enrichment (Gounelle & Meynet 2012).
We consider only one set of parameters for the SN (explosion energy ESN=1051erg and ejected mass Mej =10 M⊙) at a single distance (d=18 pc). The SN parameters are somewhat constrained and only slightly affect the initial condition. The SN distance is limited by the estimated SLR yield of SNe, the geometric dilution of ejecta, and the radioactive decay of SLRs. As noted in Section 2.1.2, our chosen separation is at the upper limit of the ‘radioac-tivity distance’ for26Al enrichment (Looney et al. 2006). Reducing the distance from the SN to the pre-solar cloud may increase in-jection due to decreased geometric dilution, increased shock speed at impact, decreased time for radioactive decay of SLRs, and de-creased sputtering. Therefore our estimates may be considered a lower limit in this regard.
We also only consider a single SN. However, most
mas-sive stars form in clustered environments, e.g. OB associations (Lada & Lada 2003), and in multiple systems (Zinnecker & Yorke 2007). Indeed, it is likely that multiple SNe over one or more gen-erations contributed SLRs to the pre-solar cloud (Vasileiadis et al. 2013;Young 2014).
Cloud morphology may also play a considerable role in gas injection. We introduce static, clumpy substructure in the target cloud. The substructure prevents a symmetric stand-offshock from forming after impact and provides diffuse channels for injection through the dense filaments. The break-up of the shock also gen-erates turbulence and mixing. We have neglected dynamical per-turbations (velocity substructure); however, molecular clouds are probably turbulent (Elmegreen & Scalo 2004), and introducing tur-bulence could further enhance the mixing at the cloud surface and increase injection of the smaller grains and gas.
We do not include gravity in our simulations. The potential effect of gravity can be estimated by comparing the local free-fall time tff = [3π/(32Gρ)]1/2 to the simulation time. For the dense
clumps with ncl ≈ 400 cm−3, tff ≈ 2 Myr – much longer than
the time-scales considered here (0.3 Myr). However, we note that compression by the SN shock wave, as well as fragmentation due to thermal instability, will create higher densities and may trigger collapse. Due to the global nature of our simulation, we are limited to measuring injection efficiencies at large scales within the cloud. Following the enrichment and mixing down to individual pre-stellar cores (sub-parsec scale) will require gravity and additional resolu-tion (possibly through mesh refinement). While the densest gas is harder to penetrate, collapsing cores could receive SLRs by accret-ing enriched diffuse gas during collapse (Kuffmeier et al. 2016).
ra-dially aligned (Dunne et al. 2009;Reynoso et al. 2013;Inoue et al. 2013). However, the field orientation may shift at the SN shock front; as noted by Foster & Boss(1997), gas–grain de-coupling may be suppressed or even prevented by fields in the shock front, which could drastically reduce the enrichment. Magnetic effects could also alter the grain dynamics within the target cloud. The av-erage magnetic field increases with column density in dense molec-ular gas (Crutcher 2012); hence the effect on grains also increases near star-forming clumps. Future work on the subject should con-sider the combined effects of grain charging, Coulomb drag, and magnetic fields.
6 CONCLUSIONS
A nearby SN remains a possible candidate as the source of SLRs in the early Solar system. The main challenge in this ‘direct injection’ scenario is overcoming the impedance mismatch between the hot, diffuse SNR gas and the cold, dense pre-solar gas, as demonstrated amply in the literature (Boss & Keiser 2012; Gritschneder et al. 2012; Pan et al. 2012). We explore whether dust grains formed from the SN ejecta and carrying SLRs can overcome the mixing barrier and enrich dense (potentially star-forming) gas. Using hy-drodynamical simulations, we model the interaction of a SNR car-rying dust grains with the pre-solar molecular cloud. We follow dust grains of varying initial radius (a = 0.01–10µm) subject to drag forces and sputtering. We find the following points:
(i) Sufficiently large dust grains (a≥1µm) entrained in the SN ejecta will decouple from the shock front and survive entry into the molecular cloud. They will then be either completely stopped or sputtered, enriching the dense gas with SLRs within 0.1 Myr of the SN explosion.
(ii) Smaller dust grains (a ≤0.1µm) formed in the SN ejecta will be either stopped or sputtered before impacting the molec-ular cloud. The sputtered SLRs will contribute to the enrichment through subsequent gas-phase mixing.
(iii) Gas-phase SN ejecta will enrich the leading edge of molec-ular cloud only after instabilities develop at the cloud surface. The degree of mixing depends strongly on the inclusion of radiative cooling.
While it is still unknown what fraction of dust grains survive pas-sage by the reverse shock and emerge from the SNR, we show that any surviving dust will contribute favorably to the typical SN enrichment scenario. Indeed, if a significant amount of large
(a & 1µm) grains survive, dust may be the dominant source of
SLR enrichment in nearby molecular clouds. Most notably, the dust grain enrichment occurs rapidly, in contrast with the typical gas-phase mixing which relies on the growth of hydrodynamical instabilities at the cloud surface. A shorter time delay between pro-duction and injection of the SLRs prevents substantial radioactive decay. Finally, if the various SLRs condense into different-sized dust grains, drag and sputtering will lead to a spatial stratification of SLRs within the pre-solar cloud. This could explain the large discrepancy in the60Fe/26Al mass ratio between SN predictions and meteoritic measurements. We conclude that dust grains can be a vi-able mechanism for the transport of SLRs into the pre-solar cloud.
ACKNOWLEDGEMENTS
We thank the referee, Marco Bocchio, for an insightful and help-ful report. MDG thanks Jim Stone, Eve Ostriker, Bruce Draine,
and Jonathan Tan for helpful discussions. Computations were per-formed on the Kure Cluster at UNC-Chapel Hill. MDG and FH gratefully acknowledge support by NC Space Grant and NSF Grant AST-1109085. IL acknowledges support from NSF Award ACI-1156614, which supported the UNC Chapel Hill Computational Astronomy and Physics Research Experience for Undergraduates programme.
REFERENCES
Adams F. C., 2010,Annual Review of Astronomy and Astrophysics, 48, 47 Amelin Y., Krot A. N., Hutcheon I. D., Ulyanov A. A., 2002,Science, 297,
1678
Amelin Y., Kaltenbach A., Iizuka T., Stirling C. H., Ireland T. R., Petaev M., Jacobsen S. B., 2010,Earth and Planetary Science Letters, 300, 343 Bai X.-N., Stone J. M., 2010,The Astrophysical Journal Supplement Series,
190, 297
Bianchi S., Schneider R., 2007,Monthly Notices of the Royal Astronomical Society, 378, 973
Biscaro C., CherchneffI., 2014,Astronomy & Astrophysics, 564, A25 Biscaro C., CherchneffI., 2016,Astronomy & Astrophysics, 589, A132 Blondin J. M., Wright E. B., Borkowski K. J., Reynolds S. P., 1998,
The Astrophysical Journal, 500, 342
Bocchio M., Jones A. P., Slavin J. D., 2014,Astronomy & Astrophysics, 570, A32
Bocchio M., Marassi S., Schneider R., Bianchi S., Limongi M., ChieffiA., 2016,Astronomy & Astrophysics, 587, A157
Boggs S. E., et al., 2015,Science, 348, 670
Boss A. P., Keiser S. A., 2010,The Astrophysical Journal, 717, L1 Boss A. P., Keiser S. A., 2012,The Astrophysical Journal, 756, L9 Boss A. P., Keiser S. A., 2013,The Astrophysical Journal, 770, 51 Boss A. P., Keiser S. A., 2014,The Astrophysical Journal, 788, 20 Boss A. P., Keiser S. A., 2015,The Astrophysical Journal, 809, 103 Boss A. P., Ipatov S. I., Keiser S. A., Myhill E. A., Vanhala H. A. T., 2008,
The Astrophysical Journal, 686, 12
Boss A. P., Keiser S. A., Ipatov S. I., Myhill E. A., Vanhala H. A. T., 2010, The Astrophysical Journal, 708, 1268
Bryan G. L., et al., 2014,The Astrophysical Journal Supplement Series, 211, 19
Cameron A., Truran J., 1977,Icarus, 30, 447
Chandrasekhar S., 1961, Hydrodynamic and Hydromagnetic Stability. In-ternational Series of Monographs on Physics, Oxford
ChieffiA., Limongi M., 2013,The Astrophysical Journal, 764, 21 Cioffi D. F., McKee C. F., Bertschinger E., 1988,
The Astrophysical Journal, 334, 252
Clayton D. D., 1975,The Astrophysical Journal, 199, 765 Clayton D. D., 1979,Astrophysics and Space Science, 65, 179
Clayton D. D., Nittler L. R., 2004,
Annual Review of Astronomy and Astrophysics, 42, 39 Cobb A. K., Pudritz R. E., 2014,The Astrophysical Journal, 783, 140 Colella P., Woodward P. R., 1984,Journal of Computational Physics, 54,
174
Crutcher R. M., 2012,Annual Review of Astronomy and Astrophysics, 50, 29
DeLaney T., et al., 2010,The Astrophysical Journal, 725, 2038 Diehl R., et al., 2006,Nature, 439, 45
Draine B. T., Salpeter E. E., 1979,The Astrophysical Journal, 231, 77 Dunne L., et al., 2009,Monthly Notices of the Royal Astronomical Society,
394, 1307
Elmegreen B. G., 1981,The Astrophysical Journal, 251, 820
Elmegreen B. G., Scalo J., 2004,Annual Review of Astronomy and Astrophysics, 42, 211
Foster P. N., Boss A. P., 1997,The Astrophysical Journal, 489, 346 Fryxell B., et al., 2000,The Astrophysical Journal Supplement Series, 131,