EFFECTIVE DOSE AND IMAGE QUALITY OF CBCT DIAGNOSTIC IMAGING SCANS
Cameron G. Walker DDS, PhD
A thesis submitted to the faculty of the University of North Carolina at Chapel Hill in partial fulfillment of the requirements for the degree of Master of Science in the School of Dentistry (Orthodontics).
Chapel Hill 2012
Approved by
John Ludlow, DDS, MS
ABSTRACT
CAMERON G. WALKER: Effective Dose and Image Quality of CBCT Diagnostic Imaging Scans
(Under the direction of Dr. John Ludlow)
ACKNOWLEDGEMENTS
I would like to thank the following for their contribution, support and dedication:
Dr. John Ludlow, for his mentorship, support and encouragement throughout the development of this project;
Dr. Tung Nguyen, for his help and advice
Dr. William Proffit, for his advice, input and insight.
TABLE OF CONTENTS
LIST OF TABLES... ... vi
LIST OF FIGURES... .vii
I. LITERATURE REVIEW ... 1
II. MANUSCRIPT INTRODUCTION ... 3
III. MATERIALS AND METHODS ... 8
IV. RESULTS ... 13
V. DISCUSSION ... 16
VI. CONCLUSIONS ... 20
LIST OF TABLES
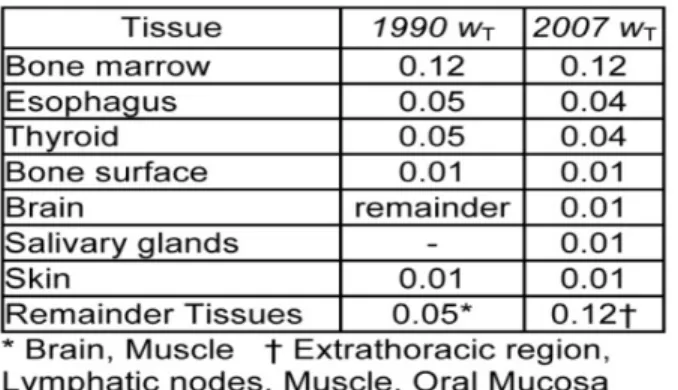
Table 1. ICRP Tissue Weights 1990 vs 2007 ... 21
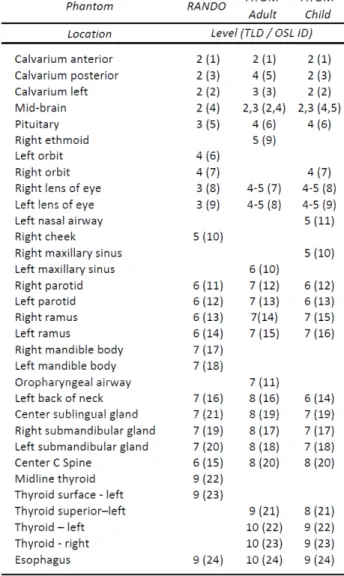
Table 2. Location of Dosimeters in Anthropomorphic Phantoms by Level ... 22
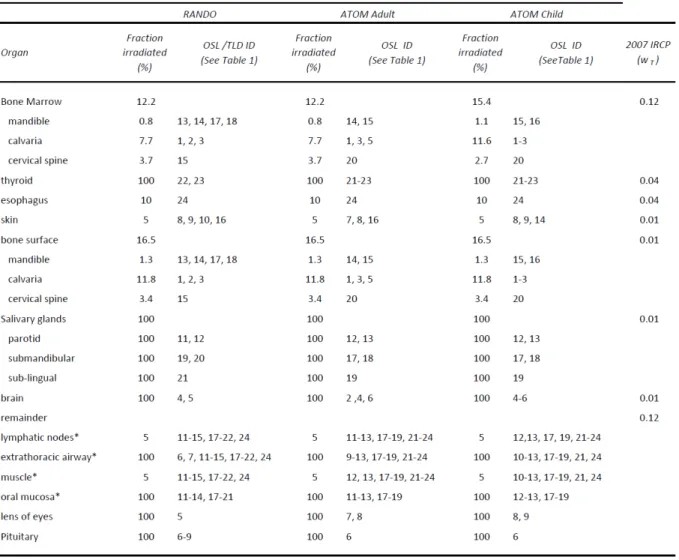
Table 3. Tissue Irradiated ... 23
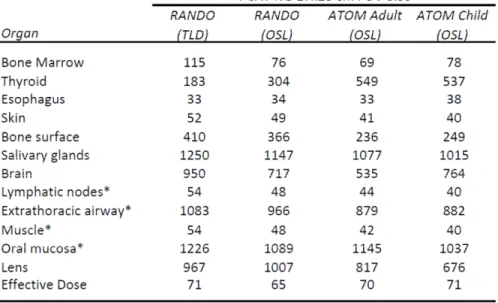
Table 4. Equivalent and Effective Dose ... 24
Table 5. Equivalent Dose and Percent Variation ... 25
Table 6. OSL Dosimeter Dose and Percent Variation ... 26
LIST OF FIGURES
Figure 1. MicroStarTM Reader and NanoDotTM Dosimeters ... 28
Figure 2. Phantoms and Levels ... 29
Figure 3. Lateral Cephalometric View of Scans for Verification of Phantom Position ... 30
I LITERATURE REVIEW
The use of ionizing radiation in diagnostic medical examinations has increased over the last 20 years to the point where the annual per capita dose to the US population from all sources has doubled (1). The risk of this exposure is significant, and it has been estimated that from 1.5% to 2% of all US cancers may be attributed to computed tomography (CT) studies alone (2). While CT is being used in all aspects of medical diagnosis, a dramatic increase in the use of cone beam CT (CBCT), a form of CT, has occurred in dentistry during the last decade. Some have already declared this the “gold standard” of maxillofacial imaging and predict that it will be used by most dental practices within the next decade(3). Along with many other areas of dental practice technology has found application in orthodontic treatment planning, which is often initiated in the pre-teen age patient(4). This is a
particularly vulnerable group because cellular growth and organ development increases the radiosensitivity of tissues. In conjunction with a longer life expectancy in which cancer can develop, adolescents may be twice as sensitive to radiation carcinogenesis as mature
fold differences in dose(6). The FDA recently advocated universal adoption of two principles of radiation protection: appropriate justification for ordering each procedure, and careful optimization of the radiation dose used during each procedure. But because aspects of device use and issues related to clinical decision making fall outside of its purview, the FDA is also encouraging complementary actions for other groups to take, which will support the FDA effort. Among these is the development of diagnostic reference levels both locally and
through a national radiation dose registry(7). Because current methods of measuring radiation dose are largely based on adult-sized models, providing meaningful dose metrics for
II INTRODUCTION
A review paper published at the end of 2007 in the New England Journal of Medicine (NEJM), estimated that from 1.5% to 2% of all cancers in the United States (US) may be attributable to the radiation from computed tomography (CT) studies(2). When the total number of CT examinations during the period from 1993 to 2006 are graphed, an exponential rise in the number of examinations far exceeding the growth in the US
population over the same period can be appreciated(1). In 1994 total annual effective dose of ionizing radiation to a person in the US was estimated at 3.60 mSv(8). Of this total,
approximately 0.49 mSv was attributed to exposures from ionizing radiation in diagnostic procedures. Current estimates of per capita annual US dose are 6.20 mSv with almost 3 mSv coming from diagnostic procedures(1).
may have an effective dose of approximately 2 mSv(10). CBCT examinations have been reported to impart a fraction of this dose; however, scans from some units approach 1 mSv, (11)and scans from other units have been shown to be equivalent in dose to optimized CT scans(6). This range of differences is especially important when considering the pediatric population because cellular growth and organ development is associated with increased radiosensitivity of tissues. In conjunction with a longer life expectancy in which cancer can develop, children may be two times or more sensitive to radiation carcinogenesis as mature adults(7,10).
According to our published measurements, a CBCT examination might result in a 2.5 increase in adult dose using a NewTom 3G, a low-dose unit (68 µSv) in comparison with conventional panoramic and cephalometric imaging (26 µSv)(12) (13). However, other CBCT units and protocols may result in much higher doses to the patient. For example we reported a 21-fold increase in patient dose with the CB Murcuray (569 µSv) over
conventional imaging(12). This represents a substantial increase over conventional
alternatives for an increase in diagnostic efficacy or patient treatment efficacy that has yet to be demonstrated. As much as 90% of those beginning orthodontic treatment for the first time are pediatric patients. In comparison to adults, radiation risk is significantly greater for this group of patients.
risk. To address this issue the International Commission on Radiological Protection (ICRP) suggested in 1990 that effective dose (E) be adopted as the best means of comparing dose and risk from any exposure to ionizing radiation(14). Organs and tissues known to be most susceptible to radiation damage were assigned weights that represent the relative contribution of each tissue to overall risk. Effective dose, reported in Sieverts, was defined as the sum of the products of each tissue-weighting factor (WT) and the equivalent dose to that tissue (HT)
or ∑ (14). Using extrapolations of cancer morbidity and mortality data
associated with well documented exposures to large populations, such as the survivors of the atomic bomb explosions, radiation detriment, including the weighted probabilities of fatal and non-fatal cancer, can be calculated from effective dose.
In 2007 the ICRP published a revision of the tissues and weights used in effective dose calculation based on data accumulated since the original publication(9). Of significance for maxillofacial imaging is an increase in the risk estimation for brain tissues and the
addition of salivary glands, oral mucosa and lymph nodes, which may be partially or fully irradiated during maxillofacial examinations. These changes in the calculation of risk from x-ray exposures to the head and neck area prescribed by ICRP have resulted in increases in estimated risk to adult patients by as much as 422% from previously used 1990 calculations (6,11,12,15,16)
anthropomorphic phantom. Alternate techniques for calculating dose that do not use
anthropomorphic phantoms include CTDIvol, Air Kerma-area-product (KAP), and Dose area product (DAP). In a previous study comparing anthropomorphic phantom and a standard acrylic cylinder with a single ion chamber used to calculate (CTDIvol) we demonstrated that the standard acrylic cylinder underestimates effective dose by 38%-62%(6). This
underestimation is in part due to the failure to account for scatter dose to tissues outside of the scan region. KAP is another method that has recently been used to calculate dose(17). Values reported in the referenced study underestimate effective dose measured with an anthropomorphic phantom in our own studies by 90% to 300%(6,15). Dose area product (DAP) has also been suggested as a simple approach for calculating dose. However, our experiments with the SCANORA 3D (Sorodex, Milwaukee, WI) unit revealed an
approximately 3-fold change in effective dose between various locations of the small FOV with no change in DAP (unpublished data). In contrast, anthropomorphic phantoms made from materials that have similar x-ray attenuation characteristics as human tissue and have multiple dosimeters allow for accurate measurement of absorbed dose. In a recent study we confirmed that an anthropomorphic phantom using bone equivalent material in place of a human skeleton can provide reliable measures of effective dose(18). Overall, our review of the literature and findings from our previous studies indicate that the anthropomorphic phantom currently provides the most reliable dose measurements.
dose information remains incomplete, outdated, or non-existent with no objective standards of image quality. To further address the important issues surrounding this rapidly developing imaging modality we propose a thorough investigation of CBCT dosimetry and the
III MATERIALS AND METHODS
Three head and neck phantoms were used in the study the RANDO adult skull (Radiation analog dosimetry system: Nuclear Associates, Hicksville, NY) , an adult male ATOM phantom (Model 701, CIRS, Northfolk, VA) and a 10 year-old ATOM phantom (Model 706, CIRS, Northfolk, VA). To allow for dosimeter placement, each phantom was sectioned into 25 mm thick increments (see Figure 1). The RANDO and ATOM phantoms were further modified to allow for loading of the 10mm x10mm x 1.5mm NanoDotTM OSL chips (Launduer inc., Glenwood, IL ). The Dosimeter locations for the RANDO phantom were unchanged from previous studies (6,15,21) and have been identified along with their corresponding level in Table 1. Similar to the RANDO, locations for dosimeters in the ATOM phantoms were chosen to correspond with organs that are sensitive to ionizing radiation according to the 2007 ICRP recommendations(9). The 24 dosimeter locations for the ATOM phantoms with their corresponding levels are listed in Table 1.
In the scans where the 3mm x 3mm x 1mm thermoluminescent dosimeters (TLD) were used, all TLDs were precalibrated, supplied and analyzed by Landauer Inc. (Glenwood, IL). Optical stimulated luminescent (OSL) NanoDotTM dosimeters (Landauer Inc.,
Glenwood, IL) were cleared by exposure to a low UV emitting light source for 24 hours according to the manufactures instructions. The dosimeters were then read with the
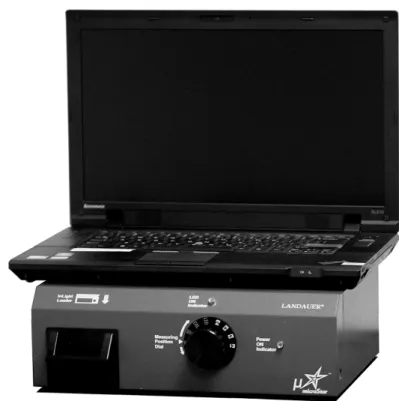
MicroStarTM reader (Landauer Inc., Glenwood, IL) (see Figure 2) to obtain baseline readings. The RANDO, ATOM adult, and ATOM child phantoms were loaded with dosimeters and scanned three times at the settings defined above. To minimize any potential variations in dose an effort was made to position each phantom in the machines in a similar manner. The phantoms were set in position with the scan rotation parallel to the section planes, which in turn were approximately parallel to Frankfort horizontal, a line connecting the infraorbital rim to the external auditory meatus.
After exposure, the dosimeters were removed from the phantoms and OSL dose information was read using the MicroStarTM reader. The OSL dosimeters were allowed to stabilize for at least 10 minutes before reading. The baseline readings for each dosimeter were subtracted to provide the absorbed dose in mRads for each dosimeter. Each value was then divided by the number of scans to provide the average absorbed dose per scan for each dosimeter. Before effective dose was calculated a beam energy calibration factor was used to correct for variations in dosimeter sensitivity across a range of beam energies. Average beam energy was estimated to be 56% of peak kV (22). The conversion factor was then calculated using the following equation derived from dose response data supplied by Landauer(22).
where x = average energy (keV); Using this equation, the calibration factor for the i-CAT (120kV) was 1.118. The calibration factor was multiplied directly to the absorbed dose per scan to obtain the corrected absorbed dose per scan.
TLD dosimeters were sent to the manufacturer for reading (Landauer). The
methodology was described previously (6,15), but briefly, TLD dosimeters were analyzed using an automatic hot gas reader. Individual chip sensitivity was used as a correction factor for the reading obtained from each chip. Reported doses were divided by the number of scans to calculate the “exposure per scan” for each dosimeter.
For both TLD and OSL scans, doses readings from discrete anatomical locations were added together and averaged to obtain an average tissue or organ dose in micrograys. These values were then multiplied by the corresponding estimated percentage of the tissue or organ that was irradiated (see Table 3) in the examination to calculate the equivalent dose (HT) in
microsieverts (μSv).
For bone marrow, the weighted dose is calculated using the summation of the
All other proportions of tissues exposed in the head and neck exam including the skin, lymphatic nodes and muscle were set to be equivalent among the three phantoms. Following the protocol of Ludlow et al(6), the proportion of the skin surface area in the head and neck region directly exposed by each technique was estimated at 5% of the total body allowing the calculation of weighted radiation dose to the skin. Similarly muscle and lymphatic node exposures were estimated to represent 5% of the total body complement of these tissues. The proportion of the esophageal tract that is exposed was set at 10%.
The calculation of effective dose E=∑wT x HT expressed in μSv is the recommended
way to compare the differential exposures to ionizing radiation to an equivalent full body standard(9). The IRCP 2007 tissue weights (wT) were used to obtain weighted equivalent
doses for all exposed organs or tissues (see Table1 and Table 3). The whole body effective dose E was then obtained by summing the weighted doses.
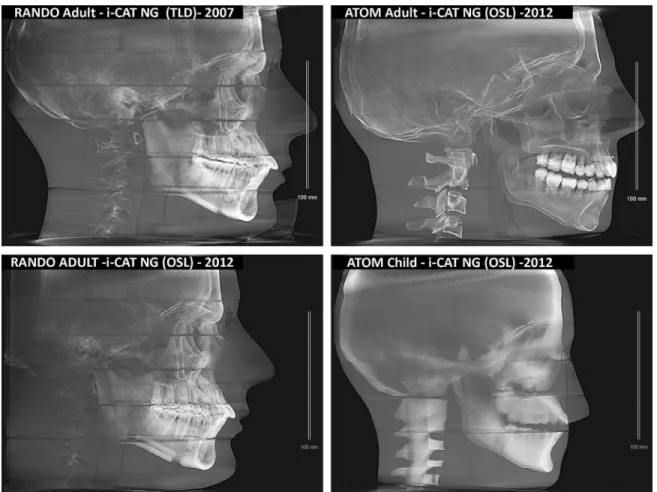
DICOM files were saved from each scan so that the positioning of the phantom could be verified to help explain any potential differences in dose. DICOM files were imported and analyzed using Dolphin 3D software (Dolphin imaging, Chatsworth CA). Two dimensional lateral cephalometric images were generated from the 3D scans to allow for verification of the exposure area.
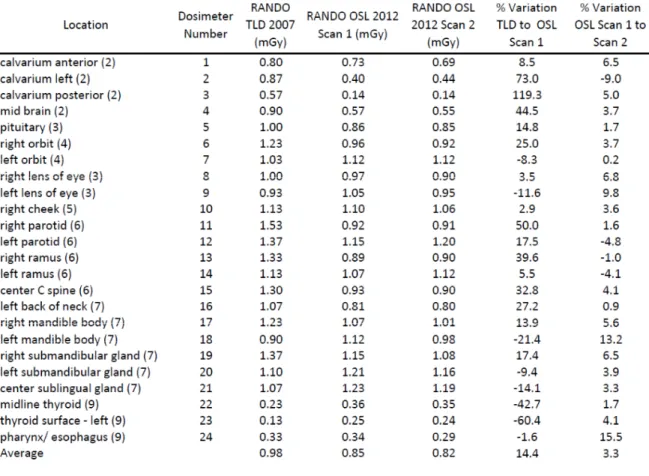
Repeated scans on using the RANDO phantom were taken to determine the precision of OSL dosimeter measurements. Each of the 24 dosimeter readings was compared and the percent variation was calculated for each and reported in a table (see Table 6).
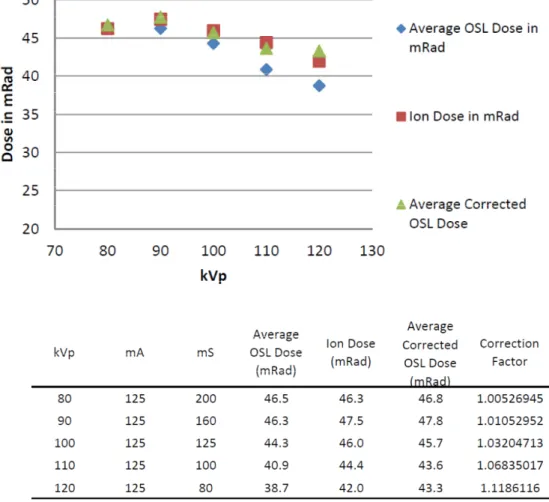
Four OSL dosimeters, two on each side of the ion chamber were attached to a radiolucent surface (25). After exposure, the ion chamber reading was reset and the dosimeters were changed and different dosimeters were affixed. The kVp was increased at intervals of 10kV starting at 80kV and ending at 120kV. Current was set at a constant 125mA. Exposure time was reduced as kV was increased in order to keep the dose of a similar magnitude across each of the test conditions (see Figure 4). Measurements from the ion chamber were recorded in milli-Röentgens and then converted to mRads at 1R= 0.876 Rads in air. Dose readings of each of the 4 OSL dosimeters were averaged together to give the average dose in mRad. The calculated conversion factors for each kVp setting were multiplied by the
average OSL dose to calculate the average corrected dose in mRad. The doses from the ion chamber were plotted against kVp along with the uncorrected and corrected OSL doses (see Figure 4).
IV RESULTS
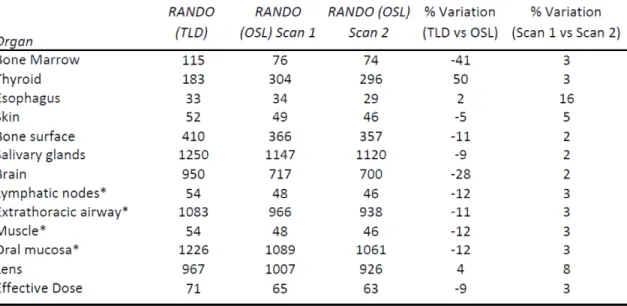
Equivalent dose information is summarized in table 4. Equivalent doses were highest for salivary gland tissues. Next highest was the oral mucosa followed by the extrathoracic airway and brain. The effective dose calculated for the RANDO phantom using TLDs was 71 µSv compared to 65 µSv when using OSL dosimeters. Effective dose was calculated to be 70 µSv using the ATOM adult phantom with OSL dosimeters. The ATOM child was very similar at 71 µSv. The reconstructed lateral cephalagrams, found in Figure 3, allow for the comparison of phantom position in the scans. Phantom position in the volume was similar in the RANDO (TLD), ATOM adult and ATOM child. In contrast, the RANDO (OSL) scan appears to be positioned in such a way that the posterior calvarium is not exposed in a similar way to the other phantoms.
A repeat scan of the RANDO phantom using OSL dosimeters was conducted in order to OSL reliability. The results of the repeated scan can be found in table 5. The percent
equivalent doses varied by less than 5% and equivalent dose to bone marrow, thyroid and brain varied by 41%, 50%, 28% respectively.
When looking directly at the dosimeter readings to compare the OSL with TLD scans in mGy (see Table 6), the posterior calvarium had the highest variation at 119% followed by left calvarium, thyroid surface left, right parotid and midbrain at 73%, 60% 50% and 44% variation respectively. The lowest variation was in the pharynx / esophagus at 1.6% followed by the right cheek, right lens of eye left ramus and left orbit at 2.9%, 3.5%, 5.5% and 8.3 % varitation respectively. The total average variation was 14.4 percent.
The repeated OSL scans with the RANDO phantom were compared at the dosimeter level (see table 6). The highest variation was 15.5% found in the esophagus followed by 13.2% in the left mandible body and 9% variation in the left calvarium. The lowest variations were 0.2%, 0.9% and 1.0% in the left orbit, left back of the neck and right ramus
respectively.
Verification of the recommended correction for kVp was conducted using an ion chamber, NanoDotTM dosimeters and a medical radiography system. The decrease in NanoDotTM dosimeter sensitivity with the increase in kVp is demonstrated in figure 4. At
80kV the uncorrected average OSL dose was almost identical to the dose measured by the ion chamber. However, the discrepancy between average OSL dose and ion dose increased as kVp increased. Application of the calibration factors successfully corrected the average OSL dose as demonstrated in (See figure 4).
V DISCUSSION
The most interesting of our results was the variation in equivalent and effective doses that we observed between OSL and TLD dosimeters (see table 5) in the RANDO phantom. We identified five potential explanations for the variation between the OSL and TLD dosimeter scans; 1) OSL and TLD calibration and kVp correction issues 2) random error 3) radiation incidence angle dependence 4) machine changes that occurred in the 5 years between 2007 and 2012 5) Phantom positioning differences.
To explore the variation between the OSL and TLD readings we first verified our dosimeter calibration as well as our correction for kVp using an ion chamber, NanoDotTM dosimeters and a medical radiographic system. The NanoDotTM dosimeters were optimized by Landauer for readings at 80kV (44keV) and need no correction at that beam energy. We verified the accuracy of our OSL dosimeters at 80kV using the ion chamber (Figure 4) with the ion dose and the average OSL dose only varying by 0.1%. We then verified the accuracy of the correction factors provided by Landauer by changing kVp (see Figure 4). The
correction factor reduced the variation from 2% to 0.8% at 120 kV. Hence, the variation between the 2007 TLD readings and the 2012 OSL readings cannot be explained by improper OSL calibration or kVp correction.
The TLDs used for the 2007 scans were provided and analyzed by Landauer.
confirm the calibration and correction process that they had in place at that time. Because we did not directly control the TLD calibration and reading process, it is possible that some of the difference between the 2007 RANDO readings and the 2012 readings may be due issues with the TLD process. This highlights one of the advantages to being in control of the read and calibration process.
The OSL dosimeters contain Al2O3:C discs inside the plastic housings that are 5mm in
diameter and 0.1mm thick. It is logical to think that in a 360 degree CBCT examination around a stationary phantom the dosimeter would be exposed at the 0.1mm thick edge for a short period of time potentially reducing the sensitivity. However, previous studies by Lavoei et al (25) and Jursinic (26) found negligible change in angular response when the dosimeters where exposed while in a head and neck phantom. Moreover, the angular dependence of OSLs is equivalent to that of TLDs (26) and thus cannot be the source of the variation between the two.
We also considered that there may have been a change in to the Next Generation i-CAT machine itself between 2007 and 2012. We used the same physical machine for our 2007 TLD scans as well as our 2012 OSL exposures and according to the manufacture, no updates to the machine had occurred that would have altered the filtration or the exposure settings.
the RANDO TLD scan the OSL scan appears to be positioned ~5mm more inferiorly and is not centered in the anterior-posterior dimension resulting in the posterior portion of the cranium outside the field of view.
The equivalent doses for both OSL and TLD scans followed the same general pattern except for thyroid and bone marrow. Even though the TLD scan was positioned ~5mm higher in the volume than the OSL scan, the equivalent thyroid dose the TLD scan was 50% lower than the OSL measurement. If the discrepancy in thyroid dose were due to vertical phantom position we would expect that the equivalent thyroid dose in the TLD scan would be greater than the OSL dose due to possible increased neck exposure. Hence, the difference in thyroid dose may not easily be explained by variation in vertical phantom position.
In contrast, the 41% variation in equivalent bone marrow dose between the TLDs and OSLs might better be explained by phantom position. The lateral cephalometric
reconstructions demonstrate that the posterior cranium dosimeters were out of the scan field of view in the OSL scans. Additionally the percent variation between the OSL and TLD scans by dosimeter shows a 119% difference in the posterior calvarium dosimeter.
The reduced calvarial dose may have partially contributed to the decrease in bone marrow dose in the OSL scans. However, posterior calvarial dose can only explain a maximum of 12.5% of bone marrow dose variation leaving the remaining 28 percent of variation unexplained.
after the 2007 update. Thus, similar to the updated ICRP 2007 guidelines, in the updated ATOM phantoms, less emphasis is placed on skin surface and more dosimeters are devoted to the brain, bone marrow and thyroid. The only area that shows a large difference in equivalent dose is the thyroid with the ATOM phantoms showing an increased thyroid dose relative to the RANDO (OSL). The differences in dosimeter location, coupled with potential differences in size and attenuation characteristics result in a difference in soft equivalent doses as well as effective dose between the ATOM and RANDO phantoms.
As expected, the equivalent dose for bone marrow was increased in the ATOM child phantom relative to the ATOM adult. Equivalent dose for brain was also increased in the child phantom. We postulate that the smaller size of the child allowed for a larger percentage of the cranium to be exposed at the 17x23cm field of view. Increased bone marrow and brain equivalent doses resulted in a numerically larger effective dose in the child phantom
VI CONCLUSIONS
1. Optically stimulated luminescent dosimeters are an accurate and repeatable tool for conducting dosimetry with head and neck phantoms.
2. Control of the TLD reading and calibration process is important to be able to explain variations ensure reliable dosimetry.
VII. TABLES
Table 1. ICRP Tissue Weights 1990 vs 2007
Table 3. Tissue Irradiated
Table 4. Equivalent and Effective Dose
Table 5. Equivalent Dose and Percent Variation
VIII. FIGURES
Figure 4 Verification of OSL Calibration and Correction for Variations in kVp
REFERENCES
1. Ionizing Radiation Exposure of the Population of the United States: Recommendations of the National Council On Radiation Protection and Measurements. 2009;160.
2. Brenner DJ, Hall EJ. Computed tomography--an increasing source of radiation exposure. N Engl J Med 2007;357:2277-2284.
3. Thomas SL. Application of cone-beam CT in the office setting. Dent Clin North Am 2008;52:753-9, vi.
4. Hechler SL. Cone-beam CT: applications in orthodontics. Dent Clin North Am 2008;52:809-23, vii.
5. www.sedentexct.edu [homepage on the internet]. Radiation Protection: Cone Beam CT for Dental and Maxillofacial Radiology Provisional guidelines. 2009;v1.1.
6. Ludlow JB, Ivanovic M. Comparative dosimetry of dental CBCT devices and 64-slice CT for oral and maxillofacial radiology. Oral Surg Oral Med Oral Pathol Oral Radiol Endod 2008;106:106-114.
7. Brenner D, Elliston C, Hall E, Berdon W. Estimated risks of radiation-induced fatal cancer from pediatric CT. AJR Am J Roentgenol 2001;176:289-296.
8. Goaz PW WS. Oral Radiology, Principles and Interpretation. St Lois: Mosby;1994. 9. Valentin J. The 2007 Recommendations of the International Commission on Radiological Protection. Publication 93. Ann ICRP 2007;37:1-332.
10. Smith-Bindman R, Lipson J, Marcus R, Kim KP, Mahesh M, Gould R, Berrington de Gonzalez A, Miglioretti DL. Radiation dose associated with common computed tomography examinations and the associated lifetime attributable risk of cancer. Arch Intern Med
2009;169:2078-2086.
11. Ludlow JB, Davies-Ludlow LE, Brooks SL, Howerton WB. Dosimetry of 3 CBCT devices for oral and maxillofacial radiology: CB Mercuray, NewTom 3G and i-CAT. Dentomaxillofac Radiol 2006;35:219-226.
13. Ludlow JB, Davies-Ludlow LE, White SC. Patient risk related to common dental radiographic examinations: the impact of 2007 International Commission on Radiological Protection recommendations regarding dose calculation. J Am Dent Assoc 2008;139:1237-1243.
14. 1990 Recommendations of the International Commission on Radiological Protection, ICRP Publication 60. Ann ICRP 1991;21:1-201.
15. Ludlow JB, Davies-Ludlow LE, Brooks SL. Dosimetry of two extraoral direct digital imaging devices: NewTom cone beam CT and Orthophos Plus DS panoramic unit. Dentomaxillofac Radiol 2003;32:229-234.
16. Ludlow JB. A manufacturer's role in reducing the dose of cone beam computed tomography examinations: effect of beam filtration. Dentomaxillofac Radiol 2011;40:115-122.
17. Vassileva J, Stoyanov D. Quality control and patient dosimetry in dental cone beam CT. Radiat Prot Dosimetry 2010;139:310-312.
18. Qu XM, Li G, Ludlow JB, Zhang ZY, Ma XC. Effective radiation dose of ProMax 3D cone-beam computerized tomography scanner with different dental protocols. Oral Surg Oral Med Oral Pathol Oral Radiol Endod 2010;110:770-776.
19. Kim SH, Kang JM, Choi B, Nelson G. Clinical application of a stereolithographic surgical guide for simple positioning of orthodontic mini-implants. World J Orthod 2008;9:371-382.
20. Lin EY. SureSmile applies CBCT to custom orthodontic thearapy. 2008;2012. 21. Ludlow JB, Gubler M, Cevidanes L, Mol A. Precision of cephalometric landmark
identification: cone-beam computed tomography vs conventional cephalometric views. Am J Orthod Dentofacial Orthop 2009;136:312.e1-10; discussion 312-3.
22. Yahnke CJ, Hanify RD, Salasky M.R. Microstar Calibration Conversion Factors for DOT's. 2008.
23. Cristy M. Mathmatical Phantoms representing children of various ages for use in estimates of internal dose. Washington DC: US Nuclear Regulatory Commission Report NUREG/CR-1159;1980.
24. Physical aspects of irradiation. NBS handbook no. 85. : US Government Printing Office;1963.