Approaches to detect genetic effects that
differ between two strata in genome-wide
meta-analyses: Recommendations based on a
systematic evaluation
Thomas W. Winkler1, Anne E. Justice2, L. Adrienne Cupples3,4, Florian Kronenberg5, Zolta´n Kutalik6,7☯, Iris M. Heid1☯
*, the GIANT consortium
1 Department of Genetic Epidemiology, University of Regensburg, Regensburg, Germany, 2 Department of
Epidemiology, University of North Carolina, Chapel Hill, NC, United States of America, 3 Department of Biostatistics, Boston University School of Public Health, Boston, MA, United States of America, 4 NHLBI Framingham Heart Study, Framingham, MA, United States of America, 5 Division of Genetic Epidemiology, Department of Medical Genetics, Molecular and Clinical Pharmacology, Medical University of Innsbruck, Innsbruck, Austria, 6 Institute of Social and Preventive Medicine, CHUV-UNIL, Lausanne, Switzerland,
7 Swiss Institute of Bioinformatics, Lausanne, Switzerland
☯These authors contributed equally to this work.
¶ Membership of the GIANT consortium is provided inS3 Note. *[email protected]
Abstract
Genome-wide association meta-analyses (GWAMAs) conducted separately by two strata have identified differences in genetic effects between strata, such as sex-differences for body fat distribution. However, there are several approaches to identify such differences and an uncertainty which approach to use. Assuming the availability of stratified GWAMA results, we compare various approaches to identify between-strata differences in genetic effects. We evaluate type I error and power via simulations and analytical comparisons for different scenarios of strata designs and for different types of between-strata differences. For strata of equal size, we find that the genome-wide test for difference without any filtering is the best approach to detect stratum-specific genetic effects with opposite directions, while filtering for overall association followed by the difference test is best to identify effects that are predominant in one stratum. When there is no a priori hypothesis on the type of differ-ence, a combination of both approaches can be recommended. Some approaches violate type I error control when conducted in the same data set. For strata of unequal size, the best approach depends on whether the genetic effect is predominant in the larger or in the smaller stratum. Based on real data from GIANT (>175 000 individuals), we exemplify the impact of the approaches on the detection of sex-differences for body fat distribution (identi-fying up to 10 loci). Our recommendations provide tangible guidelines for future GWAMAs that aim at identifying between-strata differences. A better understanding of such effects will help pinpoint the underlying mechanisms.
a1111111111 a1111111111 a1111111111 a1111111111 a1111111111 OPEN ACCESS
Citation: Winkler TW, Justice AE, Cupples LA,
Kronenberg F, Kutalik Z, Heid IM, et al. (2017) Approaches to detect genetic effects that differ between two strata in genome-wide meta-analyses: Recommendations based on a systematic evaluation. PLoS ONE 12(7): e0181038.https://doi. org/10.1371/journal.pone.0181038
Editor: David Meyre, McMaster University,
CANADA
Received: March 7, 2017
Accepted: June 26, 2017
Published: July 27, 2017
Copyright:©2017 Winkler et al. This is an open
access article distributed under the terms of the Creative Commons Attribution License, which permits unrestricted use, distribution, and reproduction in any medium, provided the original author and source are credited.
Data Availability Statement: Data are available
from the GIANT consortium website:http://portals. broadinstitute.org/collaboration/giant.
Funding: I.M.H. received funding from the
Introduction
Genome-wide association studies (GWAS) and genome-wide association meta-analyses (GWAMAs) are one of the most successful approaches to identify genetic regions that are rele-vant for complex phenotypes and diseases [1]. Usually in GWAMAs, a group responsible for meta-analyses develops an analysis plan describing each of the models to be conducted by par-ticipating studies and distributes it to study analysts; the study analysts then conduct the speci-fied study-specific GWAS and the meta-analysts collect, quality control, and meta-analyze the study-specific aggregated statistics across studies [2]. To not burden study partners too much, the study-specific analysis models are generally sparse, clearly described, and easy to conduct with available software in a standardized way.
Recently, the identification of genetic loci where the genetic effects are modulated by non-genetic factors such as sex or life-style factors (gene-environment interaction, GxE), became a major focus [3]. When the “environmental” factor is dichotomous—such as sex or ever versus never smoking—the interaction effect is equivalent to a difference of the genetic effect between the two groups (genetic effect with between-strata difference, GxS). Many GWAMA consortia do not search genome-wide for variants with GxS, but restrict their test for GxS on genetic var-iants that are identified with an overall genetic effect on the phenotype of interest [4–7]. How-ever, this approach would have little chance to detect an effect in opposite directions for the two strata. Only few consortia conduct GWAMAS based on models including an interaction effect [8] (Rao et al. 2017, accepted at Circulation Cardiovascular genetics). Notably, such interaction models can become particularly complex when further covariates are involved [9]. While such interaction models are theoretically feasible, they are also logistically challenging as the more complex models and limitations of GWAS software to extract multiple covariate estimates hamper the study analysts to conduct the analyses smoothly and correctly.
Several consortia conductstratified GWAMAS, where study analysts are asked to perform the analyses separately by stratum—for example separately for men and women or for persons with and without diabetes [4,5,7,10]. For study analysts, this is relatively straight forward to implement with existing genome-wide analysis software. For meta-analysts, stratified GWAS allow a stratified meta-analyses, opening up multiple options: (i) to test for stratum-specific effects(stratified association test), (ii) to combine stratified results together and to test for stra-tum-combined effects (overall association test[11]), (iii) to test for difference between stratum-specific effects (difference test[12]), or (iv) to test for joint effects accounting for potential GxS by using the sum of squared stratum-specific test statistics (alternative joint test[13]). The
alternative joint testwas shown to be equivalent to thejoint testcombining the main and the interaction effect for a dichotomous factor S [8]. Numerous variants with GxS have already been identified via stratified GWAMAs [8,14,15], applying different approaches to search for GxS. While the difference test is always the ultimate test to establish GxS and frequently uti-lized to search for GxS [12], there is also previous work where genetic variants are filtered prior to the difference testing using the overall [7,10], the stratified [12], or the joint test as a filter [8], allegedly to increase power. Still, the power to detect GxS depends on the type of GxS interaction: whether the effects point into opposite directions in the two strata (qualitative), the effect is zero in one stratum and significant in the other (pure), or the effects are direction-ally consistent being larger in one stratum (quantitative). A systematic evaluation of all app-roaches and a recommendation as to which approach should be utilized—with or without making assumptions on the type of GxS—are lacking.
Here, we conduct a systematic comparison of approaches to identify GxS based on stratified GWAMAs for a continuous outcome with regard to type I error and power. We exemplify the travel grants 2013 and 2015). Z.K. received
financial support from the Leenaards Foundation, the Swiss Institute of Bioinformatics and the Swiss National Science Foundation (31003A-143914 and 31003A_169929) and SystemsX.ch
(51RTP0_151019). The computational resources were provided by the University of Regensburg. The funders had no role in study design, data collection and analysis, decision to publish, or preparation of the manuscript.
Competing interests: The authors have declared
impact of the different approaches on the identification of sexually dimorphic variants for body fat distribution using real data from the GIANT consortium [12].
Materials and methods
Notation and models
We consider K studies and 2 strata, with a total sample size ofn = n1+n2,ni= sumk(nik),
k= 1. . .,K,i= 1,2 strata, andf = n2/n1. For an individualj,Y
ðjÞ
ik denotes a continuous phenotype
value andGðikjÞ= 0,1,2 the number of alleles for a genetic variant (omitting the indexing of the
millions of variants analyzed). A stratified GWAMA involves two steps, the study- and stra-tum-specific GWAS conducted by the study analyst and the strastra-tum-specific meta-analysis. Forstratified GWAS, the linear regression model computed per stratum for each of the genetic variants (omitting further covariates) can be written as
YikðjÞ ¼ /ikþbikG
ðjÞ
ik þE
ðjÞ
ik; ð1Þ
withαikdenoting the intercept,βikthe genetic effect andE
ðjÞ
ik Nð0;s
2
EikÞ. We assume that
phe-notypes have been normalized to have zero mean and unit variance in each study and stratum (i.e.,s2
Yik¼s
2
Y ¼1). We also assume similar minor allele frequencies across studies and strata
(MAFikMAF) and thus similar genotype variances,s2Gik¼s
2
G= 2
MAF(1-MAF), i.e. that
the SNP is not associated with the stratum variable and homogeneous across studies (S1 Note). Our notation here assumes that the studies include only unrelated individuals (see below for the extension to related individuals).
For the stratum-specific meta-analysis per variant, pooled genetic effect estimates,b^i, and standard errors,sei, are computed via an inverse-variance weighted meta-analysis by stratum
[16], assuming equal genetic effects across studies, since we focus on identification rather than quantification of genetic effects [17]. Under the assumption that the studies are from similar pop-ulations with similar genotypic variance, the inverse-variance weighted meta-analyzedb^iandsei
are approximately identical to an estimate derived from one single large mega-study [18,19].
Stratified GWAMA approaches to identify G x S
Our stratified GWAMA approaches are based on four statistical tests. The statistical test to identify GxS is thedifference test,ZDiff ¼ ð^b1 b^2Þ=
ffiffiffiffiffiffiffiffiffiffiffiffiffiffiffiffi
se2 1þse22
p
. This is under the assumption of no
relat-edness of subjects across strata and thus no correlation ofb^1with^b2. Under the assumption of
unrelated individuals across strata and no latent covariate interacting with a dichotomous factor S, the difference test is equivalent to testing interaction of the genetic effect with a dichotomous factor S. We consider three further tests that are utilized to filter genetic variants prior to the dif-ference testing: filtering on (i)overall association,ZOverall¼ ðb^1=se
2
1þb^2=se 2 2Þ=
ffiffiffiffiffiffiffiffiffiffiffiffiffiffiffiffiffiffiffiffiffiffiffiffiffiffi
1=se2 1þ1=se22
p
,
(ii)stratified association,Z1 ¼^b1=se1orZ2 ¼b^2=se2, or (iii) thealternative joint association, CJoint¼ ðb^1=se1Þ
2
þ ðb^2=se2Þ 2
. All test statistics can be computed based on stratified GWAMA
results, i.e. stratum-specific pooled genetic effect,b^i, and corresponding standard errors,sei,
i = 1,2 (seeS1 Tablefor a detailed description of the four tests).
The tests are used to generate various approaches to identify GxS. In the approach without filtering, the difference test is applied genome-wide,½DiffaDiff, and GxS can readily be
identi-fied using a genome-wide significance level ofαDiff= 5x10⁻⁸(= 0.05/1,000,000) [20]. In the
with lowest P-value within +/- 500,000 base positions). WhenMlead variants are selected by the filtering, these variants have an established association with the phenotype, but GxS has yet to be ascertained by the difference test using a Bonferroni-corrected significance level,αDiff=
0.05/M(S1 Methods). The stricter the filtering threshold, the smallerM, thus decreasing the multiple testing burden; however, a stricter filtering threshold might miss true GxS signals. We will thus consider varying filtering thresholds.
When overall, stratified or joint association filtering is applied to the same stratified GWAMA results as the difference test (one-stage approach), the approaches to detect GxS are denoted here as½OverallaFilter !DiffaDiff,½StrataFilter !DiffaDiffor½JointaFilter !DiffaDiff,
respec-tively. When the filtering test is statistically dependent on the difference test the tests have to be applied to two independent sets of stratified GWAMA results (two-stage approach) to achieve appropriate type 1 error control. To obtain two independent stratified GWAMA results, the available GWAS studies are to be separated into a first and a second stage and meta-analyzed by stage. Then the filtering is to be conducted in the first stage meta-analysis and the difference test in the second stage meta-analysis. We denote the respective two-stage approaches to detect GxS as½OverallaFilter ! ½DiffaDiff,½StrataFilter ! ½DiffaDiffor½JointaFilter ! ½DiffaDiff.
We explore the three filtering tests followed by the difference test both as one-stage and as two-stage approaches. Together with the difference test without filtering, this yields a total of seven approaches to detect GxS in our systematic evaluation (an overview of approaches is shown inS1 Fig).
Extending to related individuals
When a study includes related individuals, this can be accounted for within each stratified GWAS model and thus within each stratum by extending to mixed models [21]. Relatedness across studies within the same stratum can be handled via generalized meta-analysis [22]. Including related individuals across strata yields correlated stratum-specific (variant-specific) estimates (^b1andb^2). This correlation can be estimated by the Pearson correlation coefficient
of allb^1andb^2estimates across all genetic variants, denoted byr.
The test statistics for the difference test can then be extended toZDiff ¼ ðb^1 b^2Þ=
ffiffiffiffiffiffiffiffiffiffiffiffiffiffiffiffiffiffiffiffiffiffiffiffiffiffiffiffiffiffiffiffiffiffiffiffiffiffiffiffiffiffiffiffiffiffiffiffiffiffiffi
se2
1þse22 2Covðb^1;b^2Þ
q
and theCovðb^1;b^2Þcan be estimated byrse1se2. In the case of
related individuals (r>0), this correction yields more extreme test statistics compared to when relatedness is ignored and will thus have better power to detect a difference. When the individuals are unrelated (r close to 0), this formula is the same as the one given in the previous chapter. There is no disadvantage of using this extended formula in all circumstances.
For the filtering with the overall or the joint test, the inclusion of related subjects between strata without accounting for them will yield underestimated standard errors and therefore deflated p-values and larger type I error. Thus, when filtering at a threshold at, e.g. 5x10⁻⁵, the filtering will be less stringent allowing for more variants to pass. The filtering by the stratified test is unaffected by the inclusion of such related subjects.
Simulation-based evaluation of type I error
For each scenario and approach, we estimate the type I error rate for a 5% significance level as the proportion of nominally significant variants (PDiff<0.05) relative to the number of
con-ducted difference tests (# significant variants/1,000,000 without filtering, # significant variants/
Mwith filtering).
Analytical computation of power
For all stratified GWAMA approaches to detect GxS that have valid type I error, we compute power analytically. As a measure of the stratum-specific genetic effect, we introduce
Ri ¼bisG
sY ð2Þ
For each stratum,R2
i represents the phenotypic variance explained by the variant;Ridenotes
the direction of the effect as doesbi, which can be opposite in the two strata (qualitative GxS),
zero in one stratum and significant in the other (pure GxS), or directionally consistent with dif-ferent quantity (quantitative GxS). Analytical power formulae are provided in theS3 Methods for the difference test,PowerDiff, and for each of the filtering tests,PowerFilter, for varyingn1,f,
R1,R2, andα, wheren1reflects the sample size of the stratum with the larger absolute effect (|R2|
<= |R1|);αis the filtering threshold,αFilter, for the filtering tests or the significance level,αDiff,
for the difference test. When the filtering test and difference test are independent or when they are applied to two different stages of meta-analysis results, the power of the approach can be derived as the product of the power of the filtering test and the power of the difference test, i.e.
PowerApproach=PowerFilterPowerDiff(S3 Methods). Of note,n1andn2reflect the
stratum-spe-cific effective number of subjects for related subjects can be computed by the method proposed for correlated SNPs [23].
We compute the power of each approach for various realistic scenarios varying strata design and varying genetic effect sizes, motivated by the GIANT data withn= 200,000. We also varied the types of GxS (qualitative, pure, quantitative) and the filtering threshold (details inS4 Methods).
Genetic Investigation of Anthropometric Traits (GIANT) consortium
To exemplify the impact of the different stratified GWAMA approaches to detect GxS, we
uti-lize the sex-stratified GWAMA results for WHRadjBMI from GIANT [12]. This data
com-prises up to 77,000 men and 98,000 women from two independent stages that derive from the fact that the GWAS data was collected in two waves. The GWAMA results contain pooled sex-specific genetic effect estimates and standard errors for ~2.8 million variants. We apply each of the stratified GWAMA approaches with valid type I error to detect variants with between-sex difference, using the two stages for the two-stage approaches and meta-analyzing the stage-specific estimates by sex to generate one set of meta-analyzed results for each sex for the one-stage approaches. Given that the majority of the 2.8 million variants can be considered as not associated, we evaluate the empirical type I error by QQ plots and by calculating genomic con-trol inflation factors (λGC) [24]. We also derive the number of sexually dimorphic loci for
WHRadjBMI based on each of the approaches, to demonstrate the approaches taken.
Results
Overview
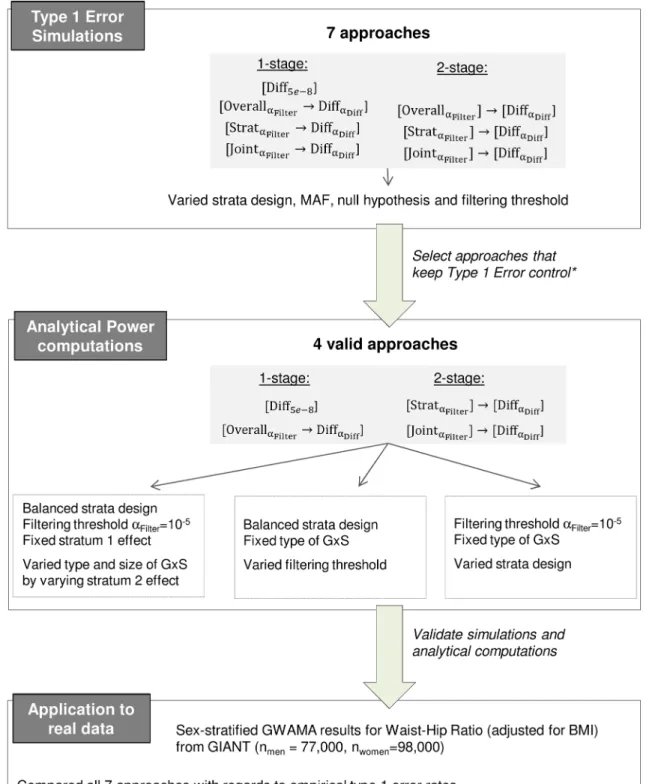
the best power, for various strata designs (balanced, unbalanced) with and without an a priori hypothesis of a given type of GxS (qualitative, pure, quantitative). We exemplify the impact of each approach on the identification of sexually dimorphic genetic variants for WHRadjBMI based on the sex-stratified GWAMA results from GIANT. A summary of the workflow is shown inFig 1.
Type I error of the stratified GWAMA approaches to detect GxS
In order to derive the empirical type I error for the seven stratified GWAMA approaches to detect GxS, we simulate genetic association data first under a balanced strata design withn1= 100,000,
n2= 100,000. Our results show that the difference test without filtering,½DiffaDiff, when judged at
a significance level of 0.05, keeps type I error control (4.97% to 5.02%,Table 1). Among the three one-stage approaches with filtering, we yield a valid type I error for the overall association filtering,
½OverallaFilter !DiffaDiff, but a severe violation of type I error control for the stratified test filtering
and the alternative joint test filtering,½StrataFilter !DiffaDiffand½JointaFilter !DiffaDiff(type I error
from 8.83% to 49.9%). When applied in two stages, all three filtering approaches,½OverallaFilter ! ½DiffaDiff,½StrataFilter ! ½DiffaDiff, or½JointaFilter ! ½DiffaDiff, keep type I error control as expected
(type I error from 4.90% to 5.18%,Table 1). These results are supported by QQ-plots depicting the observed distribution of the difference test P-values versus the expected, which show that the number of observed P-values matches the expected very well across the full range of values (S2 Fig
andS3 Fig). For unbalanced strata designs, we observe similar results (S4 FigandS5 Fig). Our results demonstrate that the stratified and the alternative joint tests are statistically not indepen-dent of the difference test, while the overall association is indepenindepen-dent.
In summary, the difference test without filtering and the overall association filtering prior to the difference testing are the only valid one-stage approaches, and all two-stage approaches are valid, yielding five valid approaches altogether:½DiffaDiff,½OverallaFilter !DiffaDiff,½OverallaFilter ! ½DiffaDiff,½StrataFilter ! ½DiffaDiffor½JointaFilter ! ½DiffaDiff. Since the one-stage approach
½OverallaFilter!DiffaDiffis valid and the two-stage approach½OverallaFilter ! ½DiffaDiffis not
expected to be more powerful, we will ignore the latter and focus in the following on the remain-ing four valid approaches.
Power of stratified GWAMA approaches to detect GxS under a balanced
strata design
Next, we compare the power of the selected four approaches to detect GxS,½DiffaDiff, ½OverallaFilter!DiffaDiff,½StrataFilter ! ½DiffaDiffand½JointaFilter ! ½DiffaDiff, for a balanced
strata design (n1= 100,000,n2= 100,000) for varying stratum-specific effect sizes, R1and R2,
and varying types and sizes of GxS. We assume a genome-wide significance level for the differ-ence test without filtering (αDiff= 5 x 10⁻⁸) and, for the approaches with filtering, a filtering
threshold ofαFilter= 1 x 10⁻⁵with a Bonferroni-corrected significance level at 0.05/Mfor the
subsequent difference test (Mbeing the number of filtered variants).
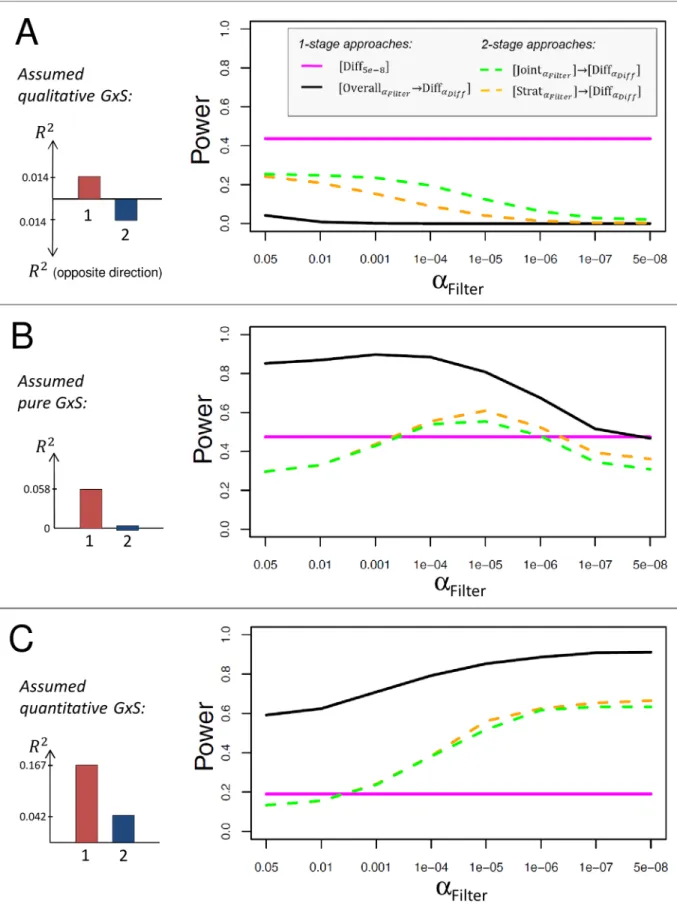
Our computations show that the power of an approach largely depends on the type of GxS (Fig 2A–2C): when the effects point into opposite direction (qualitative GxS), the difference test, [Diff5e-8], and the two-stage approaches½Strat1e 5 ! ½DiffaDiffand½Joint1e 5 ! ½DiffaDiff
per-form substantially better than the overall association filtering approach,½Overall1e 5 !DiffaDiff.
Fig 1. Workflow of the conducted analyses. The figure shows an overview on the four major project steps that were
power to detect a pure GxS is 80.8% for½Overall1e 5 !DiffaDiff, and only 47.4%, 61.1%, or
55.2%, for [Diff5e-8],½Strat1e 5 ! ½DiffaDiffor½Joint1e 5 ! ½DiffaDiff, respectively. When the
predominant effect (stratum 1) is large enough (Fig 2C), a quantitative or pure GxS can also be detected by the approaches [Diff5e-8],½Strat1e 5 ! ½DiffaDiffor½Joint1e 5 ! ½DiffaDiff, but with
less power compared to½Overall1e 5 ! ½DiffaDiff(18.9%, 56.2%, and 51.% compared to 85.3%
for a quantitative GxS withR2
1= 0.167%,R 2
2= 0.042%). In all scenarios,½Overall1e 5!DiffaDiff
is the best approach to detect pure GxS (with 0.7%, 80.8%, and>99.9% power for the three effect sizes of R1depicted inFig 2A–2C, respectively) and [Diff5e-8] is the best approach to detect a
qualitative GxS with equal effects pointing into opposite directions (43.7%,>99%, and>99% power for the three effect sizes of R1depicted inFig 2A–2C, respectively).
Among the two-stage approaches,½Joint1e 5 ! ½DiffaDiffhas more power compared to ½Strat1e 5 ! ½DiffaDifffor qualitative GxS and similar power for pure and quantitative GxS.
application and 4) Recommendation.*The valid 2-stage approach½OverallaFilter ! ½DiffaDiffwas omitted from power
computations due to expectedly lower power of the approach compared to the valid 1-stage approach½OverallaFilter!DiffaDiff
that makes use of the full available sample size for both filtering and difference testing.
https://doi.org/10.1371/journal.pone.0181038.g001
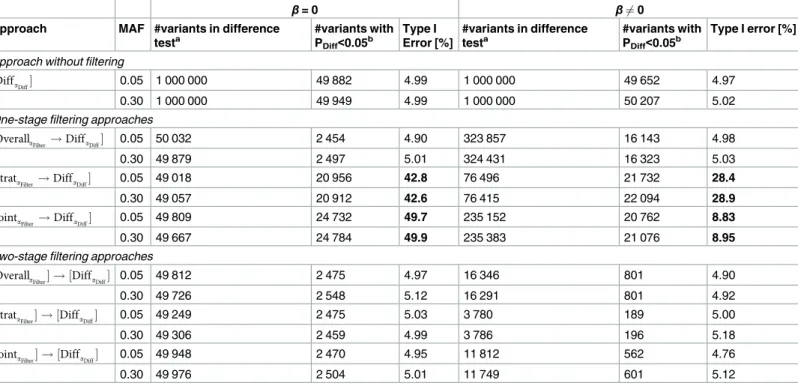
Table 1. Simulation-based Type I error for the seven stratified GWAMA approaches to detect GxS. Shown is the type I error at a 5% significance level
derived from simulated data as the proportion of variants with nominally significant difference test (PDiff<0.05) relative to the number of variants tested for
dif-ference (1,000,000 in the difdif-ference test without filtering, number of filtered variants in the approaches with filtering). The simulation results are based on a bal-anced strata design (n1= 100,000, n2= 100,000; split in half for two-stage approaches), variants with MAF = 0.05 or 0.30, and phenotypes simulated under
the null hypothesis of no GxS, i.e. no difference between stratum-specific effects (H0:β1=β2=β). We present the results forβ= 0 andβ6¼0. For the second
setting, we setβas the minimum effect size detectable at 80% power for the given MAF and the given sample size for the difference test (n = 200 000 for one-stage approaches,β= 0.029, 0.014 for MAF = 0.05, MAF = 0.30, respectively; nStage= 100,000 for the two-stage approaches,β= 0.041, 0.019 for
MAF = 0.05, MAF = 0.30, respectively). Marked in bold are violated type 1 error rates.
β= 0 β6¼0
Approach MAF #variants in difference
testa
#variants with PDiff<0.05
b Type I
Error [%]
#variants in difference testa
#variants with PDiff<0.05
b Type I error [%]
Approach without filtering
½DiffaDiff 0.05 1 000 000 49 882 4.99 1 000 000 49 652 4.97
0.30 1 000 000 49 949 4.99 1 000 000 50 207 5.02
One-stage filtering approaches
½OverallaFilter!DiffaDiff 0.05 50 032 2 454 4.90 323 857 16 143 4.98
0.30 49 879 2 497 5.01 324 431 16 323 5.03
½StrataFilter!DiffaDiff 0.05 49 018 20 956 42.8 76 496 21 732 28.4
0.30 49 057 20 912 42.6 76 415 22 094 28.9
½JointaFilter!DiffaDiff 0.05 49 809 24 732 49.7 235 152 20 762 8.83
0.30 49 667 24 784 49.9 235 383 21 076 8.95
Two-stage filtering approaches
½OverallaFilter ! ½DiffaDiff 0.05 49 812 2 475 4.97 16 346 801 4.90
0.30 49 726 2 548 5.12 16 291 801 4.92
½StrataFilter ! ½DiffaDiff 0.05 49 249 2 475 5.03 3 780 189 5.00
0.30 49 306 2 459 4.99 3 786 196 5.18
½JointaFilter ! ½DiffaDiff 0.05 49 948 2 470 4.95 11 812 562 4.76
0.30 49 976 2 504 5.01 11 749 601 5.12
a
Number of independent variants tested for difference.
b
Number of variants with nominally significant difference (PDiff<0.05); MAF = minor allele frequency.
Fig 2. Power of stratified GWAMA approaches to identify GxS for balanced strata design. Shown is the power to detect GxS in
However, both two-stage approaches are outperformed in all scenarios by one of the one-stage approaches [Diff5e-8] and½Overall1e 5 !DiffaDiff(Fig 2A–2C).
In summary, the difference test without any filtering, [Diff5e-8], and the approach filtering
for overall association followed by the difference test,½Overall1e 5 !DiffaDiff, are the two best
approaches to detect qualitative or pure/quantitative GxS, respectively.
Influence of varying filtering thresholds
We next investigate how the filtering threshold impacts the power of the approaches to identify GxS. We thus compute the power analytically for the various approaches under the same sce-narios as before (balanced strata design,n1= 100,000,n2= 100,000), but now vary the filtering
threshold,αFilter, from 0.05 to 5 x 10⁻⁸, again with a Bonferroni-correctedα-level for the
conse-cutive difference test, 0.05/M, withMbeing the number of filtered variants.
We observe the following: (1) For qualitative GxS (Fig 3A), the difference test without filter-ing, [Diff5e-8], shows better power than any filtering approach, irrespective ofαFilter. (2) For
pure GxS (Fig 3B), the overall association filtering,½OverallaFilter!DiffaDiff, has the best power,
irrespective ofαFilter; the power of this approach is the highest forαFilterof 0.05 to 1x10⁻⁴, but
then decreases with decreasingαFilterdown to a level that coincides with the power of the
differ-ence test without filtering (power = 46.7% and 47.4%, for approaches½Overall5e 8 !DiffaDiff
and [Diff5e-8], respectively). The two-stage approaches½JointaFilter ! ½DiffaDiffand½StrataFilter ! ½DiffaDiffshow a maximum power atαFilter= 1x10⁻⁵. (3) For quantitative GxS (Fig 3C), the
over-all association filtering,½OverallaFilter !DiffaDiff, again, has the highest power of all approaches,
irrespective ofαFilter. The power of all three filtering approaches increases with decreasing
filter-ing threshold.
Altogether, while [Diff5e-8] outperforms all filtering approaches for qualitative GxS,
½OverallaFilter!DiffaDiffis most powerful for pure/quantitative GxS. This approach can benefit
from less stringent filtering (i.e., largerαFilter, larger M) to detect pure GxS, but from more
stringent filtering (i.e., smallerαFilter, smaller M) to detect quantitative GxS, requiring a
com-promise to serve both.
Influence of unbalanced strata designs
We next investigate how an unbalanced strata design impacts the power of the approaches to identify GxS. We compute the power analytically for the same scenarios and approaches as previously, but now we model unbalanced strata designs by varying the proportion of the stra-tum sample sizes (with a totaln= 200,000, as before). Denotingf=n2/n1, with stratum 1
defin-ing the stratum with the larger effect,f= 0.05 indicates that stratum 1 (with the larger effect) is 20 times larger than stratum 2, whereasf= 20 indicates that stratum (with the larger effect) is in very small with only a 20thof stratum 2 sample size.
As expected from theory, we find that, for all three types of GxS (Fig 4A–4C), the power of [Diff5e-8] is symmetric to and at a maximum atf= 1. This indicates that the difference test
without filtering is most efficient, if the two strata are balanced in size, and that its power does not depend on whether the larger effect is in the larger or in the smaller stratum.
a fixed genetic effect in stratum 1,R2
1, that is (A) small (R 2
1¼0:014%), (B) medium (R 2
1¼0:058%), or (C) large (R 2
1¼0:167%). The
effect sizes forR2
1are chosen as those observed for WHRadjBMI near STAB1, PPARG or LYPLAL1, respectively. The modeled GxS
are visualized on the left side (red bar:R2
1, blue arrows: varyingR 2
2). For the difference test without filtering, we assume a significance
level at 5 x 10⁻⁸; for approaches with filtering, the filtering threshold is 1 x 10⁻⁵and the significance level applied for the consecutive
difference test isαDiff= M/0.05, with M being the number of filtered lead variants (seeMethods).
Fig 3. Influence of filtering threshold on the power to detect GxS. Shown is the power to detect GxS for the same approaches
as inFig 2(n1= 100,000, n2= 100,000), but here with varying filtering thresholds and fixedR22relative toR 2
For a qualitative GxS (Fig 4A), [Diff5e-8] shows the best power for moderately unbalanced
strata designs (0.2<f<5), whereas½Overall1e 5 !DiffaDiffshows best power for more
extremely unbalanced strata designs (f<0.2 orf>5). Here, power curves for all approaches are symmetric tof= 1, because absolute genetic effects are the same across strata. However, the symmetry of the filtered approaches disappears when varyingR2(S6–S8Figs).
For a pure GxS (Fig 4B) with the effect in the larger stratum (f<1), the filtering approaches
½Overall1e 5!DiffaDiff,½Strat1e 5 ! ½DiffaDiff, and½Joint1e 5 ! ½DiffaDiffhave larger power
than the difference test alone with a maximum power atf~ 0.66 (i.e. ‘effect’ stratum 1 is 1.5-times larger than the ‘no effect’ stratum 2). The best approach here is the overall filtering approach,
½Overall1e 5!DiffaDiff. When the effect is in the smaller stratum (f>1), the difference test
with-out filtering, [Diff5e-8], can provide a power gain over the filtering approaches: For the presented
scenario, the power of [Diff5e-8] surpasses the power of the filtering approaches atf~ 1.5 (‘no
effect’ stratum 2 is 1.5 times larger than the ‘effect’ stratum 1). Generally, when using the filtering approaches, it is easier to identify pure GxS with the effect in the larger stratum (f<1) than with the effect in the smaller stratum (f>1), while the difference test alone does not depend on whether the effect is in the smaller or the larger stratum.
For quantitative GxS (Fig 4C) and for the presented scenario, the power of all approaches is symmetric to and at maximum atf= 1. Irrespective off,½Overall1e 5!DiffaDiffdisplays the
best power to identify quantitative GxS compared to all other considered approaches (Fig 4C,
S6–S8Figs).
Altogether,½Overall1e 5!DiffaDiffis the most powerful approach to detect
pure/quantita-tive GxS, for all stratum designs. It has also the best power to detect effects pointing into oppo-site directions (qualitative difference) when the strata are extremely unbalanced. [Diff5e-8] is
the most powerful approach to detect qualitative GxS, when the sample sizes of the strata do not differ too extremely.
Application to real sex-stratified GWAMA results for waist-hip ratio
We exemplify the impact of our approaches on the number of identifiable sexually dimorphic loci for WHRadjBMI, based on our sex-stratified GWAMA results from the GIANT consor-tium (up to 77,000 men and 98,000 women) [12].
First, in order to derive empirical type I error based on the real GIANT data, we apply all seven approaches to the real sex-stratified meta-analyzed GWAMA results and evaluate lambda factors and QQ plots. For [Diff5e-8] and½OverallaFilter!DiffaDiff, we observe no
infla-tion of difference P-Values (λGC= 1.02 andλGC= 1.06, respectively,S9 Fig). However, we
observe inflated difference P-values for the one-stage approaches½StrataFilter !DiffaDiffand ½JointaFilter !DiffaDiff, (λGC= 6.67 andλGC= 6.39, respectively,S9 Fig). This is in-line with the
statistical theory and our results from simulated data, which support the notion that the strati-fied and the alternative joint tests depend on the difference test, while the overall test appears to be independent.
Next, in order to evaluate the detectability of sexually dimorphic loci for WHRadjBMI, we apply the four approaches [Diff5e-8],½Overall1e 5 !DiffaDiff,½Strat1e 5 ! ½DiffaDiff, and ½Joint1e 5 ! ½DiffaDiffto the real sex-stratified meta-analyzed GWAMA results. When
A. qualitative GxS with small stratum-specific effects (R2
1¼0:014%; R 2
2¼0:014%into opposite direction), B. pure GxS with medium
sized stratum 1 effect (R2
1¼0:058%;R 2
2¼0%), and C. quantitative GxS with large stratum 1 and smaller stratum 2 effect
(R2
1¼0:167%;R 2
2¼0:042%into the same direction). The effect sizes for stratum 1 are chosen as those observed for the
WHRadjBMI loci around STAB1, PPARG, or LYPLAL1. The power of [Diff5e-8] is constant due to the lack of any filtering.
Fig 4. Power of stratified GWAMA approaches to identify GxS for unbalanced strata design. Shown is the power to detect
accounting for the subtle relatedness (r = 0.05 for one-stage, r = 0.03 for stage 2 of the two-stage approaches), we identify a total of 10 independent loci with significant sex-difference across all considered approaches (Table 2,S2 TableandS3 Table). The 10 loci include one qualitative, six pure and three quantitative sex-differences. Consistent with our power compu-tations, the one-stage approaches identify more loci than the two-stage approaches, the quali-tative difference is only detected by [Diff5e-8] and½Overall1e 5!DiffaDiffidentifies all pure
and quantitative differences (nine loci). The overall association test filtering at anαFilterof 5 x
10−8,½Overall5e 8 !DiffaDiff, identifies 8 of these and one additional; this approach is, in fact,
the approach used by Locke and colleagues for BMI [25] and by Shungin and colleagues for WHRadjBMI [5], when only the genome-wide significant loci with main genetic effect are tested for interaction. When applying the two approaches [Diff5e-8] and½Overall1e 5!
DiffaDiffjointly, 10 sexually dimorphic loci for WHRadjBMI are detected in the GIANT data.
When ignoring the subtle relatedness, we detect only 9 loci with significant sex-difference across all considered approaches (the one missed with a sex-difference P-value of 9.1 x 10⁻⁸ instead of 4.1 x 10⁻⁸when accounting for the relatedness).
In summary, our application of the approaches to real sex-stratified GWAMA data for WHRadjBMI corroborates our simulation-based and analytical evaluations of type I error rates and power.
Discussion
Recommendations
Based on our evaluations of type I error and power, we found that two of the approaches to search for genetic effects with GxS based on stratified GWAMA data keep type I error control and are the most powerful: the genome-wide difference test and the overall association filtering prior to the difference test. Which of these two performed better than the other, depended on the type of GxS (qualitative, pure or quantitative) and on the strata design (balanced, unbal-anced). We thus provide a recommendation of the best approach depending on the type of strata-difference and strata design (Fig 5). Generally, for any stratified GWAMA project that aims at detecting genetic variants with GxS without any hypothesis on the specific type of GxS and irrespective of the strata design, we recommend to perform two approaches in parallel: (i) a genome-wide screen for difference testing at anα-level of 5 x 10⁻⁸, and (ii) an approach that filters for overall association atPOverall<10−5and then tests this subset of genetic variants for
difference at a Bonferroni-correctedα-level.
This recommendation is based on several findings of our comparisons: (1) The difference test without filtering, [Diff5e-8], has the best power to detect qualitative GxS in most scenarios
and the overall association test filtering prior to the difference test,½OverallaFilter!DiffaDiff,
has the best power for pure/quantitative GxS with few exceptions. (2) The approaches filtering for stratified or alternative joint association prior to difference testing in the same set of GWAMA results (one-stage approaches½StrataFilter!DiffaDiffand½JointaFilter!DiffaDiff)
vio-late type I error. Since stratified or (alternative) joint association tests are commonly applied for filtering in GWAMA literature [8,12,26,27], it is important to note that testing the selected variants for GxS necessitates an independent set of GWAMA results (two stage approaches
f = n2/n1, with stratum 1 being the one with the larger effect. Effect sizes are chosen as inFig 3(fixedR22relative toR 2 1; R
2 1as
observed for WHRadjBMI loci around STAB1, PPARG, or LYPLAL1): A. qualitative GxS with smallR2 1(R
2
1¼0:014%;R 2
2¼0:014%,
into opposite direction), B. pure GxS with mediumR2 1(R
2
1¼0:058%;R 2
2¼0%), and C. quantitative GxS with largeR 2 1
(R2
1¼0:167%; R 2
2¼0:042%).
½StrataFilter ! ½DiffaDiffand½JointaFilter ! ½DiffaDiff). (3) The two-stage approaches were
outper-formed by at least one one-stage approach. The reason for this is that splitting the data into two artificial stages does not make use of the total sample size neither for the filtering nor for the difference test, which is in-line with previous work[28]. (4) We found that the filtering threshold of the overall association test had a substantial impact on power. Since a less
Table 2. Application to real sex-stratified GWAMA data for WHRadjBMI from the GIANT GENDER project. Shown are the 10 identified loci with GxSex
by each approach (‘x’ indicating that the locus was identified by the respective approach) at a Bonferroni-corrected significance level, based on the GIANT data for WHRadjBMI (up to 77,000 men and 98,000 women) [12]. Detailed association results are provided inS2 Tablefor the one-stage approaches and in
S3 Tablefor the two-stage approaches.
One-stage approaches Two-stage approaches
Locus Type [Diff5e-8] ½½½½Overall1e 5!DiffαDiff ½½½½Strat1e 5 ! ½½½½DiffαDiff ½½½½Joint1e 5 ! ½½½½DiffαDiff
LRRC69 Qualitative x - -
-SLC30A10 Pure x x x x
COBLL1 Pure x x x x
NKX3-1 Pure - x -
-PLXND1 Pure x x -
-PPARG Pure - x -
-TNFAIP8 Pure - x -
-ADAMTS9 Quantitative - x x x
ITPR2 Quantitative - x -
-VEGFA Quantitative x x x x
https://doi.org/10.1371/journal.pone.0181038.t002
Fig 5. Recommended stratified GWAMA approaches to detect GxS. Shown are the recommended approaches to detect GxS when there is no prior
hypothesis on the type of GxS (H0: No GxS) and when there is a prior hypothesis on the type of GxS (H0: No qualitative GxS; or H0: No pure GxS; or H0: No
quantitative GxS). The recommendations vary on the degree to which the strata sample sizes differ (f being the proportion of stratum 2 sample size over
stringent filtering (largerαFilter, more variants selected) yielded larger power to detect pure GxS, while more stringent filtering (smaller alpha, fewer variants selected) yielded larger power for quantitative GxS, a compromise is required. We found a filtering threshold ofPOverall<10−5to
work well in most scenarios.
Several aspects are interesting to note: No matter what filtering approach is used, it is easier to identify GxS with the larger effect in the larger stratum as compared to a GxS with the larger effect is in the smaller stratum. For example, a filtering approach can be expected to detect more variants with the predominant effect in non-smokers rather than in smokers (assuming more non-smokers in the data and same number of genetic effects specific to non-smokers compared to smokers). The genome-wide difference screen has no preference towards an effect in the larger or in the smaller stratum, but it loses power with increasing imbalance of strata.
It should also be noted that the commonly used GWAMA approach to screen for genome-wide significant overall association (POverall<5 x 10⁻⁸) and to subsequently test identified lead
variants for difference between strata performs well to find pure and quantitative difference. The question here remains, whether many genetic effects with opposite effect direction in the two strata exist (qualitative GxS) that are missed by such an approach or whether such effects are biologically plausible. Without the utilization of approaches with sufficient power to detect qualitative GxS, this question will be left unanswered.
Strengths and limitations
We focused here on approaches to identify GxS that are directly applicable to stratified GWA-MAs results. We assumed a dichotomous stratification variable and continuous outcome that follow identical normal distributions. To our knowledge, this is the first study to evaluate such approaches systematically and to provide recommendations on how to design a GWAMA that aims to identify genetic variants with between-strata differences.
Despite the fact that our work is comprehensive and covers numerous approaches and sce-narios, there are still scenarios that we have not considered in order to stay focused. This includes binary outcomes, different phenotypic variances between strata, between-study differ-ences of the genetic effect, or a measurement error in the phenotype that differs between studies and strata. Still, our results can readily be translated into stratified GWAMAs of binary out-comes using logistic regression and different phenotypic variances can be implemented by extending the power formulae. Between-study heterogeneity of genetic effects and measure-ment error issues will be important extensions, but are widely ignored in the current GWAMA approaches to locus identification.
The stratified GWAMA approaches can be translated into interaction GWAMA
the much easier logistics of computing stratum-specific GWAS and the meta-analysis of stra-tum-specific genetic effects compared to interaction modeling in GWAS and the respective meta-analysis.
We did not consider GxE interaction methods that are based on linearly increasing pheno-typic variance [29], meta-regression of summary statistics [30], or on case-only [31], data adaptive [32,33], empirical Bayes [34] or other 2-step methods that involve filtering on gene-exposure or gene-strata association [35–38]. The latter rely on the assumption of indepen-dence of implemented steps [39] and any methods that involve case-only designs or empirical Bayes methods are limited to binary disease outcome. The reason for not extending our con-siderations to the noted methods was that they either involve data sets that are not directly available from the stratified GWAMA or that they were only described for single genome-wide interaction studies rather than meta-analysis settings or for binary outcomes. Their implemen-tation and transferability into a stratified GWAMA setting with continuous outcome may be limited and are as yet unclear.
Finally, by reducing the filtered variants to the independent lead variants (e.g. variant with smallest filtering test P-value within +/- 500kB), we might miss the correlated variant close-by that is the truly interesting variant with between-stratum difference (i.e. the variant with the smallest difference test P-value). We could extend to approaches that select all variants meeting the filtering threshold without restricting to lead variants in this step, subsequently testing all selected variants for difference and alternative approaches for multiple testing that can handle correlated variants, such as employing a Bonferroni-correction based on the effective number of independent variants [23,40] or a false-discovery rate approach [41].
Summary and conclusion
In summary, we recommend the genome-wide difference test without filtering, [Diff5e-8], to
search for genetic effects that point into opposite direction in two strata and the overall associ-ation test filtering prior to a difference test,½OverallaFilter!DiffaDiff, to detect genetic effects
that are only or more pronounced in one stratum. When there is no hypothesis on the type of GxS that is aimed to identify, we recommend applying these two approaches in parallel. For the overall association test filtering, a filtering threshold of 1 x 10⁻⁵appears to be reasonable, while a filtering threshold of 5 x 10⁻⁸is equivalent to the common GWAMA approach to iden-tify variants with genome-wide significance and test only these variants for GxS.
Our results provide guidelines for current and future GWAMAs that aim at the identifica-tion of genetic effects with GxS. By these clear recommendaidentifica-tions, researchers will be more moti-vated to search for GxS and by enhancing our searches with the most powerful approaches we will be able to unravel GxS for complex disease. Ultimately, our knowledge of genetic effects that show differential effects between strata will help our understanding of how a variant exerts its effect on the disease outcome under study.
Supporting information
S1 Methods. Defining lead variants and the number of independent loci filtered.
(DOCX)
S2 Methods. Details on the simulation-based evaluation of type I error.
(DOCX)
S3 Methods. Derivation of analytical power formulae for the considered statistical tests and approaches.
S4 Methods. Details on the considered scenarios of analytical power computations.
(DOCX)
S1 Note. Effect of differences in allele frequency between strata.
(DOCX)
S2 Note. Comparison of stratified and interaction GWAMA frameworks.
(DOCX)
S3 Note. GIANT consortium authors.
(DOCX)
S1 Table. Statistical tests for stratified GWAMA approaches to identify GxS. Stated are the
tests that can be applied based on the meta-analyzed stratum-specific genetic effect estimates,
^
bi, and standard errors, sei(i = 1,2), the respective null hypotheses, test statistics, nomenclature
for P-values and the usage. (DOCX)
S2 Table. Ten loci with significant sex-difference for WHRadjBMI identified by the one-stage approaches. The table shows the lead variants identified by the two one-one-stage
approaches [Diff5e-8] and½Overall1e 5 !DiffaDiffthat were applied to the sex-stratified
GWAMA results for WHRadjBMI (up to 77,000 men and 98,000 women) from the GIANT consortium [12]. Significant sex-difference P-Values (corrected for correlation between strata using r = 0.05 as estimated from the GIANT data on 77,000 men and 98,000 women) are marked in bold. Sex-difference P-Values (uncorrected for correlation) were added to the table for comparison.
(DOCX)
S3 Table. Four loci with significant sex-difference for WHRadjBMI identified by the two-stage approaches. The table shows the lead variants identified by the two-two-stage approaches ½Strat1e 5 ! ½DiffaDiffand½Joint1e 5 ! ½DiffaDiffthat were applied to the sex-stratified
GWAMA results for WHRadjBMI (up to 35,000 and 42,000 men; and up to 43,000 and 55,000 women in the two stages respectively; from the GIANT consortium [12]. Significant stage 2 sex-difference P-Values (corrected for correlation between strata using r = 0.03 as estimated from the Stage 2 GIANT data on 42,000 men and 55,000 women) are marked in bold. Stage 2 sex-difference P-Values (uncorrected for correlation) were added to the table for comparison. (DOCX)
S4 Table. Statistical tests for interaction GWAMA approaches to identify GxS. Instead of
applying two stratified linear regression models per study and meta-analyzing stratified genetic estimates, an interaction GWAMA framework involves one interaction model per study,
Y ¼ /ikþbGikGikþbSikSikþbGxSikGikxSikþE
ðjÞ
ik, where S codes strata membership (i.e. S = 0
for stratum 1, S = 1 for stratum 2). Meta-analyzed genetic main effects (b^G) and gene-strata
interaction effects (b^GxS) with corresponding standard errors (seGandseGxS) are obtained from
study-specific genetic main effects (b^Gik) or gene-strata interaction (
^
bGxSik) effects, respectively.
Stated are the tests that can be applied based on the interaction GWAMA framework, the respective null hypotheses, test statistics, nomenclature for P-values and the usage. (DOCX)
S1 Fig. Seven stratified GWAMA approaches to identify GxS. The figure visualizes the
can either be conducted as one-stage or as two-stage approaches. For the one-stage approaches, the filtering and the difference test are applied to one large stratified GWAMA result of total sample sizeN(blue). For the two-stage approaches, the filtering and the differ-ence test are applied consecutively to two independent stratified GWAMA results of sizeN/2
(purple and orange). (TIF)
S2 Fig. Simulation-based evaluation of type 1 error for one-stage approaches assuming bal-anced strata. Shown are the difference P-values simulated under the null hypotheses of no
GxS given no stratum-specific effects (Hb¼0
0 ) or of no GxS given identical stratum-specific
effects (Hb6¼0
0 ) for the one-stage approaches½DiffaDiff,½OverallaFilter !DiffaDiff,½StrataFilter!
DiffaDiffand½JointaFilter!DiffaDiff. The QQ plots are based on simulated phenotypes and
sim-ulated genotypes to reflect A)Hb¼0
0 withMAF= 0.05, B)H
b¼0
0 withMAF= 0.30, C)H
b6¼0 0 with MAF= 0.05, and D)Hb6¼0
0 withMAF= 0.30. We here assumeαFilter= 0.05 forH
b¼0
0 andαFilter=
10−5forHb6¼0
0 and two equally sized (balanced) strata (100,000 individuals in each stratum, f= 1).
(TIF)
S3 Fig. Simulation-based evaluation of type 1 error for two-stage approaches assuming bal-anced strata. Shown are the simulated difference P-values for the two-stage approaches ½OverallaFilter ! ½DiffaDiff,½StrataFilter ! ½DiffaDiffand½JointaFilter ! ½DiffaDiff. We here assume
two equally sized (balanced) strata (50,000 individuals in each stratum and stage,f= 1). Results are presented for varying MAF and null hypotheses as inS2 Fig.
(TIF)
S4 Fig. Simulation-based evaluation of type 1 error for one-stage approaches assuming unbalanced strata. Shown are simulated difference P-values for the one-stage approaches ½DiffaDiff,½OverallaFilter!DiffaDiff,½StrataFilter!DiffaDiffand½JointaFilter!DiffaDiff. We here
assume two unbalanced strata (66,000 and 134,000 individuals in the two strata, respectively,
f= 0.33 andf= 3). Results are presented for varying MAF and null hypotheses as inS2 Fig. (TIF)
S5 Fig. Simulation-based QQ-plots for two-stage approaches and unbalanced strata designs.
Shown are simulated difference P-values for the two-stage approaches½OverallaFilter ! ½DiffaDiff, ½StrataFilter ! ½DiffaDiffand½JointaFilter ! ½DiffaDiff. We here assume two unbalanced sized strata
(33,000 and 67,000 individuals in the two strata and in each stage,f= 0.33 andf= 3). Results are presented for varying MAF and null hypotheses as inS2 Fig.
(TIF)
S6 Fig. Power of stratified GWAMA approaches to identify GxS assuming unbalanced strata and a small effect in stratum 1. Shown is the power to detect GxS for the same
approaches and designs as inFig 3(unbalanced strata designs with varying proportion of stra-tum sample sizes, f = n2/n1, with stratum 1 being the one with the larger effect). Effect size in
stratum 1 is fixed toR2
1 ¼0:014%, as observed for the small WHRadjBMI effect atSTAB1.
The effect in stratum 2 is fixed to A. 0.014%, into opposite direction (qualitative GxS; same as mainFig 3A), B.R2
2¼0:007%, into opposite direction (qualitative GxS), C.R 2
2¼0:003%,
into opposite direction (qualitative GxS). D.R2
2¼0%(pure GxS), E.R 2
2 ¼0:003%, into
con-sistent direction (quantitative GxS), and F.R2
2¼0:007%, into consistent direction
S7 Fig. Power of the stratified GWAMA approaches to identify GxS assuming unbalanced strata design and a medium effect in stratum 1. Shown is the power to detect GxS for the
same approaches and designs as inFig 3(unbalanced strata designs with varying proportion of stratum sample sizes, f = n2/n1, with stratum 1 being the one with the larger effect). Effect
size in stratum 1 is fixed toR2
1 ¼0:058%, as observed for the medium WHRadjBMI effect at PPARG. The effect in stratum 2 is fixed to A. 0.058%, into opposite direction (qualitative GxS), B.R2
2¼0:029%, into opposite direction (qualitative GxS), C.R 2
2¼0:014%, into opposite
direction (qualitative GxS). D.R2
2¼0%(pure GxS; same as mainFig 3B), E.R 2
2¼0:014%,
into consistent direction (quantitative GxS), and F.R2
2 ¼0:029%, into consistent direction
(quantitative GxS). (TIF)
S8 Fig. Power of the stratified GWAMA approaches to identify GxS assuming unbalanced strata design and a large effect in stratum 1. Shown is the power to detect GxS for the same
approaches and designs as inFig 3(unbalanced strata designs with varying proportion of stra-tum sample sizes, f = n2/n1, with stratum 1 being the one with the larger effect). Effect size in
stratum 1 is fixed toR2
1 ¼0:0:167%, as observed for the large WHRadjBMI effect atLYPLAL1.
The effect in stratum 2 is fixed to A. 0.167%, into opposite direction (qualitative GxS), B.
R2
2 ¼0:084%, into opposite direction (qualitative GxS), C.R 2
2 ¼0:042%, into opposite
direc-tion (qualitative GxS). D.R2
2¼0%(pure GxS), E.R 2
2 ¼0:042%, into consistent direction
(quantitative GxS, same as mainFig 3C), and F.R2
2¼0:084%, into consistent direction
(quantitative GxS). (TIF)
S9 Fig. QQ plots showing the results of the application of one-stage approaches to sex-stratified GWAMA from the GIANT consortium. The QQ plot contrasts observed and
expected difference P-Values for the considered 1-stage approaches½DiffaDiff,½Overall0:05!
DiffaDiff,½Strat0:05!DiffaDiffand½Joint0:05!DiffaDiffobtained from an application of
approaches to real sex-stratified GWAMA data for WHRadjBMI from the GIANT consor-tium.
(TIF)
Acknowledgments
I.M.H. received funding from the Bundesministerium fu¨r Bildung und Forschung (BMBF
01ER1206, 01ER1507) and from the National Institutes of Health (NIH R01DK075787). T.W. W. received travel grants to present results of this project on international conferences from the Deutscher Akademischer Austauschdienst (DAAD travel grants 2013, and 2015). Z.K. received financial support from the Leenaards Foundation, the Swiss Institute of Bioinformat-ics and the Swiss National Science Foundation (31003A-143914 and 31003A_169929) and Sys-temsX.ch (51RTP0_151019). The computational resources were provided by the University of Regensburg.
Author Contributions
Conceptualization: Thomas W. Winkler, Iris M. Heid.
Data curation: Thomas W. Winkler, Anne E. Justice, Zolta´n Kutalik.
Funding acquisition: Zolta´n Kutalik, Iris M. Heid.
Investigation: Thomas W. Winkler.
Methodology: Thomas W. Winkler, Zolta´n Kutalik, Iris M. Heid.
Project administration: Thomas W. Winkler, Iris M. Heid.
Resources: Thomas W. Winkler, Iris M. Heid.
Software: Thomas W. Winkler, Zolta´n Kutalik.
Supervision: Florian Kronenberg, Zolta´n Kutalik, Iris M. Heid.
Validation: Thomas W. Winkler, Zolta´n Kutalik, Iris M. Heid.
Visualization: Thomas W. Winkler, Anne E. Justice, L. Adrienne Cupples, Florian
Kronen-berg, Zolta´n Kutalik, Iris M. Heid.
Writing – original draft: Thomas W. Winkler, Zolta´n Kutalik, Iris M. Heid.
Writing – review & editing: Thomas W. Winkler, Anne E. Justice, L. Adrienne Cupples,
Flor-ian Kronenberg, Zolta´n Kutalik, Iris M. Heid.
References
1. Welter D, MacArthur J, Morales J, Burdett T, Hall P, et al. (2014) The NHGRI GWAS Catalog, a curated resource of SNP-trait associations. Nucleic Acids Res 42: D1001–1006.https://doi.org/10.1093/nar/ gkt1229PMID:24316577
2. Winkler TW, Day FR, Croteau-Chonka DC, Wood AR, Locke AE, et al. (2014) Quality control and con-duct of genome-wide association meta-analyses. Nat Protoc 9: 1192–1212.https://doi.org/10.1038/ nprot.2014.071PMID:24762786
3. Hutter CM, Mechanic LE, Chatterjee N, Kraft P, Gillanders EM, et al. (2013) Gene-environment interac-tions in cancer epidemiology: a National Cancer Institute Think Tank report. Genet Epidemiol 37: 643– 657.https://doi.org/10.1002/gepi.21756PMID:24123198
4. Pattaro C, Teumer A, Gorski M, Chu AY, Li M, et al. (2016) Genetic associations at 53 loci highlight cell types and biological pathways relevant for kidney function. Nat Commun 7: 10023.https://doi.org/10. 1038/ncomms10023PMID:26831199
5. Shungin D, Winkler TW, Croteau-Chonka DC, Ferreira T, Locke AE, et al. (2015) New genetic loci link adipose and insulin biology to body fat distribution. Nature 518: 187–196.https://doi.org/10.1038/ nature14132PMID:25673412
6. Scott RA, Chu AY, Grarup N, Manning AK, Hivert MF, et al. (2012) No interactions between previously associated 2-hour glucose gene variants and physical activity or BMI on 2-hour glucose levels. Diabetes 61: 1291–1296.https://doi.org/10.2337/db11-0973PMID:22415877
7. Heid IM, Jackson AU, Randall JC, Winkler TW, Qi L, et al. (2010) Meta-analysis identifies 13 new loci associated with waist-hip ratio and reveals sexual dimorphism in the genetic basis of fat distribution. Nat Genet 42: 949–960.https://doi.org/10.1038/ng.685PMID:20935629
8. Manning AK, Hivert MF, Scott RA, Grimsby JL, Bouatia-Naji N, et al. (2012) A genome-wide approach accounting for body mass index identifies genetic variants influencing fasting glycemic traits and insulin resistance. Nat Genet 44: 659–669.https://doi.org/10.1038/ng.2274PMID:22581228
9. Keller MC (2014) Gene x environment interaction studies have not properly controlled for potential con-founders: the problem and the (simple) solution. Biol Psychiatry 75: 18–24.https://doi.org/10.1016/j. biopsych.2013.09.006PMID:24135711
10. Speliotes EK, Willer CJ, Berndt SI, Monda KL, Thorleifsson G, et al. (2010) Association analyses of 249,796 individuals reveal 18 new loci associated with body mass index. Nat Genet 42: 937–948. https://doi.org/10.1038/ng.686PMID:20935630
11. Cox DR, Hinkley DV (1979) Theoretical statistics. London New York: Chapman and Hall; distributed in U.S. by Halsted Press. xii, 511 p. p.
13. Aschard H, Hancock DB, London SJ, Kraft P (2010) Genome-wide meta-analysis of joint tests for genetic and gene-environment interaction effects. Hum Hered 70: 292–300.https://doi.org/10.1159/ 000323318PMID:21293137
14. Winkler TW, Justice AE, Graff M, Barata L, Feitosa MF, et al. (2015) The Influence of Age and Sex on Genetic Associations with Adult Body Size and Shape: A Large-Scale Genome-Wide Interaction Study. PLoS Genet 11: e1005378.https://doi.org/10.1371/journal.pgen.1005378PMID:26426971
15. Taylor KC, Carty CL, Dumitrescu L, Buzkova P, Cole SA, et al. (2013) Investigation of gene-by-sex interactions for lipid traits in diverse populations from the population architecture using genomics and epidemiology study. BMC Genet 14: 33.https://doi.org/10.1186/1471-2156-14-33PMID:23634756
16. Willer CJ, Li Y, Abecasis GR (2010) METAL: fast and efficient meta-analysis of genomewide associa-tion scans. Bioinformatics 26: 2190–2191.https://doi.org/10.1093/bioinformatics/btq340PMID: 20616382
17. de Bakker PI, Ferreira MA, Jia X, Neale BM, Raychaudhuri S, et al. (2008) Practical aspects of imputa-tion-driven meta-analysis of genome-wide association studies. Hum Mol Genet 17: R122–128.https:// doi.org/10.1093/hmg/ddn288PMID:18852200
18. Behrens G, Winkler TW, Gorski M, Leitzmann MF, Heid IM (2011) To stratify or not to stratify: power considerations for population-based genome-wide association studies of quantitative traits. Genet Epi-demiol 35: 867–879.https://doi.org/10.1002/gepi.20637PMID:22125224
19. Sung YJ, Schwander K, Arnett DK, Kardia SL, Rankinen T, et al. (2014) An empirical comparison of meta-analysis and mega-analysis of individual participant data for identifying gene-environment interac-tions. Genet Epidemiol 38: 369–378.https://doi.org/10.1002/gepi.21800PMID:24719363
20. Johnson RC, Nelson GW, Troyer JL, Lautenberger JA, Kessing BD, et al. (2010) Accounting for multiple comparisons in a genome-wide association study (GWAS). BMC Genomics 11: 724.https://doi.org/10. 1186/1471-2164-11-724PMID:21176216
21. Kang HM, Sul JH, Service SK, Zaitlen NA, Kong SY, et al. (2010) Variance component model to account for sample structure in genome-wide association studies. Nat Genet 42: 348–354.https://doi.org/10. 1038/ng.548PMID:20208533
22. Lin DY, Sullivan PF (2009) Meta-analysis of genome-wide association studies with overlapping sub-jects. Am J Hum Genet 85: 862–872.https://doi.org/10.1016/j.ajhg.2009.11.001PMID:20004761
23. Gao X, Starmer J, Martin ER (2008) A multiple testing correction method for genetic association studies using correlated single nucleotide polymorphisms. Genet Epidemiol 32: 361–369.https://doi.org/10. 1002/gepi.20310PMID:18271029
24. Devlin B, Roeder K (1999) Genomic control for association studies. Biometrics 55: 997–1004. PMID: 11315092
25. Locke AE, Kahali B, Berndt SI, Justice AE, Pers TH, et al. (2015) Genetic studies of body mass index yield new insights for obesity biology. Nature 518: 197–206.https://doi.org/10.1038/nature14177 PMID:25673413
26. Hancock DB, Soler Artigas M, Gharib SA, Henry A, Manichaikul A, et al. (2012) Genome-wide joint meta-analysis of SNP and SNP-by-smoking interaction identifies novel loci for pulmonary function. PLoS Genet 8: e1003098.https://doi.org/10.1371/journal.pgen.1003098PMID:23284291
27. Schoeps A, Rudolph A, Seibold P, Dunning AM, Milne RL, et al. (2014) Identification of new genetic sus-ceptibility loci for breast cancer through consideration of gene-environment interactions. Genet Epide-miol 38: 84–93.https://doi.org/10.1002/gepi.21771PMID:24248812
28. Skol AD, Scott LJ, Abecasis GR, Boehnke M (2006) Joint analysis is more efficient than replication-based analysis for two-stage genome-wide association studies. Nat Genet 38: 209–213.https://doi. org/10.1038/ng1706PMID:16415888
29. Yang J, Loos RJ, Powell JE, Medland SE, Speliotes EK, et al. (2012) FTO genotype is associated with phenotypic variability of body mass index. Nature 490: 267–272.https://doi.org/10.1038/nature11401 PMID:22982992
30. Li S, Mukherjee B, Taylor JM, Rice KM, Wen X, et al. (2014) The role of environmental heterogeneity in meta-analysis of gene-environment interactions with quantitative traits. Genet Epidemiol 38: 416–429. https://doi.org/10.1002/gepi.21810PMID:24801060
31. Piegorsch WW, Weinberg CR, Taylor JA (1994) Non-hierarchical logistic models and case-only designs for assessing susceptibility in population-based case-control studies. Stat Med 13: 153–162. PMID: 8122051
33. Mukherjee B, Ahn J, Gruber SB, Rennert G, Moreno V, et al. (2008) Tests for gene-environment inter-action from case-control data: a novel study of type I error, power and designs. Genet Epidemiol 32: 615–626.https://doi.org/10.1002/gepi.20337PMID:18473390
34. Mukherjee B, Ahn J, Gruber SB, Ghosh M, Chatterjee N (2010) Case-control studies of gene-environ-ment interaction: Bayesian design and analysis. Biometrics 66: 934–948.https://doi.org/10.1111/j. 1541-0420.2009.01357.xPMID:19930190
35. Murcray CE, Lewinger JP, Gauderman WJ (2009) Gene-environment interaction in genome-wide asso-ciation studies. Am J Epidemiol 169: 219–226.https://doi.org/10.1093/aje/kwn353PMID:19022827
36. Murcray CE, Lewinger JP, Conti DV, Thomas DC, Gauderman WJ (2011) Sample size requirements to detect gene-environment interactions in genome-wide association studies. Genet Epidemiol 35: 201– 210.https://doi.org/10.1002/gepi.20569PMID:21308767
37. Hsu L, Jiao S, Dai JY, Hutter C, Peters U, et al. (2012) Powerful cocktail methods for detecting genome-wide gene-environment interaction. Genet Epidemiol 36: 183–194.https://doi.org/10.1002/gepi.21610 PMID:22714933
38. Gauderman WJ, Zhang P, Morrison JL, Lewinger JP (2013) Finding novel genes by testing G x E inter-actions in a genome-wide association study. Genet Epidemiol 37: 603–613.https://doi.org/10.1002/ gepi.21748PMID:23873611
39. Dai JY, Kooperberg C, Leblanc M, Prentice RL (2012) Two-stage testing procedures with independent filtering for genome-wide gene-environment interaction. Biometrika 99: 929–944.https://doi.org/10. 1093/biomet/ass044PMID:23843674
40. Gao X, Becker LC, Becker DM, Starmer JD, Province MA (2010) Avoiding the high Bonferroni penalty in genome-wide association studies. Genet Epidemiol 34: 100–105.https://doi.org/10.1002/gepi.20430 PMID:19434714