Risk factors for delayed antiretroviral therapy
initiation among HIV-seropositive patients
Terra V. Fatukasi1
*, Stephen R. Cole1, Richard D. Moore2, William C. Mathews3, Jessie
K. Edwards1, Joseph J. Eron4, for the CNICS investigators
1 Department of Epidemiology, University of North Carolina at Chapel Hill, Chapel Hill, North Carolina, United
States of America, 2 School of Medicine, Johns Hopkins University, Baltimore, Maryland, United States of America, 3 School of Medicine, University of California San Diego, San Diego, California, United States of America, 4 Department of Medicine, Division of Infectious Diseases, University of North Carolina at Chapel Hill, Chapel Hill, North Carolina, United States of America
¶ Membership of the CNICS investigators is provided in the Acknowledgments. *[email protected]
Abstract
Prompt initiation of combination antiretroviral therapy (ART) is important to reduce comorbid-ity and mortalcomorbid-ity among people living with HIV, especially for those with a low CD4 cell count. However there is evidence that not everyone receives prompt initiation of ART after enrolling into HIV care. The current study investigated factors associated with failure to initiate ART within two years of entering into care among those with a CD4 count at or below 350 cells/ mm3. The sample included 4,907 ART-naive patients with a CD4 count at or below 350 cells/ mm3enrolled between January 1, 2003 and December 31, 2012 at any of eight clinical sites in the Center for AIDS Research Network of Integrated Clinical Systems (CNICS). The two-year risk of delayed ART initiation was estimated using a log-binomial regression model with stabilized inverse probability of censoring weights for those lost to follow-up. Adjusting for other factors, an earlier enrollment date was the sole demographic characteristic associated with an increased risk of delayed ART initiation. Higher CD4 count, lower viral load, and a prevalent AIDS diagnosis were clinical characteristics associated with delayed ART initiation. Gender, age, race/ethnicity and HIV risk factors such as reported male-to-male sexual con-tact and injection drug use were not associated with delayed ART initiation. This study identi-fied characteristics of patients for whom treatment was strongly to moderately recommended but who did not initiate ART within two years of entering care. Despite the known benefits of early antiretroviral therapy initiation, a lower viral load measurement may continue to be an important clinical characteristic in the more recent era with current ART initiation guidelines. These findings provide a target for closer monitoring and intervention to reduce disparities in HIV care.
Introduction
Despite the introduction of effective combination antiretroviral therapy (ART) for HIV in 1996 [1], HIV continues to be a global health crisis. For example, in 2014, the United States
a1111111111 a1111111111 a1111111111 a1111111111 a1111111111
OPEN ACCESS
Citation: Fatukasi TV, Cole SR, Moore RD, Mathews WC, Edwards JK, Eron JJ, et al. (2017) Risk factors for delayed antiretroviral therapy initiation among HIV-seropositive patients. PLoS ONE 12(7): e0180843.https://doi.org/10.1371/ journal.pone.0180843
Editor: Dimitrios Paraskevis, National and Kapodistrian University of Athens, GREECE
Received: January 19, 2017
Accepted: June 22, 2017
Published: July 10, 2017
Copyright:©2017 Fatukasi et al. This is an open access article distributed under the terms of the
Creative Commons Attribution License, which permits unrestricted use, distribution, and reproduction in any medium, provided the original author and source are credited.
Data Availability Statement: Data are available from the Center for AIDS Research Network of Integrated Clinical Systems (CNICS) Institutional Data Access / Ethics Committee for researchers who meet the criteria for access to confidential data. Readers may contact study staff at CNICS, including the Administrative Director, Donna C. Porter ([email protected]) to submit a data request.
Centers for Disease Control and Prevention (CDC) estimated 1.2 million US persons living with HIV and 12,333 AIDS-related deaths [2]. The use of ART has led to an increase in life expectancy among HIV-seropositive individuals through a reduction in HIV-associated comorbidity, as well as non-HIV and non-AIDS comorbidities [3–6]. The difference in life expectancy between HIV-seropositive and HIV-seronegative individuals is shrinking, though specific populations still exhibit notable differences [3,6]. For example, among HIV-seroposi-tive patients on ART, those with a history of injection drug use, a lower baseline CD4 count, and who are non-white have lower life expectancies relative to other groups [3,6]
The current guidelines provided by the US Department of Health and Human Services (DHHS) recommend that ART be provided to all HIV-seropositive individuals to reduce dis-ease progression and prevent HIV transmission [5]. While several studies have assessed char-acteristics associated with a faster time to ART initiation using time-to event analyses, we know of no other studies assessing the proportion of patients promptly initiating ART and their characteristics, especially among those for whom treatment was strongly to moderately recommended [7–10]. Some characteristics associated with a slower time to ART initiation include black non-Hispanic race/ethnicity, injection drug use, a greater number of psychoso-cial barriers, female gender, reporting male-to-male sexual contact, lack of health insurance, higher CD4 count, and lack of comorbidity [7–10]. A prior study among participants in the HIV Outpatient Study found that 20% of HIV-seropositive patients did not initiate ART within a 13.5-year study period from 2000–2013 [10]. Evidence from other countries looking at the proportion of patients initiating ART and their characteristics also suggests that not all HIV-seropositive individuals obtain prompt initiation of ART, even among those who have entered care [11,12]. It is unclear whether these same characteristics associated with a faster time to ART initiation among all HIV-seropositive patients are consistent characteristics of delayed ART initiation among those recommended for treatment. Pinpointing characteristics of those patients indicated for ART initiation, but who have not initiated ART, is especially rel-evant given current clinical guidelines that recommend treatment for all HIV-seropositive patients. A prior study using a clinic-based cohort in Uganda found that 18% of HIV-seroposi-tive patients did not initiate ART within one year of their ART eligibility [12]. While younger age, male sex, higher CD4 count, no formal education, and being employed have been impli-cated as predictors of delay, there is not yet consensus about risk factors for delayed ART initi-ation [5,9–12].
Here we report the proportion of HIV-seropositive patients with a CD4 count at or below 350 cells/mm3who do not start ART within two years of entry to care during the study period between 2003 and 2012, using data from the Centers for AIDS Research Network of Integrated Clinical Systems (CNICS). Though HIV/AIDS clinical guidelines did not recommend ART initiation for all HIV-seropositive patients during this study period, treatment for individuals with a CD4 count at or below 350 cells/mm3shifted from a moderate to strong recommenda-tion over this time period [13,14]. We further compare characteristics at care entry of HIV-seropositive patients who had initiation delayed to those who did initiate ART within two years of care entry. We hypothesized that characteristics associated with lack of adherence to ART, such as younger age and a history of injection drug use, would be associated with delay of ART initiation among those with a strong to moderate recommendation for treatment.
Materials and methods
Study sample
CNICS is designed to support population-based HIV research through a comprehensive, stan-dardized clinical data repository from point-of-care electronic medical records. CNICS
Infectious Diseases of the National Institutes of Health under award number R01AI100654 (https:// www.niaid.nih.gov/). The funder had no role in study design, data collection and analysis, decision to publish, or preparation of the manuscript.
includes clinical data from over 30,000 HIV-seropositive adults, aged 18 years and older, who initiated primary care after January 1, 1995 at any of eight CNICS sites in the US. These sites include Case Western Reserve University, Fenway Community Health Center of Harvard Uni-versity, Johns Hopkins UniUni-versity, University of Alabama at Birmingham, University of Cali-fornia at San Diego, University of CaliCali-fornia at San Francisco, University of North Carolina, and University of Washington. Institutional review boards at each site approved study partici-pation. Participants provided written informed consent or a waiver of informed consent to use clinical and administrative data, as approved by the local institutional review board. CNICS maintains data on patient demographics, disease diagnoses, laboratory data, medication data, health care utilization, vital status, patient reported outcomes, and antiretroviral drug resis-tance. Historical data on patients’ prior ART and diagnosis history are collected at the time of enrollment, which is at the time of their second clinic visit. Mortality is confirmed from clinic sources, death certificates, and the US Social Security Death Index, which is regularly checked by CNICS sites. Follow-up data are acquired at clinic visits, which are approximately every three months on average.
In this prospective cohort study, the analysis was restricted to HIV-seropositive patients with a baseline CD4 count at or below 350 cells/mm3, enrolled in CNICS between January 1, 2003 and December 31, 2012, and who had not initiated ART prior to their CNICS enrollment. Overall, 6,083 patients met these study eligibility criteria. There were 861 patients (14%) excluded due to missing data at baseline including missing HIV-1 RNA viral load (n = 147, 2%), race/ethnicity (n = 588, 10%), and HIV risk factors such as reported injection drug use (n = 155, 3%), and reported male-to-male sexual contact (n = 125, 2%). Patients with a viral load measurement of less than 75 copies/mL indicative of suppressed or undetectable viral load (n = 315, 5%) were excluded because many of these patients may have been misclassified as ART-naïve. Patient characteristics among those excluded followed a similar distribution to those included in the final study sample. This resulted in a final study sample of 4,907 patients.
Outcome definition
The primary outcome, delayed ART initiation, was defined as failure to initiate a regimen of three or more antiretroviral drugs within the first two years of CNICS enrollment. The date of ART initiation was determined to be the first day in which each patient was prescribed three or more antiretroviral drugs.
Patient characteristics
The following factors were assessed as predictors of delayed ART initiation: age (18–29, 30–34, 35–39, 40–44, 45–49, and 50–93 years), gender (male/female), race/ethnicity (white non-His-panic, black non-Hisnon-His-panic, other non-Hisnon-His-panic, and Hispanic), enrollment date (in years), HIV transmission risk factor of injection drug use (yes/no) and male-to-male sexual contact (yes/no), AIDS diagnosis (yes/no), HIV-1 RNA viral load (75–9,999, 10,000–99,999, and 100,000–1.6x10⁶copies/mL), and CD4 cell count (0–199 and 200–350 cells/mm3). Age, injec-tion drug use, male-to-male sexual contact, calendar year, and AIDS diagnosis were defined at study enrollment. HIV-1 RNA viral load and CD4 cell count were defined as the most recent lab measurement recorded within 90 days prior to 30 days after study enrollment.
Statistical analysis
Stabilized inverse probability of censoring weights were constructed using two logistic regres-sion models. The first model estimated the unconditional probability of being censored and the second model estimated the probability of being censored conditional on all measured fac-tors. The final weight was the marginal probability of remaining under follow-up divided by the patient’s conditional probability of remaining under follow-up. The stabilized inverse probability of censoring weights had a mean of 1.00 and ranged from 0.95 to 1.52. A weighted log-binomial model was used to estimate crude and multivariable-adjusted risk ratios (RR) comparing delayed ART initiation within two years between patients with and without each risk factor. Confidence intervals were based on the robust variance estimator. Deaths within the two-year ART initiation period were classified based on whether patients did or did not initiate ART before their occurrence of death. Patients initiating ART prior to being lost to fol-low up within the two-year ART initiation period were classified as initiating ART. The final contrast compares those who fail to initiate ART to those who initiate ART within the two-year period, with patients lost to follow up prior to initiating ART contributing to the weighted model through inverse probability of censoring weights. In multivariable analyses, the RR and 95% CIs were estimated for each factor while adjusting for all other factors.
We categorized age, CD4 cell count, and viral load to relax linearity assumptions. Previous DHHS guidelines suggest that these categories for CD4 cell count and viral load are appropri-ate cut points for clinical decisions regarding the initiation of therapy among ART-naïve patients [13,14]. We assessed potential differences by calendar time in the association between risk factors and delayed ART initiation through examination of stratified results by two enroll-ment date periods. We conducted two sensitivity analyses comparing results with the exclusion of decedents over the two-year risk period and then further adjusting for both clinic site and the number of clinic visits. Data analyses were performed using SAS software version 9.3 (SAS Institute, Inc., Cary, NC).
Results
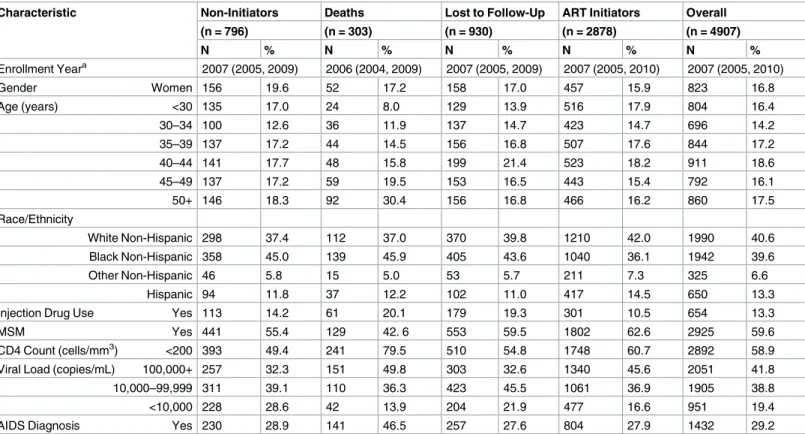
The distribution of demographic characteristics for the sample at CNICS enrollment is dis-played inTable 1. The majority of patients were men (83%; n = 4,084) and the prevalence of male-to-male sexual contact was 60% (n = 2,925). Thirteen percent (n = 654) of patients reported injection drug use and 29% (n = 1,432) of patients had a prevalent AIDS diagnosis at their CNICS enrollment. The median CNICS enrollment year was 2007 (IQR: 2005, 2010) and 18% of patients were at least 50 years of age. Forty-two percent of patients had a viral load
100,000 copies/mL and 59% of patients had a CD4 cell count below 200 cells/mm3. The most common racial groups were white non-Hispanic at 41%, black non-Hispanic at 40%, and His-panic at 13%.
In their first two years of follow-up, 16% (n = 796) of the 4,907 patients did not initiate ART, 6% (n = 303) died, 19% (n = 930) were lost to follow-up, and 59% (n = 2,878) initiated ART. Excluding only patients who were alive and had not initiated ART prior to becoming lost to follow-up (n = 293), the proportion that did not initiate ART within 6 months, 1 year, and 2 years was 31% (n = 1,439), 26% (n = 1,178), and 21% (n = 959), respectively.
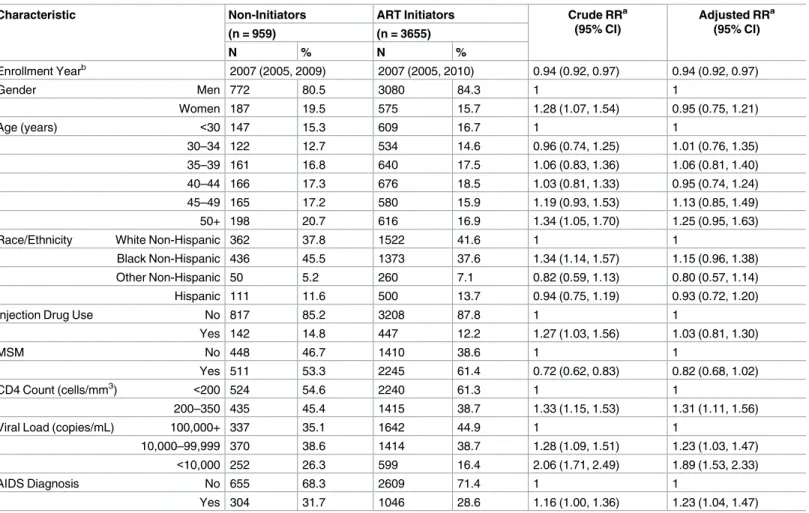
example, for each one-year increase in CNICS enrollment date, patients were 0.94 times (95% CI: 0.92, 0.97) as likely to delay ART initiation. Age, gender, race/ethnicity, reported injection drug use, and an HIV risk factor of male-to-male sexual contact were not associated with delayed ART initiation after adjustment for other factors.
Clinical factors, each assessed at enrollment, were examined as to their association with delayed ART after adjustment for all other clinical and demographics factors. As shown in
Table 2, clinical factors associated with delayed ART included higher CD4 cell count, lower viral load, and a prevalent AIDS diagnosis. For example, those with CD4 count at least 200 cells/mm3at enrollment were 1.31 (95% CI: 1.11, 1.56) times as likely to delay ART initiation compared to those with CD4 count less than 200 cells/mm3. Those with viral load less than 10,000 copies/ml at enrollment were more likely to delay ART initiation compared to those with viral load at least 100,000 copies/ml (adjusted RR = 1.89; 95% CI: 1.53, 2.33). Finally, those with a prevalent AIDS diagnosis at enrollment were more likely to delay ART initiation (adjusted RR = 1.23; 95% CI: 1.04, 1.47).
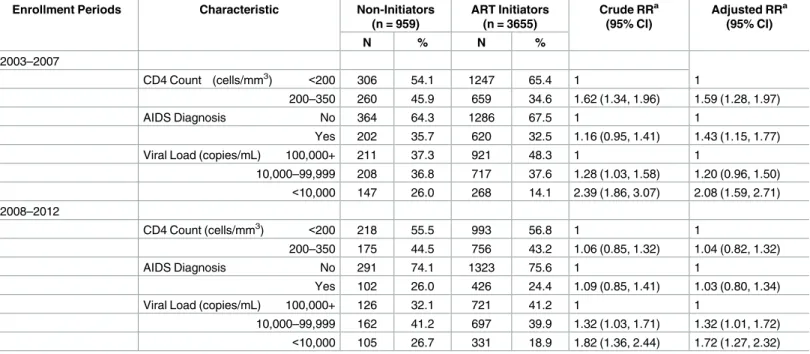
Table 3presents estimates of the crude and adjusted risk ratios for delayed ART by CD4 count, a prevalent AIDS diagnosis, and viral load over two enrollment date periods. The asso-ciation with delayed ART for both baseline CD4 count and a prevalent AIDS diagnosis dissi-pated in the latter time period. For example, from 2003–2007, those with CD4 count at least
Table 1. Characteristics of HIV-seropositive Patients Enrolled in CNICS, 2003–2012.
Characteristic Non-Initiators Deaths Lost to Follow-Up ART Initiators Overall
(n = 796) (n = 303) (n = 930) (n = 2878) (n = 4907)
N % N % N % N % N %
Enrollment Yeara 2007 (2005, 2009) 2006 (2004, 2009) 2007 (2005, 2009) 2007 (2005, 2010) 2007 (2005, 2010)
Gender Women 156 19.6 52 17.2 158 17.0 457 15.9 823 16.8
Age (years) <30 135 17.0 24 8.0 129 13.9 516 17.9 804 16.4
30–34 100 12.6 36 11.9 137 14.7 423 14.7 696 14.2
35–39 137 17.2 44 14.5 156 16.8 507 17.6 844 17.2
40–44 141 17.7 48 15.8 199 21.4 523 18.2 911 18.6
45–49 137 17.2 59 19.5 153 16.5 443 15.4 792 16.1
50+ 146 18.3 92 30.4 156 16.8 466 16.2 860 17.5
Race/Ethnicity
White Non-Hispanic 298 37.4 112 37.0 370 39.8 1210 42.0 1990 40.6
Black Non-Hispanic 358 45.0 139 45.9 405 43.6 1040 36.1 1942 39.6
Other Non-Hispanic 46 5.8 15 5.0 53 5.7 211 7.3 325 6.6
Hispanic 94 11.8 37 12.2 102 11.0 417 14.5 650 13.3
Injection Drug Use Yes 113 14.2 61 20.1 179 19.3 301 10.5 654 13.3
MSM Yes 441 55.4 129 42. 6 553 59.5 1802 62.6 2925 59.6
CD4 Count (cells/mm3) <200 393 49.4 241 79.5 510 54.8 1748 60.7 2892 58.9
Viral Load (copies/mL) 100,000+ 257 32.3 151 49.8 303 32.6 1340 45.6 2051 41.8
10,000–99,999 311 39.1 110 36.3 423 45.5 1061 36.9 1905 38.8
<10,000 228 28.6 42 13.9 204 21.9 477 16.6 951 19.4
AIDS Diagnosis Yes 230 28.9 141 46.5 257 27.6 804 27.9 1432 29.2
Abbreviations: CNICS, CFAR Network of Integrated Clinical Systems; MSM, ever male-to-male sexual contact; AIDS, acquired immunodeficiency syndrome
aMedian (interquartile range)
200 cells/mm3at enrollment were 1.59 (95% CI: 1.28, 1.97) times as likely to delay ART initia-tion compared to those with CD4 count less than 200 cells/mm3. However from 2008–2012, those with CD4 count at least 200 cells/mm3at enrollment were 1.04 (95% CI: 0.82, 1.32) times as likely to delay ART initiation compared to those with CD4 count less than 200 cells/mm3. The association between viral load and delayed ART initiation was attenuated, but still per-sisted in the latter time period. In additional sensitivity analyses, excluding decedents over the two-year risk period and further adjusting for both clinic site and the number of clinic visits resulted in no appreciable changes in the patterns seen in the data.
Discussion
We found that among ART-naïve patients with CD4 count at or below 350 cells/mm3, higher CD4 count, lower viral load, a prevalent AIDS diagnosis, and an earlier CNICS enrollment date were each independently associated with failure to initiate ART within the first two years after enrollment in CNICS between January 1, 2003 and October 1, 2012. Lower viral load was
Table 2. Associations between risk factors and lack of ART initiation among HIV-seropositive patients with CD4 at or below 350 cells/mm3enrolled in CNICS (including deaths) with inverse probability of censoring weighting, 2003–2012.
Characteristic Non-Initiators ART Initiators Crude RRa
(95% CI)
Adjusted RRa (95% CI)
(n = 959) (n = 3655)
N % N %
Enrollment Yearb 2007 (2005, 2009) 2007 (2005, 2010) 0.94 (0.92, 0.97) 0.94 (0.92, 0.97)
Gender Men 772 80.5 3080 84.3 1 1
Women 187 19.5 575 15.7 1.28 (1.07, 1.54) 0.95 (0.75, 1.21)
Age (years) <30 147 15.3 609 16.7 1 1
30–34 122 12.7 534 14.6 0.96 (0.74, 1.25) 1.01 (0.76, 1.35)
35–39 161 16.8 640 17.5 1.06 (0.83, 1.36) 1.06 (0.81, 1.40)
40–44 166 17.3 676 18.5 1.03 (0.81, 1.33) 0.95 (0.74, 1.24)
45–49 165 17.2 580 15.9 1.19 (0.93, 1.53) 1.13 (0.85, 1.49)
50+ 198 20.7 616 16.9 1.34 (1.05, 1.70) 1.25 (0.95, 1.63)
Race/Ethnicity White Non-Hispanic 362 37.8 1522 41.6 1 1
Black Non-Hispanic 436 45.5 1373 37.6 1.34 (1.14, 1.57) 1.15 (0.96, 1.38)
Other Non-Hispanic 50 5.2 260 7.1 0.82 (0.59, 1.13) 0.80 (0.57, 1.14)
Hispanic 111 11.6 500 13.7 0.94 (0.75, 1.19) 0.93 (0.72, 1.20)
Injection Drug Use No 817 85.2 3208 87.8 1 1
Yes 142 14.8 447 12.2 1.27 (1.03, 1.56) 1.03 (0.81, 1.30)
MSM No 448 46.7 1410 38.6 1 1
Yes 511 53.3 2245 61.4 0.72 (0.62, 0.83) 0.82 (0.68, 1.02)
CD4 Count (cells/mm3) <200 524 54.6 2240 61.3 1 1
200–350 435 45.4 1415 38.7 1.33 (1.15, 1.53) 1.31 (1.11, 1.56)
Viral Load (copies/mL) 100,000+ 337 35.1 1642 44.9 1 1
10,000–99,999 370 38.6 1414 38.7 1.28 (1.09, 1.51) 1.23 (1.03, 1.47)
<10,000 252 26.3 599 16.4 2.06 (1.71, 2.49) 1.89 (1.53, 2.33)
AIDS Diagnosis No 655 68.3 2609 71.4 1 1
Yes 304 31.7 1046 28.6 1.16 (1.00, 1.36) 1.23 (1.04, 1.47)
Abbreviations: CNICS, CFAR Network of Integrated Clinical Systems; MSM, ever male-to-male sexual contact; AIDS, acquired immunodeficiency syndrome; CI, confidence interval; RR, risk ratio
aIP weighted estimates bMedian (interquartile range)
the sole clinical factor to remain associated with failure to initiate ART over the entire study period. Female gender, older age, black race/ethnicity, reported injection drug use, and lack of reported male-to-male sexual contact were demographic characteristics associated with delayed ART initiation in the unadjusted analysis, but did these associations did not persist after adjustment for other demographic and clinical characteristics.
The fact that entering CNICS with a CD4 count of at least 200 cells/mm3was associated with delayed ART initiation compared to those with CD4 count less than 200 cells/mm3was somewhat anticipated, but strength of this association given the extent of the delay (two years) was greater than expected. Clinical guidelines for ART initiation among treatment-naïve HIV patients have evolved. In 2003, at the beginning of study follow-up, ART initiation was recom-mended for HIV-seropositive individuals with a CD4 count less than 200 cells/mm3[13]. However the strength of recommendation for ART initiation among asymptomatic patients with a CD4 count at least 200 cells/mm3was carefully evaluated at the discretion of the patient and physician, with regard to weighing potential benefits and risks of early or delayed therapy initiation, especially among those patients with a CD4 count greater than 350 cells/mm3for whom the benefits of ART initiation were uncertain [13]. By 2007, guidelines recommended ART initiation for those with CD4 count less than 350 cells/mm3[14]. Our findings that an earlier year of enrollment and higher CD4 count are associated with failure to initiate ART, and that the association between higher CD4 count and delayed ART is attenuated over time likely reflect these changes in the HIV/AIDS clinical guidelines and treatment patterns regard-ing treatment initiation. Though guidelines also recommended ART initiation for patients with an AIDS diagnosis, it is possible that our findings that a prevalent AIDS diagnosis was associated with delayed ART initiation could have resulted from a lower engagement in care among these patients. Patients with a prevalent AIDS diagnoses were more likely to receive
Table 3. Association between clinical characteristics and lack of ART initiation across two enrollment periods among HIV-seropositive patients enrolled in CNICS (including deaths) with inverse probability of censoring weighting, 2003–2012.
Enrollment Periods Characteristic Non-Initiators
(n = 959)
ART Initiators (n = 3655)
Crude RRa (95% CI)
Adjusted RRa (95% CI)
N % N %
2003–2007
CD4 Count (cells/mm3) <200 306 54.1 1247 65.4 1 1
200–350 260 45.9 659 34.6 1.62 (1.34, 1.96) 1.59 (1.28, 1.97)
AIDS Diagnosis No 364 64.3 1286 67.5 1 1
Yes 202 35.7 620 32.5 1.16 (0.95, 1.41) 1.43 (1.15, 1.77)
Viral Load (copies/mL) 100,000+ 211 37.3 921 48.3 1 1
10,000–99,999 208 36.8 717 37.6 1.28 (1.03, 1.58) 1.20 (0.96, 1.50)
<10,000 147 26.0 268 14.1 2.39 (1.86, 3.07) 2.08 (1.59, 2.71) 2008–2012
CD4 Count (cells/mm3) <200 218 55.5 993 56.8 1 1
200–350 175 44.5 756 43.2 1.06 (0.85, 1.32) 1.04 (0.82, 1.32)
AIDS Diagnosis No 291 74.1 1323 75.6 1 1
Yes 102 26.0 426 24.4 1.09 (0.85, 1.41) 1.03 (0.80, 1.34)
Viral Load (copies/mL) 100,000+ 126 32.1 721 41.2 1 1
10,000–99,999 162 41.2 697 39.9 1.32 (1.03, 1.71) 1.32 (1.01, 1.72)
<10,000 105 26.7 331 18.9 1.82 (1.36, 2.44) 1.72 (1.27, 2.32) Abbreviations: CNICS, CFAR Network of Integrated Clinical Systems; CI, confidence interval; RR, risk ratio
a
IP weighted estimates
their AIDS diagnosis earlier in the HIV epidemic and prior to their CNICS enrollment date. It is possible these patients may have received care but were not consistently engaged in care.
We know of no other studies in US populations investigating the proportion of patients, for whom treatment was strongly to moderately recommended, with delayed ART initiation and their characteristics. Given that clinical guidelines recommended ART initiation for all patients regardless of CD4 count as of March 2012, it has become more important to charac-terize which patients are eligible for increased benefits of treatment initiation. A study of HIV patients newly clinically eligible for ART through their first reported CD4 count<350 cells or an AIDS-defining illness from the NA-ACCORD between 2001 and 2009 assessed factors asso-ciated with timely ART initiation [15]. Increasing age, later calendar year, male sex, a lack of history of injection drug use, a lower number of psychosocial barriers, lower CD4 count, increasing viral load, and lack of incident AIDS-defining illness were associated with a shorter time to ART initiation [15]. They also found that none of these characteristics varied over time in their association with a shorter time to ART initiation [15]. Our findings that some of these characteristics are associated with delayed ART initiation within a two-year period are consis-tent with their findings. However, our findings also suggest that the importance of clinical characteristics associated with delayed ART initiation may be diminishing over time, within the exception of lower viral load.
It was unexpected that race/ethnicity, gender, and a history of injection drug use were not associated with delayed ART initiation in the adjusted analysis. During this study period, con-cerns about the role of treatment adherence in treatment effectiveness played a pivotal role in deciding whether to initiate treatment in ART-naïve patients [13,14]. Previous studies have found that blacks and women experience less time on ART while in HIV care compared to whites and men, and that older age and male sex are associated with a shorter time to ART ini-tiation [15,16]. A recent study of patients from the Johns Hopkins HIV Clinical Cohort com-pared differences in the average time for each stage of the HIV care continuum between people who inject drugs and those who do not across 10 years following their enrollment [17]. Patients reporting a history of injection drug use spent an additional 5.5 months in HIV care but not on ART, and an additional 5.0 months on ART but not virally suppressed compared to those who did not have an injection drug use history [17]. Given these findings, the disparities between gender, race, and history of injection drug use in access and barriers to care, and the potential concerns regarding adherence to treatment, it is expected that these demographic characteristics are associated with two-year delayed ART initiation as shown in the unadjusted analysis. However, our results suggest that these demographic differences may be explained by unequal distributions of adverse clinical characteristics, which appear to be stronger risk fac-tors for treatment initiation. For example, the strength of the association between non-His-panic black race/ethnicity and delayed ART initiation was attenuated after adjustment for other factors.
The present work has several limitations. First, this is an observational study and therefore estimates are subject to possible confounding bias. Multiple adjusted effects from a single model should be interpreted with caution, and the potential for overadjustment bias, as well as adjusting for unnecessary variables should not be overlooked as these adjustments can result in increased bias or reduced precision [18,19]. However the primary focus of this research was to describe common characteristics of individuals not receiving prompt treatment with the goal of improving HIV care.
there could be unmeasured misclassification of clinical factors, including CD4 count and viral load, where it is possible that those patients classified as treatment-naïve could have previously received treatment. Third, results pertain to patients enrolled in HIV care during this study period from 2003–2012, though treatment patterns and guidelines have continued to evolve over time. Fourth, though not included in this study, insurance status and socioeconomic sta-tus are other patient characteristics that could be considered as potential risk factors for delayed ART initiation.
Lastly, deaths over the two-year time period were relatively infrequent, but losses to follow up were not. Inverse probability of censoring weights were used and we assume that the data are missing at random such that covariate information in the data can be used to eliminate selection bias induced by censoring individuals lost to follow up prior to therapy initiation. A major strength of the CNICS cohort is that it is a large multicenter HIV clinical cohort that has a standardized clinical data repository based upon prospective collection of compre-hensive patient data. Given this strong research network, there was not a substantial amount of missing data for any of the covariates within this study. However, the general population is likely to include HIV-seropositive patients who are more difficult to enroll in clinical cohorts, such as those individuals with lower access and engagement in the healthcare system. Our results estimating the proportion of delayed ART initiation are likely to be conservative rela-tive to other US HIV-seroposirela-tive patient populations. Future studies can help to identify whether these same characteristics remain consistent risk factors for delayed ART initiation among other HIV-seropositive patient populations.
Conclusions
This study identified characteristics of patients who delay ART initiation beyond the first two years of entering in care, which included an earlier CNICS enrollment date, higher CD4 count, lower viral load, and a prevalent AIDS diagnosis. This prolonged delay in ART initia-tion among patients with a moderate to strong recommendainitia-tion under past guidelines sug-gests that treatment practice under current guidelines recommending therapy initiation to all HIV-seropositive patients should be carefully scrutinized. The tendency to delay therapy in those patients with a lower viral load may still persist despite clear evidence of the benefits of immediate therapy initiation [20]. These clinical characteristics may continue to be important with current ART guidelines in providing targets for closer monitoring and intervention to reduce disparities in HIV care.
Supporting information
S1 Table. Associations between risk factors and lack of ART initiation among HIV-sero-positive patients with CD4 below 200 cells/mm3enrolled in CNICS (including deaths) with inverse probability of censoring weighting, 2003–2012.
(DOCX)
Acknowledgments
CNICS Investigators by site and core
Sites
• University of Washington, Seattle (P30 AI027757): Mari Kitahata MD (Principal Investiga-tor), Heidi Crane MD (co-Investigator)
• University of California, San Diego (P30 AI036214): William Chris Mathews MD (Principal Investigator)
• University of California, San Francisco (P30 AI027763): Elvin Geng MD (Principal Investi-gator), Steven Deeks MD (co-Principal Investigator)
• Case Western Reserve University (P30 AI036219): Benigno Rodriguez MD (Principal Inves-tigtor), Michael Lederman MD (co-Investigator)
• John Hopkins University (P30 AI094189): Richard Moore MD (Principal Investigator) • Fenway Community Health Center of Harvard University (P30 AI060354): Stephen Boswell
MD (Principal Investigator), Kenneth Mayer MD (co-Investigator)
• University of North Carolina at Chapel Hill (P30 AI50410): Joseph Eron MD (Principal Investigator), Sonia Napravnik Ph.D. (co-Investigator)
Cores
• Administrative Core: Michael S. Saag MD (Chair), Donna C. Porter Ph.D. (co-Chair) • Data Management Core: Mari Kitahata MD (Chair), Stephen Van Rompaey Ph.D.
(co-Chair), William Lober MD (co-Chair)
• Epidemiology and Biostatistics Core: Stephen R. Cole Ph.D. (Chair), Bryan Lau Ph.D. (co-Chair), Sonia Napravnik Ph.D. (co-Chair)
• Specimen Repository Core: Jeff Martin MD (Chair), Peter Hunt MD (co-Chair), Steven Deeks MD (co-Chair)
• Mentoring Core: Mallory Johnson Ph.D. (co-Chair), Monica Gandhi MD (co-Chair)
Author Contributions
Conceptualization: Terra V. Fatukasi, Stephen R. Cole, Joseph J. Eron.
Data curation: Terra V. Fatukasi.
Formal analysis: Terra V. Fatukasi, Stephen R. Cole.
Funding acquisition: Terra V. Fatukasi, Stephen R. Cole.
Investigation: Terra V. Fatukasi, Joseph J. Eron.
Methodology: Terra V. Fatukasi, Stephen R. Cole, Richard D. Moore, William C. Mathews,
Jessie K. Edwards, Joseph J. Eron.
Project administration: Terra V. Fatukasi, Stephen R. Cole.
Resources: Terra V. Fatukasi, Stephen R. Cole.
Software: Terra V. Fatukasi.
Supervision: Terra V. Fatukasi, Stephen R. Cole.
Visualization: Terra V. Fatukasi.
Writing – original draft: Terra V. Fatukasi, Stephen R. Cole, Joseph J. Eron.
Writing – review & editing: Terra V. Fatukasi, Stephen R. Cole, Richard D. Moore, William
C. Mathews, Jessie K. Edwards, Joseph J. Eron.
References
1. Arts EJ, Hazuda DJ. HIV-1 antiretroviral drug therapy. Cold Spring Harb Perspect Med. 2012; 2(4): a007161.https://doi.org/10.1101/cshperspect.a007161PMID:22474613; PubMed Central PMCID: PMCPMC3312400.
2. Centers for Disease Control and Prevention. Statistics Overview. Available:https://www.cdc.gov/hiv/ statistics/overview/. Accessed December 10, 2016.
3. Life expectancy of individuals on combination antiretroviral therapy in high-income countries: a collabo-rative analysis of 14 cohort studies. Lancet (London, England). 2008; 372(9635):293–9. Epub 2008/07/ 29.https://doi.org/10.1016/s0140-6736(08)61113-7PMID:18657708; PubMed Central PMCID: PMCPMC3130543.
4. Moore RD, Gebo KA, Lucas GM, Keruly JC. Rate of comorbidities not related to HIV infection or AIDS among HIV-infected patients, by CD4 cell count and HAART use status. Clin Infect Dis. 2008; 47 (8):1102–4.https://doi.org/10.1086/592115PMID:18781885; PubMed Central PMCID: PMCPMC2597666.
5. Panel on Antiretroviral Guidelines for Adults and Adolescents. Guidelines for the use of antiretroviral agents in HIV-1-infected adults and adolescents. Department of Health and Human Services. Avail-able:https://aidsinfo.nih.gov/contentfiles/AdultandAdolescentGL003412.pdf. Accessed December 10, 2016.
6. Samji H, Cescon A, Hogg RS, Modur SP, Althoff KN, Buchacz K, et al. Closing the gap: increases in life expectancy among treated HIV-positive individuals in the United States and Canada. PLoS One. 2013; 8(12):e81355.https://doi.org/10.1371/journal.pone.0081355PMID:24367482; PubMed Central PMCID: PMCPMC3867319.
7. Abara WE, Smith L, Zhang S, Fairchild AJ, Heiman HJ, Rust G. The influence of race and comorbidity on the timely initiation of antiretroviral therapy among older persons living with HIV/AIDS. American jour-nal of public health. 2014; 104(11):e135–41. Epub 2014/09/12.https://doi.org/10.2105/AJPH.2014. 302227PMID:25211735; PubMed Central PMCID: PMCPMC4202940.
8. Adedinsewo DA, Wei SC, Robertson M, Rose C, Johnson CH, Dombrowski J, et al. Timing of antiretro-viral therapy initiation in a nationally representative sample of HIV-infected adults receiving medical care in the United States. AIDS patient care and STDs. 2014; 28(12):613–21. Epub 2014/10/21.https:// doi.org/10.1089/apc.2014.0194PMID:25329710; PubMed Central PMCID: PMCPMC4250960.
9. Hsu LC, Truong HM, Vittinghoff E, Zhi Q, Scheer S, Schwarcz S. Trends in early initiation of antiretrovi-ral therapy and characteristics of persons with HIV initiating therapy in San Francisco, 2007–2011. The Journal of infectious diseases. 2014; 209(9):1310–4. Epub 2013/11/13.https://doi.org/10.1093/infdis/ jit599PMID:24218501.
10. Novak RM, Hart RL, Chmiel JS, Brooks JT, Buchacz K. Disparities in Initiation of Combination Antiretro-viral Treatment and in Virologic Suppression Among Patients in the HIV Outpatient Study, 2000–2013. Journal of acquired immune deficiency syndromes (1999). 2015; 70(1):23–32. Epub 2015/04/19.
https://doi.org/10.1097/qai.0000000000000652PMID:25886926.
11. Aliyu MH, Blevins M, Parrish DD, Megazzini KM, Gebi UI, Muhammad MY, et al. Risk factors for delayed initiation of combination antiretroviral therapy in rural north central Nigeria. Journal of acquired immune deficiency syndromes (1999). 2014; 65(2):e41–9. Epub 2013/06/04.https://doi.org/10.1097/ QAI.0b013e31829ceaecPMID:23727981; PubMed Central PMCID: PMCPmc3818360.
12. Geng EH, Bwana MB, Muyindike W, Glidden DV, Bangsberg DR, Neilands TB, et al. Failure to initiate antiretroviral therapy, loss to follow-up and mortality among HIV-infected patients during the pre-ART period in Uganda. Journal of acquired immune deficiency syndromes (1999). 2013; 63(2):e64–71. Epub 2013/02/23.https://doi.org/10.1097/QAI.0b013e31828af5a6PMID:23429504; PubMed Central PMCID: PMCPmc3654002.
13. Panel on Antiretroviral Guidelines for Adults and Adolescents. Guidelines for the use of antiretroviral agents in HIV-1-infected adults and adolescents. Department of Health and Human Services. Avail-able:https://aidsinfo.nih.gov/ContentFiles/AdultandAdolescentGL11102003004.pdf. Accessed Decem-ber 10, 2016.
Available:https://aidsinfo.nih.gov/contentfiles/AdultandAdolescentGL000721.pdf. Accessed December 10, 2016
15. Hanna DB, Buchacz K, Gebo KA, Hessol NA, Horberg MA, Jacobson LP, et al. Trends and disparities in antiretroviral therapy initiation and virologic suppression among newly treatment-eligible HIV-infected individuals in North America, 2001–2009. Clin Infect Dis. 2013; 56(8):1174–82.https://doi.org/10.1093/ cid/cit003PMID:23315317; PubMed Central PMCID: PMCPMC3657490.
16. Lemly DC, Shepherd BE, Hulgan T, Rebeiro P, Stinnette S, Blackwell RB, et al. Race and Sex Differ-ences in Antiretroviral Therapy Use and Mortality among HIV-Infected Persons in Care. Journal of Infec-tious Diseases. 2009; 199(7):991–8.https://doi.org/10.1086/597124PMID:19220139
17. Lesko CR, Edwards JK, Moore RD, Lau B. A longitudinal, HIV care continuum: 10-year restricted mean time in each care continuum stage after enrollment in care, by history of IDU. AIDS (London, England). 2016; 30(14):2227–34. Epub 2016/06/18.https://doi.org/10.1097/qad.0000000000001183PMID:
27314178.
18. Westreich D, Greenland S. The table 2 fallacy: presenting and interpreting confounder and modifier coefficients. Am J Epidemiol. 2013; 177(4):292–8.https://doi.org/10.1093/aje/kws412PMID:
23371353; PubMed Central PMCID: PMCPMC3626058.
19. Schisterman EF, Cole SR, Platt RW. Overadjustment bias and unnecessary adjustment in epidemio-logic studies. Epidemiology. 2009; 20(4):488–95.https://doi.org/10.1097/EDE.0b013e3181a819a1
PMID:19525685; PubMed Central PMCID: PMCPMC2744485.