FIRST YEAR RESULTS
UNDER A NEW MEDICARE ADVANTAGE PAYER-HEALTH SYSTEM VALUE BASED REIMBURSEMENT PARTNERSHIP
Jill Powelson
A dissertation submitted to the faculty at the University of North Carolina at Chapel Hill in partial fulfillment of the requirements for the degree of Doctor of Public Health in the Department of Health
Policy and Management in the Gillings School of Global Public Health.
Chapel Hill 2018
iii ABSTRACT
Jill Powelson: First Year Results Under a New Medicare Advantage Payer-Health System Value Based Reimbursement Partnership
(Under the direction of George Pink)
Value based reimbursement (VBR), defined as payment for the perceived value of services, is increasing as a trend in the U.S. healthcare system. Medicare Advantage contracts often include VBR incentives for providers and facilities to meet quality thresholds and manage the cost of care. In this context, a large healthcare delivery system located in the southeast U.S. (the System) entered a new partnership with an insurance company (the Payer) to form a Medicare Advantage plan with VBR incentives. The purpose of this research is to evaluate the impact of the partnership in its first year, including specific metrics, and to explore the reasons for the impact, including specific tactics. A
qualitative case study research method was used, incorporating interviews of key informants from both the System and the Payer.
iv
v
TABLE OF CONTENTS
LIST OF TABLES ... vii
LIST OF FIGURES ... viii
LIST OF ABBREVIATIONS ... ix
CHAPTER 1: INTRODUCTION ... 1
Statement of the Issue ... 1
Significance of the Research ... 3
Background ... 4
Research Question and Aims ... 8
CHAPTER 2: LITERATURE REVIEW ... 10
Introduction to the Literature Review Methods ... 10
Search Strategy ... 10
Study Selection ... 12
Results of Literature Review ... 13
Discussion and Implications for Further Research ... 23
Limitations ... 29
CHAPTER 3: RESEARCH METHODOLOGY ... 30
A Priori Logic Model... 30
Overview of Research Methods ... 31
IRB Approval ... 32
vi
Research Limitations ... 32
CHAPTER 4: RESEARCH RESULTS ... 34
Research Aim 1: Effect of VBR Partnership on Key Metrics ... 34
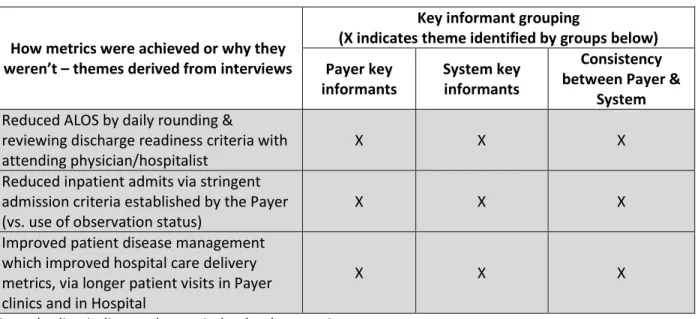
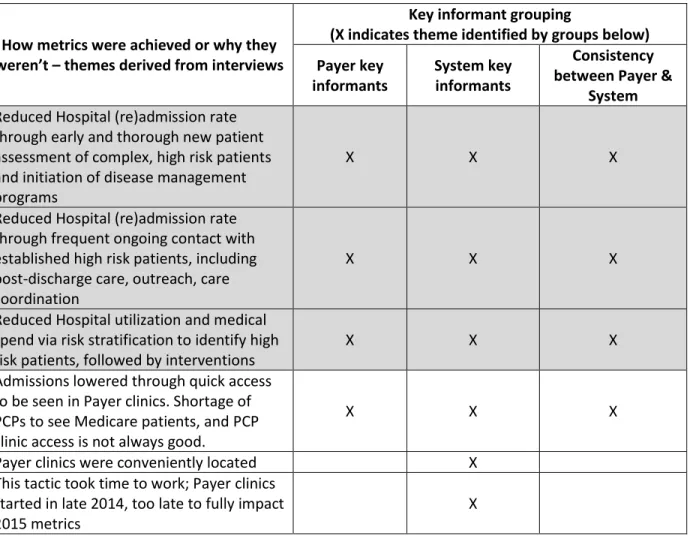
Research Aim 2: Stakeholder Opinion about How the Metrics were Realized ... 49
Other Considerations... 66
Summary of Findings ... 68
CHAPTER 5: DISCUSSION ... 71
Additional Discussion... 71
A Posteriori Logic Model... 73
CHAPTER 6: FEEDBACK, PLAN FOR CHANGE AND POLICY IMPLICATIONS ... 76
Feedback to the System and Payer ... 76
Plan for Change with AMGA Members ... 79
Policy Implications ... 84
APPENDIX A: DEFINITIONS USED IN THIS DOCUMENT ... 87
APPENDIX B: PRE-INTERVIEW BRIEFING SHEET ... 89
APPENDIX C: INTERVIEW GUIDE FOR KEY INFORMANT INTERVIEWS ... 92
APPENDIX D: A PRIORI LOGIC MODEL... 95
APPENDIX E: A POSTERIORI LOGIC MODEL ... 96
APPENDIX F: CODING FOR QUALITATIVE ANALYSIS... 97
vii LIST OF TABLES
Table 1: Metrics for VBR partnership ... 7
Table 2: Tactics used in VBR partnership ... 8
Table 3: Summary of literature review themes for Aim 1 ... 23
Table 4: Summary of literature review themes for Aim 2 ... 26
Table 5: Performance of metrics vs. goals ... 35
Table 6: Hospital care delivery metrics - performance vs. benchmarks ... 35
Table 7: Additional metrics suggested by interviewees ... 44
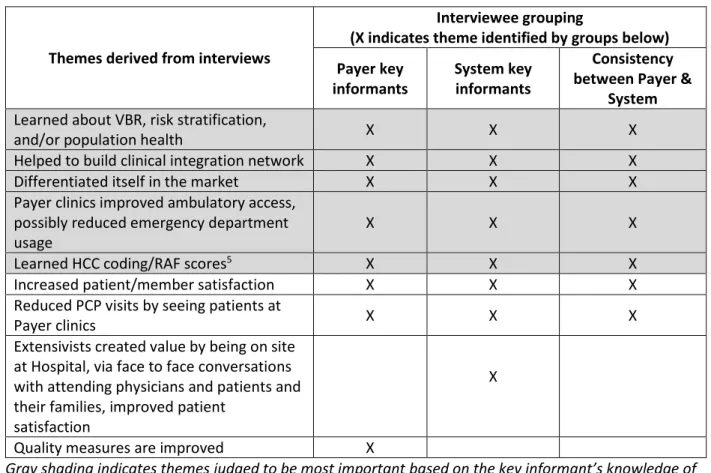
Table 8: VBR partnership creates value in ways not reflected by the metrics ... 48
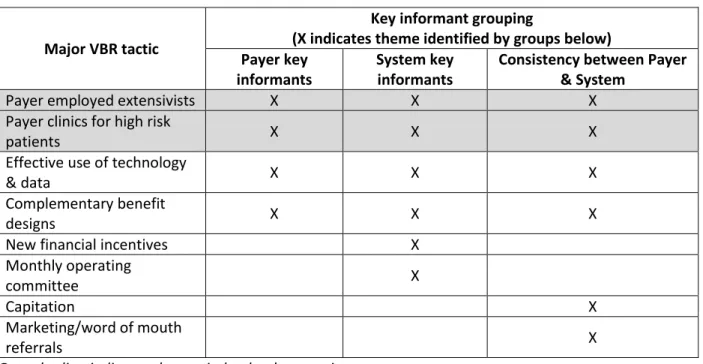
Table 9: Tactics which had the greatest impact on 2015 metrics ... 51
Table 10: Major VBR tactic: Payer employed extensivists ... 53
Table 11: Major VBR tactic: Payer clinics for high risk patients ... 54
Table 12: Major VBR tactic: Effective use of technology and data ... 56
Table 13: Benefits noted as having the greatest impact on 2015 metrics ... 57
Table 14: Major VBR tactic: Complementary benefit designs to support the clinical model ... 59
Table 15: Major VBR tactic: New financial incentives ... 61
Table 16: Major VBR tactic: Monthly operating committee ... 62
Table 17: Major VBR tactic: Primary care capitation ... 63
Table 18: Major VBR tactic: Marketing & word of mouth referrals ... 65
Table 19: Suggestions/comments for improvement - made by System key informants ... 68
Table 20: Suggestions/comments for improvement - made by Payer key informants ... 68
viii LIST OF FIGURES
Figure 1: General reimbursement trend in the U.S. ... 3
Figure 2: Flow chart for study selection ... 13
Figure 3: A priori logic model ... 30
Figure 4: Flow chart of key informant interviewees ... 31
Figure 5: A posteriori logic model ... 73
ix
LIST OF ABBREVIATIONS
ACO Accountable Care Organization ALOS Average Length of Stay
CIN Clinical Integration Network or Clinically Integrated Network CMS Centers for Medicare and Medicaid Services
COPD Chronic Obstructive Pulmonary Disease EHR Electronic Health Record
HCC Hierarchical Condition Category HMO Health Maintenance Organization MLR Medical Loss Ratio
PCP Primary Care Provider PMPM Per Member Per Month
PPO Preferred Provider Organization RAF Risk Adjustment Factor
1
CHAPTER 1: INTRODUCTION Statement of the Issue
Efforts to reform the U.S. healthcare system and reduce costs have led to an increasing emphasis on reimbursement for the perceived value of services as opposed to the volume of services (Casto & Forrestal Ch. 1, 2013; Casto & Forrestal Ch. 10, 2013; Porter, 2010). This trend is referred to as value based reimbursement (VBR). Synonyms include value based payment or purchasing and outcomes based reimbursement, payment or purchasing. All of them are referred to herein as VBR.
2
payment models (e.g., Accountable Care Organizations or ACOs) and penalties for hospitals which fail to meet federally defined quality thresholds (111th Congress, 2010).
Medicare Advantage contracts between payers, providers and facilities often include VBR incentives to meet quality thresholds and manage the cost of care. All Medicare Advantage plans receive capitated payments from CMS. This capitated payment structure creates greater incentives for Medicare Advantage plans to reduce the volume of services through innovation and the use of care coordination (Ayanian et al., 2013; CMS, 2016; MedPAC, 2016). The Affordable Care Act authorized bonus payments to Medicare Advantage plans for high performance on quality measures (111th Congress, 2010) which further incentivized high quality care. The Medicare Access and CHIP Reauthorization Act or “MACRA” (114th Congress, 2015) included dramatic changes to how providers are paid, beginning in 2019. It contains significant financial incentives for providers to enter into alternative payment models, which are a type of VBR. But MACRA had limited impact on Medicare Advantage plans, because CMS is prohibited from dictating how Medicare Advantage plans reimburse providers of healthcare services. However, MACRA did direct the Secretary of Health and Human Services to study the feasibility of incorporating alternative payment models into Medicare Advantage plans. As a result, CMS surveyed Medicare Advantage organizations and subsequently reported that most of them have already included VBR mechanisms, including alternative payment models, in their provider contracts (CMS, 2016).
Health care providers and facilities are concerned about transitioning from traditional
reimbursement to VBR, and with good reason. Success in a VBR environment will require a fundamental shift in how care is delivered in order to deliver high quality at a low cost, and failure could result in reduced financial sustainability (Bhatt, Forster & Welter, 2015; Eggbeer, Sears & Homer, 2015; Kotzbauer & Weeks, 2015; Wagner, 2015).
3
first year (2015) through a review of key metrics and inquiry into how the impact occurred. The purpose of this dissertation was to evaluate the impact of the VBR partnership, to explore the reasons for the impact, and to develop a plan for change utilizing the results of the research.
Significance of the Research
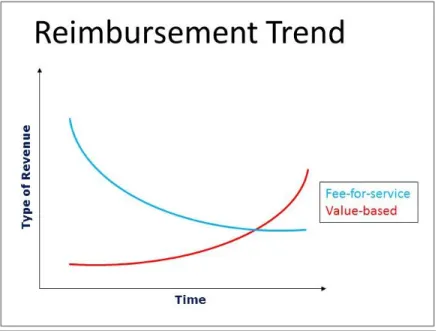
VBR is being incorporated into federal, state and commercial insurance plans. It is increasing in frequency as a payment mechanism (Fried & Sherer, 2016). Figure 1 was prepared to represent an anticipated downward trend of fee-for-service1 reimbursement as a proportion of total revenue and an upward trend of VBR. Prior to the point where the lines intersect, healthcare providers are rewarded more for volume. After the lines intersect, they will be rewarded more for reducing cost and improving quality. U.S. healthcare providers like the System will attempt to anticipate when the lines will intersect in their locale and to be prepared with strategies to maximize VBR.
Figure 1: General reimbursement trend in the U.S.
4
Fried and Sherer (2016) state that the trend toward VBR is leading to a convergence of payer and provider goals and strategies. They note that more insurers and providers are joining to form ACOs and partnerships, like the System and Payer in this study.
Approximately 31% of Medicare beneficiaries (17 million people) are covered by Medicare Advantage plans (MedPAC, 2016). The proportion of beneficiaries covered by Medicare Advantage has tripled from 2004 to 2016 (KFF, 2016), due in part to the Medicare Modernization Act of 2003 (McGuire, 2011). Given the increasing proportion of Medicare Advantage enrollment relative to traditional
Medicare, the System must participate in Medicare Advantage contracts or risk losing market share. AMGA (AMGA.org) is a national medical group and health system member organization where the researcher is an employee. An AMGA survey of executives at 55 multi-specialty medical groups and 60 healthcare systems (total n=115) showed that respondents expected a 20% increase in Medicare Advantage VBR mechanisms from 2015 to 2017 (Speed, Stempniewicz, & Couch, 2015). Another survey of 626 family medicine physicians by the American Academy of Family Physicians (AAFP) showed that 33% of respondents are actively pursuing value based payment opportunities (AAFP & Humana, 2015).
To strategically manage their organizations given these shifting revenue sources, healthcare systems need to be able to understand the impact of new risk arrangements. However, there is very little in the literature about the impact of VBR contracts on health systems, perhaps because of confidentiality concerns. This research increases our understanding of the impact of VBR contract arrangements under Medicare Advantage and factors that affect the impact.
Background
5
While there is some evidence of higher quality under Medicare Advantage compared with traditional Medicare (Ayanian et al., 2013; Basu & Mobley, 2007; Basu & Mobley, 2012; Newhouse & McGuire, 2014), private sector efficiency has not translated into federal cost savings. The cost of the Medicare Advantage program to date has exceeded traditional Medicare. Federal reductions in funding for Medicare Advantage plans are threatened to be phased in over time, to bring the cost of the program closer to traditional Medicare (111th Congress, 2010). This may result in higher beneficiary out-of-pocket costs, lower enrollment in Medicare Advantage plans, or risk-shifting from Medicare Advantage payers to providers (CMS, 2016; KFF, 2016; McGuire, Newhouse & Sinaiko, 2011). Per CMS’ (2016) report about Medicare Advantage and alternative payment models:
Many MAOs [Medicare Advantage Organizations] reported they would prefer to engage in payment models in which the provider assumes full risk…they often enter into contracts with providers with the intention of moving those providers into more sophisticated risk-based payment arrangements over time, as they become feasible for and acceptable to both parties. (p. 28)
Health Maintenance Organization (HMO) products predominate in Medicare Advantage; two-thirds of Medicare Advantage policy holders are in HMOs (MedPAC, 2016). Medicare Preferred Provider Organization (PPO) products were not introduced until 2003 (Basu & Mobley, 2007). Basu and Mobley’s (2007) analysis of AHRQ Healthcare Cost and Utilization Project data in four states found that Medicare HMO patients were less likely to have preventable hospitalizations than traditional Medicare patients, after adjusting for demographics and illness severity. Odds ratios in the 4 states were 0.83 p<0.001; 0.875 p<0.001; 0.909 p<0.05; 0.982 p=0.4. There is some evidence that Medicare Advantage enrollees tend to be healthier than traditional Medicare beneficiaries (Cooper & Trivedi, 2012; Greenwald, Levy & Ingber, 2000; Miller, Decker & Parker, 2016) though this imbalance may have improved after more sophisticated risk adjustment methods were implemented for CMS payments to Medicare Advantage plans in the mid-2000’s (Morrisey et al., 2013; Newhouse & McGuire, 2014).
6
competitive market with other large healthcare systems. Insurance companies in this area still primarily reimburse a fee for services rendered, or “fee-for-service”. Capitated payments are rare in this market. However, elements of VBR are increasingly being introduced into insurance contracts, including
Medicare Advantage contracts. The Payer is an insurance company offering Medicare Advantage plans. Both the System and Payer wish to remain blinded in this study.
Partnership & geographic area: The System and Payer entered a partnership and introduced a new Medicare Advantage product. Initially, they have limited the product offering to one county (the County) in the System’s market area. They plan to expand to other counties within the state in the future. This study was limited to the County. The System operates one hospital (the Hospital) in the County and has multiple employed physician practices there. The Payer opened its own clinics in the County to supplement the care of high cost patients and patients at high risk of hospitalization or progressing to a more severe stage of disease. The partnership agreement between the System and Payer allows for the alignment of financial incentives, in part through a gain share.
Insurance product: During the study period of calendar year 2015, the VBR partnership had one type of offering: a Medicare Advantage HMO plan including Part A, Part B and a Part D prescription benefit. Patients had to reside within the County in order to be insured through this Medicare Advantage HMO plan.
7 Table 1: Metrics for VBR partnership
Metric Definition
New patients served
Proportion of the VBR plan members who are “new to the System”, meaning they haven’t had a visit to the System in the 18 months prior to becoming a member of the plan
PCP network composition
Proportion of Primary Care Providers (PCPs) in the plan network who are independent (not employed by the System). Independent PCPs are in the numerator and total network PCPs are in the denominator.
Membership
Number of people enrolled in the plan. This figure is an average of the monthly member counts in 2015. Member count fluctuates month to month due to members reaching age 65 and changes such as
enrollment, disenrollment, death, etc. Major changes in membership figures also occur during the annual enrollment period.
Gain share alignment
When the VBR partnership generates positive earnings, a percent of earnings (a gain share) is distributed to the System and to the network PCPs. The percentage distribution is defined in the VBR partnership contract and is not included here in order to preserve confidentiality.
Hospital care delivery
Approximating the impact of programs aimed at reducing hospital utilization through proactive ambulatory initiatives. At the Hospital (the only in-network hospital for the VBR partnership’s plan in 2015), metrics for plan members are inpatient admits per 1,000 patients, average length of stay, and readmission rate.
Note: The VBR partnership performance goals and actual 2015 metric performance are shown in Tables 5 and 6 in Chapter 4.
8 Table 2: Tactics used in VBR partnership
Tactic Description
Payer clinics for high risk patients
The Payer operates multiple clinics in the County to provide supplemental outpatient care for patients at high risk of
hospitalization or disease progression. Services provided in these clinics are not billed; they are free of charge to patients of the VBR partnership.
Payer employed extensivists
An extensivist is a physician who cares for highly complex patients (i.e., with multiple chronic or acute conditions) in a clinic and/or inpatient setting. The Payer employs extensivists in the County. Their services are not billed; they are provided free of charge to patients of the VBR partnership.
Effective use of technology and data
The Payer uses an enterprise data warehouse to aggregate multiple data sources (including claims data). The Payer also has predictive analytics to risk stratify patients. Data reports are generated regularly and shared with the System and providers.
Primary care capitation
The VBR partnership has a capitated payment mechanism for primary care services. Expenses like prescription drugs,
diagnostic tests and lab tests are reimbursed separately from the capitation payment.
Monthly operating committee
Operations leaders representing both the Payer and the System meet monthly to review data and discuss how to improve results.
New financial incentives
Two financial incentives which the System and PCP providers may receive are gain sharing bonuses (also see gain share alignment in Table 1) and a fee for coordinating care with the Payer clinics.
Complementary benefit designs to support the clinical model
The Payer provided a list of benefits which were designed to help achieve desired patient outcomes. They are: free
transportation, low cost drug benefit, $0 premium, $ 0 copay for PCP and Payer clinic visits, home monitoring, dental care, vision care, nutritionist, podiatry, free initial assessment, and the extensivists. These benefits are reviewed in more detail in Chapter 4.
Marketing/word of mouth referrals, and other grass roots efforts
Multiple marketing approaches are taken to attract new patients and providers. Two examples are: 1) to attract providers, a grass roots approach is taken to visit provider clinics and to build relationships with providers, and 2) to attract patients during open enrollment cycles, plan representatives offer information about Medicare Advantage in general and the VBR partnership plan in clinic lobbies.
Research Question and Aims
9 The research aims were:
Aim 1: To examine the effect of the VBR partnership on key measures of care delivery (hospital admission, readmission, and length of stay) and other metrics mutually agreed upon by the System and Payer.
Aim 2: To delineate stakeholder opinion about how the metrics were realized, including VBR tactics.
10
CHAPTER 2: LITERATURE REVIEW Introduction to the Literature Review Methods
A literature review was conducted to identify already published articles like this study. It was anticipated that the following topics would be well covered in the literature but would not assist in answering the dissertation question: policy pieces about the Medicare Advantage program, including federal policy changes and proposals, and what to expect in the future during a shift from volume based reimbursement to VBR. These two topics were avoided in the literature review. Instead, the literature review was designed to locate publications about the effect of actual Medicare and Medicare Advantage VBR contracts with health systems, facilities and providers. In summary, the literature search question was, ‘What has been the effect of VBR contracts on health systems for a Medicare or Medicare
Advantage patient population?’ To align with the research aims, the literature was assessed to determine ‘How and why did the effects occur?’ A defined search strategy with inclusion/exclusion criteria was formalized and implemented.
Details of payer contractual arrangements are typically held confidential. The Federal Trade Commission, under Title 15 USC §45 (15 C.F.R. §45, 2002), prohibits anti-competitive price fixing activities. This regulation has had the effect of discouraging discussion between healthcare organizations about their payer contracts. This project offered a rare opportunity to review a VBR arrangement with the active cooperation of the insurance company.
Search Strategy
11
Inclusion criteria: The following inclusion criteria were used in the literature search. 1. Patient populations were primarily older adults who were covered by Medicare or Medicare
Advantage. 2. VBR was included.
3. Geography was limited to the United States, as Medicare and Medicare Advantage were the desired populations and VBR may be quite different in international settings because of differences in policy and reimbursement approaches.
4. Only English language articles were included.
5. Only publications in the last 10 years were included, as health policy has changed significantly in the past decade, and earlier publications may not be relevant.
6. Health systems including hospitals and physicians were addressed in the articles. Articles about settings other than health systems (e.g., nursing facilities, community centers, pharmacies) were avoided as they would be less informative about the research question and aims.
7. Case studies were particularly sought, if they met the above inclusion criteria, as they tended to be a good fit with the research aims.
Exclusion criteria: The following exclusion criteria were used in the literature search. 1. Articles about the Medicare Advantage program or VBR on topics other than the specific search
questions were excluded. Examples of articles excluded were federal policy changes and proposals, opinions, blogs, advice, warnings and predictions.
2. Books were excluded from the search due to not always being peer reviewed and not being as timely given the nature of the rapid changes happening in the VBR space.
3. Conditions such as cancer and major psychiatric conditions were avoided as they are often managed quite differently than chronic diseases associated with a primarily ambulatory, Medicare-age
12
4. Initiatives which were grant funded were excluded, as they were not reimbursed through VBR. However, Medicare demonstration projects were included.
Key words: With assistance from a UNC librarian, the literature search was conducted in ProQuest and PubMed using the following three search concepts in a Boolean approach:
1. Any of the following: value based, value based, outcomes-based, outcome-based, outcomes based, outcome based, risk, payment risk, reimburse, reimbursed, reimbursement, reimbursement mechanisms, reimbursement mechanism, health care costs, costs, economic, hospital economics, hospital financial management, outcome assessment, quality, health care quality, Accountable Care Organization, ACO;
2. And any of the following: Medicare, Medicare Part C, Medicare Advantage, Medicare HMO, Medicare Health Maintenance Organization;
3. And any of the following: organizational case studies, organizational case study, organization case study.
Based on the key word search for titles and abstracts with these search terms, the literature review resulted in 487 titles. 340 titles were from ProQuest and 147 were from PubMed. Titles returned by the search were from peer reviewed publications. Also, five articles were added by the researcher and a committee member, from prior readings on this topic.
Study Selection
13 Figure 2: Flow chart for study selection
Results of Literature Review
Articles addressing Aim 1: To examine the effect of the VBR partnership on key metrics such as measures of care delivery (hospital admission, readmission, and length of stay) and other metrics mutually agreed upon by the System and Payer
Information about two of the metrics – gain share alignment and improved hospital care delivery – was most common in the articles. Information on three metrics – new patients served, PCP network composition and membership – was not present in very many of the articles. (Results are presented in the same order as the metrics are listed in Table 1.)
New patients served: Kuhn and Lehn (2015) discussed the importance of a metric like this to their VBR Medicare ACO. “Attracting new members is a foundational theme in Banner’s long-term strategy and the new defining metric for our future growth.” (p. 28) They did not provide any specific historical figures or goals.
14
Membership: “Maximize Medicare risk scores” (2006) described a fully capitated plan with 8,000 Medicare Advantage patients. The article stated that “enrollment has been climbing slowly, though not as dramatically as we had hoped” (p. 85). Claffey et al. (2012) started with a pilot of 750 patients in a Medicare Advantage provider-payer partnership and mentioned subsequent growth, but did not provide specifics. Kuhn and Lehn (2015) described 95% growth in a Medicare Advantage provider-payer partnership over a two year period, from 23,000 to 45,000 members. Lee, Dayal and Fontaine (2011) mentioned they had 7,200 covered lives but did not mention growth. Steele et al. (2010) described growth of a VBR Medicare Advantage plan from 3,100 members to 19,300 – more than five-fold – over three years.
Gain share alignment - Incentives: VBR incentives such as bonuses and gain shares were frequently discussed in the articles. Major types of incentives identified in the literature were: per member per month (PMPM) bonus, percentage bonus or percentage increase, and a fixed bonus.
PMPM bonus: Claffey et al. (2012) stated that a PMPM amount (no specifics given) was paid for achieving quality and efficiency goals, in addition to usual fee-for-service payments. Patel, Rathjen and Rubin (2012) discussed outcome based payments ranging from $0.50-9.00 PMPM depending on the level of quality achieved. Brown et al. (2012) described how Medicare paid PMPM fees to providers for care coordination of high risk patients, during a demonstration project.
Percentage bonus or percentage increase: Feder (2011) explained that most doctors were eligible to earn an extra 20-30% above their salary if they met certain quality goals. James (2012) described how 5-10% of healthcare premiums, equal to $100 million, was distributed as shared savings to participating providers. Mechanic et al. (2011) discussed how providers received bonuses up to 10% of the overall medical budget for achieving optimal quality measures. “Maximize Medicare risk scores” (2006) stated that IPA revenue from five payers increased 13% overall in one year as a result of
15
Fixed bonus amount: Dominik (2008) and Couture and Fisher (2009) described one health system’s receipt of the top CMS bonus in 2008, equal to $385,000. Hagland (2007) discussed the receipt of $744,000 from the CMS/Premier Hospital Quality Incentive Demonstration project at one hospital. Vesely (2011) described shared savings of $558,000 from a Medicare demonstration project which was passed along to 150 physicians. This innovative program also paid patients approximately $300 each for choosing high quality/low cost providers. Coddington (2012) stated that physicians were paid a
“significant” bonus (no specifics given) by a payer for achieving quality targets as part of a Medicare Advantage program. Kautter et al. (2007) and Kuhn and Lehn (2015) mentioned shared savings from a Medicare demonstration project and Pioneer ACO, but did not provide any specifics.
Gain share alignment - Cost reductions: In addition to articles describing financial incentives provided by payers, articles were identified which described VBR related cost reductions or
improvements in efficiency. Cost reductions were a common strategy of VBR arrangements in the literature. Most articles focused on reducing the utilization of health services, while a few focused on automation of staff tasks. Cost reduction through achieving greater efficiency was another topic.
Reducing healthcare utilization: Bielaszka-DuVernay (2011b) stated that $1,500 per enrolled high risk patient was saved by the second year of their dual eligible, in-home assessment intervention. Bush (2012) implied a cost reduction through “hotspotting” of high cost patients and subsequent interventions. Diamond (2011) discussed a reduction in medical costs of 22% compared to a historic control group, through increased referrals to hospice and reduced inpatient utilization. Feder (2011) described several interventions for high risk patients ̶ comprehensive high risk patient care centers (not payer-run), home care team visits, hospitalist program, and telephone support from nurses and social workers ̶ which saved $2 million annually for every 1,000 high risk health plan members. This equated to $2,000 per high risk plan member. Leaver (2013) discussed cost savings of $971,246 over
16
PMPM costs by 35% (equal to $381,630), through risk stratification to identify high risk patients then offering them “medical home” services. Song et al. (2012) described how participation in a new medical home contract lowered costs by an average of 2.8% over two years. Spencer (2014) described how one medical group reduced the cost of care for patients with diabetes by 15% through hospitalists, a hospital based care manager, and home visits for high risk patients. SteelFisher et al. (2011) discussed how they reduced delirium, functional decline and falls for hospitalized older adults, and thus saved $800 per enrolled patient on the cost of care, through daily orienting communication, therapeutic activities, assistance with mobilization, feeding and hydration, and correction of vision and hearing deficits. Tanio and Chen (2013) described how they reduced healthcare utilization in a full risk capitation Medicare Advantage environment through a number of interventions, including increasing the length and frequency of clinic visits, intensive health coaching for high risk patients, and closing gaps in preventive care such as screening for colorectal cancer and glaucoma. Williams (2009) described cost reductions in inpatient utilization through innovative community strategies like community health workers. For every $1.00 spent on community health workers, the health system estimated a $2.50 savings in cost of care.
Automation: “CM enhances telemedicine” (2011) quoted up to 13% savings in costs through automated home monitoring to identify exacerbations in diabetes, COPD, or heart failure, followed by case manager intervention when appropriate. Boast and Potts (2011) reported staff time savings using automated and standardized post-surgical hospital discharge instructions, though no specific amount of savings was stated. Williams (2012) explained how telehealth use in a rural intensive care setting allowed “virtual” intensive care to be provided and thus avoided $30 million in costs over a seven year period, due to avoiding patient transfers to other medical facilities.
17
or Six Sigma were mentioned in many more articles in combination with other interventions or programs.
Improved hospital care delivery: Articles describing the effects of VBR on hospital utilization (admissions, readmissions or length of stay) are grouped below by the impact on admissions or readmissions, and length of stay.
Admission or readmission effects: Many articles described several interventions (not just one) to prevent admission or readmission. Common themes were improving transitions of care, home visits, home monitoring, nursing care management, better discharge instructions and patient education. There is considerable overlap between these interventions, so grouping them into themes was challenging. When possible, they were grouped by what seemed to be the dominant theme in the article.
Improving transitions of care: “Critical path network: transition reduced readmission rate” (2010) described how one hospital reduced their COPD readmit rate by 16% and reduced the readmit rate for combined pneumonia and COPD conditions by 27%, focusing on transitions of care, home visits, COPD classes, increased attention to smoking cessation, a new staff position, and order sets. “How do they do it?” (2009) discussed how Baylor achieved the lowest heart failure readmission rate in the country through a multi-pronged approach including transitions of care, standardized order sets, home visits, an outpatient heart failure clinic, physician champions, and transparent reports. “Team targets readmission” (2010) described how one hospital reduced their heart failure readmission rate from 30% to 17% through more focus on transitions of care, care coordination, and patient and caregiver
education including classes about heart failure. “Intervention lowers hospital admissions” (2011) described a 12.8% reduction in 30-day readmit rates vs. 20% reduction in a control group, through use of a transitional care model, new health coach roles, home visits, phone calls, and new patient
18
centers, home visits, hospitalist program, transitions of care, and telephone support. Kuhn and Lehn (2015) discussed an 8.9% reduction in overall hospital admissions and a 6% reduction in avoidable hospital readmissions primarily due to improved care transitions, during the first year of a Pioneer ACO.
Home visits: Bielaszka-DuVernay (2011b) described how in-home assessments led to a 38% reduction in admissions vs. usual care. “CM in the home” (2011) mentioned a 27% decrease in inpatient admissions due to 5-10 home visits per patient, along with palliative care, end-of-life planning, and other interventions. Cohen et al. (2012) discussed how home visits, palliative care, telephone support, and other strategies resulted in a 19% reduction in hospital days per enrollee and a lower all cause
readmission rate of 21.1% compared with fee-for-service Medicare patients at 26.7%. Diamond (2011) described an ACO-style approach by one major payer, including home visits and clinic based care managers, which reduced hospital utilization by 43%. Spencer (2014) discussed a reduction in readmissions from 20% to 12% under an ACO which provided home visits.
Home monitoring: Monitoring of equipment and electronic information signals (usually via computer or telephone) was employed to obtain information about patients who are at home.
Emmerson (2006) discussed home monitoring for patients with heart failure which was associated with a reduction in the hospital admission rate to 6.3%, vs. 28% for those without monitoring. “CM enhances telemedicine program” (2011) stated that home monitoring of chronically ill patients for potential exacerbations, paired with case managers, reduced emergency department visits and hospitalizations by about 20%. While other home monitoring programs were described besides these two, none explicitly stated that they reduced admissions or readmissions.
poly-19
pharmacy. Claffey et al. (2012) described how, in a population of 750 Medicare Advantage patients, care management and palliative care/end-of-life planning helped to reduce hospital days per 1,000 patients by 50% and led to 45% fewer readmissions. Terrell (2016) described the use of nurse navigators and other interventions to reduce hospitalization by 30% in a small group of poly-chronic patients (n=267). Brown et al. (2012) identified six approaches by care coordinators which were associated with reduced hospitalizations (8-33% reduction across four programs) in high risk patients: frequent in-person meetings with patients, occasional in-person meetings with providers, acting as a communication hub for providers, delivering evidence-based education to patients, prescription management, and timely and comprehensive transitional care post-hospitalization.
Better discharge instructions: “Project participants reaping the benefits” (2006) described interventions including an inpatient RN expediter role and better, more complete discharge instructions, resulting in a 12.09% annual reduction in heart failure readmissions. Boast and Potts (2011) explained how automated discharge instructions helped a 14 day readmit rate to go from 4.1 per 1,000 outpatient procedures to 1.5 per 1,000.
Patient education: Williams (2009) discussed how one health system used case management and patient education to go from approximately 20% heart failure related admissions to approximately 5%, for a group of 800 patients. Patient education was a common theme in many of the articles, in combination with other interventions.
Length of stay effects: Efficiency improvement programs such as Lean were a common theme in reducing length of stay. “Critical path network: interdisciplinary initiative” (2009) described a 2%
20
discussed a 14.4% reduction in average length of stay during the first year of a Pioneer ACO. MacKenzie et al. (2012) described a decline in mean length of stay from 5.3 days to 4.4 days in 3+ years among difficult to discharge inpatients. Williams (2009) discussed how one health system reduced their average length of stay for a group of 139 hospital “frequent flyers” from 8.2 days to 4.0. Williams (2012)
described a rural telehealth initiative which reduced length of stay by 25% in the ICU and other hospital units, through electronic tele-consultations with intensive care and emergency care specialists.
Articles addressing Aim 2: To delineate stakeholder opinion about how the metrics were realized, including VBR tactics
Following is a summary of articles which included VBR tactics like those used by the Payer and System. These were informative for the logic model.
High risk clinics: “How do they do it?” (2009), “Critical path network: project to reduce costs” (2010), Aston (2010), Baldwin (2013), Feder (2011), Leaver (2013), Lee, Dayal and Fontaine (2011), and Tanio and Chen (2013) describe some type of high risk clinic or medical home. None of these were specifically identified as payer run clinics. While some clinics seemed to only have high risk patients, others were a component of a larger clinic. Two were identified as focusing on heart failure (“How do they do it?”, 2009; Aston, 2010).
Extensivists and hospitalists: No articles specifically mentioned extensivists, but three articles mentioned aggressive use of employed hospitalists to achieve goals like reduced length of stay or reduced readmission rates (Coddington, 2012; Feder, 2011; Spencer, 2014). None of the providers in these articles seemed to be employed by payers.
Technology and data: References to the importance of technology and data were included in seventeen articles. Themes included various computer based technologies as well as a regional health information exchange, predictive modeling, risk stratification, telemedicine, home monitoring,
21
“Maximize Medicare risk scores”, 2006; “Critical path network: interdisciplinary initiative”, 2009; “Transition focus”, 2010; Birk, 2010; Feder, 2011; Gottlieb et al., 2010; Hagland, 2007; James, 2012; Lee, Dayal & Fontaine, 2011; Lemon, Oberst & Griffin, 2013; Nugent, 2012; Spencer, 2014; Yesenofski, Kromer & Hitchings, 2015). Eijkenaar, Emmert, Scheppach and Schöffski (2013) discussed that data on performance being fed back to providers can be effective in pay for performance programs.
Primary care capitated payments: “Maximize Medicare risk scores” (2006), Baldwin (2011), Bielaszka-DuVernay (2011b), Brown et al. (2012), Galles and Handmaker (2016), and Tanio and Chen (2013) all included mentions of capitated payments. Tanio and Chen (2013) stated, “Medicare
Advantage’s capitation model is more favorable to delivery system innovation than traditional fee-for-service Medicare because it eliminates the process of negotiating reimbursement for cost-reducing delivery system innovations.” (p. 1079)
New financial incentives: VBR financial incentives were described in 22 articles: Baldwin (2013), Baldwin (2013b), Claffey et al. (2012), Coddington (2012), Couture and Fisher (2009), Diamond (2011), Dominik (2008), Eijkenaar et al. (2013), Feder (2011), Galles and Handmaker (2016), Guglielmo (2008), Hagland (2007), James (2012), Jones et al. (2011), Kautter (2007), Kuhn and Lehn (2015), Mechanic et al. (2011), Nugent (2012), Patel, Rathjen and Rubin (2012), Pumpian (2012), Raskas et al. (2012), Vesely (2011). Incentives were related to meeting cost and quality goals, sharing gains, savings or risk of financial loss with a payer, or to help pay for new interventions. Regarding their payer-provider partnership, Claffey et al. (2012) discussed how the initial VBR agreement helped the health system to “assess the scalability and cost of the care model” as they moved towards adding a shared savings component (p. 2076).
22
an effect of pay for performance programs on patients’ health and the cost of care, it was found that providers were not aware of the financial incentives.
Complementary benefit designs: A number of articles contained benefits similar to the VBR partnership’s benefits. The following benefits were not found in the literature review: $0 premium, $0 copay, dental, vision, podiatry, initial assessment, and extensivists.
Ride program: “Critical path network: project to reduce costs” (2010) described a Medicare demonstration program with case managers who (among other tasks) arrange transportation to medical appointments. Tanio and Chen (2013) provided van transportation to medical appointments at no charge to their patients, under a fully capitated Medicare Advantage plan.
Drug benefit: Bush (2012) mentioned help for patients with filling their prescriptions. Williams (2009) described a drug subsidy program for low income Medicare beneficiaries, with low or zero copayments, deductibles or premiums, and no drug coverage gap. Williams (2012) described a diabetes care redesign initiative which could save “multiple millions” of pharmaceutical costs by shifting 30% of patients from all brand name drugs to generics.
Home monitoring: “CM enhances telemedicine program” (2011) provided home monitoring of chronically ill patients for potential exacerbations, paired with case manager support. “Critical path network: project to reduce costs” (2010) mentions telemonitoring services for patients with frequent emergency department visits. Emmerson (2006) discussed home telemonitoring visits for patients with heart failure.
Vision: SteelFisher et al. (2011) describes correction of vision deficits during older adults’ hospital stays, in order to avoid delirium and functional decline.
Nutrition: Galles and Handmaker (2016) mentioned that dietitians were part of their care coordination team.
23 Discussion and Implications for Further Research
The two tables below summarize what is known about VBR from the literature review. In general, the articles in this literature review validated the metrics and VBR tactics being used by the Payer and System, though there were some notable differences. Most notably, the metrics new patients served, PCP network composition, and membership were not well covered in the literature review. Table 3: Summary of literature review themes for Aim 1: To examine the effect of the VBR partnership on key metrics such as measures of care delivery (hospital admission, readmission, and length of stay) and other metrics mutually agreed upon by the System and Payer
Metric Themes (if any) Number of articles
Summary
New patients served
1 Kuhn & Lehn (2015) mentioned this was a “defining metric” (p.28).
PCP network composition
0 No articles located
Membership 5 A wide range of membership figures was found in
these five articles, from 750 to 45,000 members. Growth was mentioned as “climbing slowly” (“Maximize Medicare risk scores”, 2006, p.85), increasing 95% over a two year period (Kuhn & Lehn, 2015), and increasing more than five-fold over three years (Steele et al., 2010).
Gain share alignment-incentives
PMPM bonus 3 In two articles, per member per month bonuses were paid for achieving quality goals (Claffey et al., 2012; Patel, Rathjen & Rubin, 2012). Patel et al. included the range of $0.50-9.00 PMPM depending on the level of quality. In another article, a PMPM bonus helped to cover the cost of care coordination services (Brown et al., 2012).
Gain share alignment-incentives Percentage bonus or percentage increase
5 Three of the articles mentioned quality bonuses paid to providers. Figures included were 20-30% of salary, 25% of reimbursement, and 10% of the medical budget (Feder, 2011; Mechanic et al., 2011; Vesely, 2011). James (2012) mentioned 5-10% of healthcare premiums paid as shared savings, and “Maximize Medicare risk scores” (2006) discussed a 13% percent increase in reimbursement.
Gain share alignment-incentives
Fixed bonus amount
24 Metric Themes (if any) Number
of articles
Summary
article mentioned a payer bonus from a Medicare Advantage plan (Coddington, 2012).
Gain share alignment-cost reductions Improved healthcare utilization
11 Six articles described identifying and intervening with high risk or high cost patients. Where the amount of savings was mentioned, it was $1,500 and 2,000 annually per high risk patient, and 15% and 35%. (Bielaszka-DuVernay, 2011b; Bush, 2012; Feder, 2011; Lee, Dayal and Fontaine,2011; Spencer,2014; Tanio and Chen, 2013) Two articles targeted frequent emergency department or inpatient utilizers for coordinated outpatient care (Leaver, 2013) or community health workers (Williams, 2009). Reported savings were $971,000 savings over two years, and $2.50 for every $1.00 spent, respectively.
Three articles described other interventions: referrals to hospice (Diamond, 2011) for a 22% reduction in costs; a primary care medical home (Song et al., 2012) to reduce costs by 2.8% annually; and older adult orientation and engagement while hospitalized (SteelFisher et al., 2011) to reduce costs by $800 per patient per hospitalization. Gain share
alignment-cost reductions
Automation 3 Two articles described telemedicine or telehealth services: for home monitoring, saving up to 13% of costs (“CM enhances telemedicine”, 2011) and for virtual care in a rural intensive care, saving $30 million in costs over a seven year period (Williams, 2012).
One article described the use of automated discharge instructions (Boast & Potts, 2011). Gain share alignment-cost reductions Achieving greater efficiency
2 Articles mentioned: reduction in waste (lab errors), resulting in a 30% reduction in costs on one hospital unit (Birk, 2010); improved hospital room turnover, resulting in $317,000 annual savings (Gottlieb et al., 2010). Hospital care delivery -admission or readmission effects Improving transitions of care
25 Metric Themes (if any) Number
of articles
Summary
hospital admissions; reduction rates of 8.9% in one year and 20% over 2 years were stated
(“Intervention lowers hospital admissions”, 2011; Feder, 2011; Kuhn and Lehn, 2015).
Hospital care delivery -admission or readmission effects Home based care
7 Home visits were often combined with other interventions, such as palliative care. Functions provided during home visits included assessments and care management. Admission reductions mentioned in these articles ranged from 19% to 38% (Bielaszka-DuVernay, 2011b; “CM in the home”, 2011; Cohen et al., 2012). One article stated a reduction in hospital utilization of 43% (Diamond, 2011). Another stated an absolute reduction in readmissions of 8% (Spencer, 2014).
Monitoring chronically ill patients at home via computer or telephone helped to reduce hospital admissions by 75% compared with a control group (Emmerson, 2006) and by 20% compared with pre-intervention admissions (“CM enhances
telemedicine program”, 2011). Hospital care delivery -admission or readmission effects Nursing care management
6 A nursing care management intervention tended to be targeted to specific sub-populations:
polypharmacy/ polychromic (Steele et al., 2010; Terrell, 2016), Medicare/Medicare Advantage (Claffey et al., 2012; Huff, 2013), commercial (Share & Mason, 2012), high risk (Brown et al., 2012). For these smaller sub-populations, admission
reductions were reported in the range of 23.8% to 50% annually. Hospital care delivery -admission or readmission effects Better discharge instructions
2 Initiatives focused on improving the quality and completeness of instructions provided to patients prior to hospital discharge. Hospital readmissions were reduced by 12.09% annually for patients with heart failure (“Project participants reaping the benefits”, 2006). A 14-day readmit rate went from 4.1 to 1.5 per 1,000 procedures (Boast & Potts, 2011). Hospital care delivery -admission or readmission effects Patient education
26 Metric Themes (if any) Number
of articles
Summary
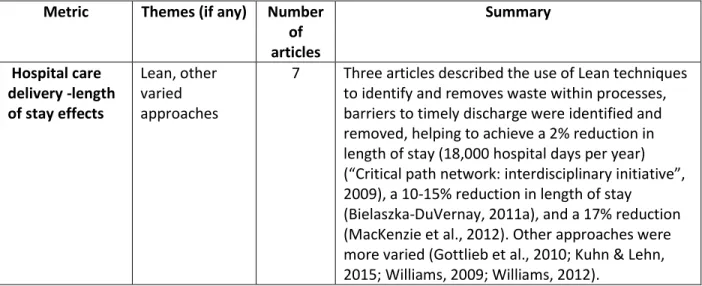
Hospital care delivery -length of stay effects
Lean, other varied approaches
7 Three articles described the use of Lean techniques to identify and removes waste within processes, barriers to timely discharge were identified and removed, helping to achieve a 2% reduction in length of stay (18,000 hospital days per year) (“Critical path network: interdisciplinary initiative”, 2009), a 10-15% reduction in length of stay
(Bielaszka-DuVernay, 2011a), and a 17% reduction (MacKenzie et al., 2012). Other approaches were more varied (Gottlieb et al., 2010; Kuhn & Lehn, 2015; Williams, 2009; Williams, 2012).
Table 4: Summary of literature review themes for Aim 2: To delineate stakeholder opinion about how the metrics were realized, including VBR tactics
Tactic Themes (if any) Number
of articles
Summary
High risk clinics None were payer run Standalone or part of a larger clinic
8 Eight articles describe some type of high risk clinic or medical home, but none of these were specifically identified as payer run clinics. Some were standalone clinics, while others were part of a larger clinic. (“How do they do it?”, 2009; “Critical path network: project to reduce costs”, 2010; Aston, 2010; Baldwin, 2013; Feder, 2011; Leaver, 2013; Lee, Dayal & Fontaine, 2011; Tanio & Chen, 2013)
Extensivists and hospitalists
No extensivists Hospitalists were employed by health systems
3 No articles specifically mentioned extensivists, but three articles mentioned the use of hospitalists to pursue VBR goals. Hospitalists were employed by health systems, not payers. (Coddington, 2012; Feder, 2011;
Spencer, 2014). Technology and data Computer systems, health information exchange, predictive modeling, risk stratification, telemedicine, home monitoring, technology to create and track metrics, and useful reports
27
Tactic Themes (if any) Number
of articles
Summary
2010; Birk, 2010; Eijkenaar, Emmert, Scheppach & Schöffski, 2013; Feder, 2011; Gottlieb et al., 2010; Hagland, 2007; James, 2012; Lee, Dayal &
Fontaine, 2011; Lemon, Oberst & Griffin, 2013; Nugent, 2012; Spencer, 2014; Yesenofski, Kromer & Hitchings, 2015) Primary care
capitated payments
Helpful source of funds; aided innovation
6 Six articles mentioned primary care capitation. (“Maximize Medicare risk scores”, 2006; Baldwin, 2011; Bielaszka-DuVernay, 2011b; Brown et al., 2012; Galles & Handmaker, 2016; Tanio & Chen, 2013)
New financial incentives
Incentives for meeting cost and quality goals; sharing gains, savings or risk of financial loss with a payer; help pay for new interventions
22 VBR financial incentives were discussed in 22 of the articles. Themes are shown in the column at left. (Baldwin, 2013; Baldwin, 2013b; Claffey et al., 2012; Coddington, 2012; Couture & Fisher, 2009; Diamond, 2011; Dominik, 2008; Eijkenaar et al., 2013; Feder, 2011; Galles & Handmaker, 2016; Guglielmo, 2008; Hagland, 2007; James, 2012; Jones et al., 2011; Kautter, 2007; Kuhn & Lehn, 2015; Mechanic et al., 2011; Nugent, 2012; Patel, Rathjen & Rubin, 2012; Pumpian, 2012; Raskas et al., 2012; Vesely, 2011)
Complementary benefit designs
Benefits in the literature: Ride program, drug benefit, home monitoring, vision, nutrition
Not found: 0 premium, 0 copay, dental, vision, podiatry, initial
assessment, extensivists
9 Nine articles described VBR related benefit designs. Only five of the plan benefits provided by the Payer were located in this literature review (see column at left). (“CM enhances telemedicine program”, 2011;
“Critical path network: project to reduce costs”, 2010; Bush, 2012; Emmerson, 2006;
Galles & Handmaker, 2016; SteelFisher et al., 2011; Tanio & Chen, 2013; Williams, 2009;
Williams, 2012) Marketing/word
of mouth referrals
28
Some of the metrics and VBR tactics did not appear in the literature. In part, this could be attributed to the literature search and the research being from a health system and provider
perspective, rather than from an insurance company perspective. As more health systems and providers enter into payer-like arrangements in the future, more literature may be available from a health system perspective. The metric PCP network composition was not located in this literature review, and the metric new patients served was only found in one article. Regarding VBR tactics, the high risk clinics run by the Payer seem to be somewhat unique; the very few high risk clinics mentioned in the literature did not appear to be operated by insurance companies. The Payer employed extensivists and their role also seem to be unique. Extensivists were not mentioned in the literature, though hospitalists were. In the literature, hospitalists were not stated as employed by payers. The reviewed articles did not include a use of marketing and word of mouth referrals as a VBR tactic.
The metrics which were tracked in various VBR arrangements in the literature generally aligned with those of the VBR partnership. There is considerable variation in how metrics are reported in the literature, particularly with regard to hospital care delivery metrics. For example, a reduction in hospital admissions or readmissions could be reported as a high percentage of a small population, or a small percentage of a large population. The period of time over which a reduction in hospital utilization occurred varied and sometimes included multiple years. Both absolute and relative reductions in hospital utilization were reported. Cost reductions could be reported as a percentage of costs, a per patient cost, or in total dollars. These varying factors make it difficult to compare metric figures found in the literature review directly to the metric figures used in the VBR partnership.
29
the cost reduction benefit accrued to providers vs. accruing to payers. Given the growing prevalence of VBR and the multiple types of stakeholders involved (including payers, providers/health systems, and patients), additional publications about how reductions in healthcare costs are divided or shared among stakeholders would be beneficial. It was interesting that Vesely (2011) noted a portion of shared savings being distributed to patients under a VBR arrangement.
Limitations
VBR is a popular topic in the literature and is mentioned in many articles. The literature review was not intended to systematically evaluate the literature about VBR, but rather to inform the logic model and methods. Therefore, the search may not have identified every relevant article.
30
CHAPTER 3: RESEARCH METHODOLOGY A Priori Logic Model
Based on early discussions with the Payer and System and the findings from the literature review, a logic model was prepared to show the major VBR tactics, the anticipated directional impact of each tactic upon the metrics, and a priori themes about how the tactics worked to impact the metrics. The resulting logic model is shown in Figure 3. (A larger version of Figure 3 is included in Appendix D.) Figure 3: A priori logic model
31
The logic model was updated as more information became available during the research process. An a posteriori logic model is presented in Chapter 5.
Overview of Research Methods
A qualitative case study research method incorporating telephone interviews of key informants (Creswell, 2014; Patton, 2002; Rubin & Rubin, 2012) was used. The key informant interviews were held with System and Payer representatives who have knowledge which assisted in answering the research question and addressing the aims.
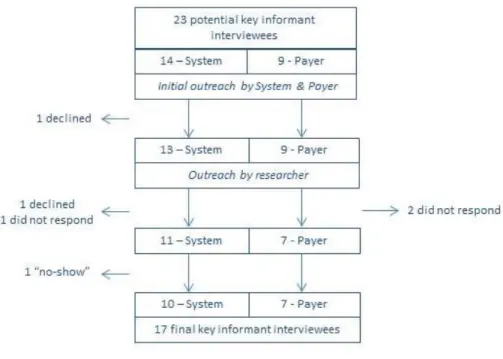
A preliminary pool of 23 potential key informant interviewees was identified by the System and Payer. Key contact people at the Payer and System made initial outreach to the potential interviewees to let them know that they would be contacted. Figure 4 shows that the final number was seventeen key informants: ten from the System, including primary care providers, and seven from the Payer. Figure 4: Flow chart of key informant interviewees
32
tactics. A blinded version of the interview guide was also tested with a fellow student for clarity of the questions. See Appendix C for the blinded version of the interview guide. During outreach to potential key informant interviewees, a briefing sheet (Appendix B) was provided, along with the interview guide. The briefing sheet and interview guide were also attached to electronic calendar invitations sent to each interviewee.
Verbal consent was asked for and received to record each of the 17 interviews. Audio recordings were transcribed verbatim into a word processing program. The audio recordings and transcripts have been stored securely in password protected electronic format until research is complete. There are no printed materials. A code dictionary was created, following the methods described by Saldaña (2016). The code dictionary is included in Appendix F. Codes were designed to represent themes and key information. The transcripts were coded using ATLAS.ti. The coding process was conducted two full times for each transcript, plus additional spot checks, in order to refine the code assignments. The researcher was the sole coder. The names of individuals who were interviewed have been kept confidential, and a code key has been utilized to enhance confidentiality. Significant quotes have been identified in the transcripts, and none of these are identifiable as to the interviewee.
IRB Approval
This research proposal was reviewed by the Office of Human Research Ethics at the University of North Carolina at Chapel Hill and determined to be exempt.
Research Delimitations
This research is limited to one insurance plan and one health system. The geographic catchment area is one county in the southeastern United States. The metrics under evaluation were limited to those for which figures were provided by the VBR partnership.
Research Limitations
33
simultaneously, and other factors are not held constant in a real world setting. Risk adjustment of the VBR population was not attempted due to the complexity of such an undertaking, the lack of detailed patient-level information, and the absence of a comparator group. Therefore, the metric results described in this study may have been due to factors other than the VBR tactics.
Figures provided by the Payer and approved by the System were relied upon. Neither the System nor the Payer possessed pre-intervention data specific to the VBR patients. Therefore, it was not possible to make a pre-VBR/post-VBR comparison except through the use of regional CMS benchmarks. Only data for 2015 was provided to the researcher.
34
CHAPTER 4: RESEARCH RESULTS Research Aim 1: Effect of VBR Partnership on Key Metrics
Key metrics of the new VBR contract in 2015 were compiled by the Payer and approved by the System. A total of five metrics were available: new patients served, PCP network composition, membership, gain share alignment and hospital care delivery. The metric hospital care delivery was further subdivided into three components: inpatient admits per 1,000 patients, inpatient average length of stay, and percentage of inpatient readmissions.
Ultimately, financial performance of the VBR partnership was not able to be included here as a metric because the two parties did not reach agreement on the financial performance figures. However, the metric gain share alignment is included in this study, and the distribution of a gain share bonus depends upon financial profitability. Therefore, an indirect measure of financial performance is included via the gain share metric.
35 Table 5: Performance of metrics vs. goals
Metric 2015 Goals1 Description Performance
New patients served
Significant % of members are
“new to System”
Payer members that are “new to System”, meaning they haven’t
had a visit to System in the 18 months prior to becoming a member of Payer
Exceeded goal
PCP network composition
Significant % of network PCPs are
independent PCPs
Gain participation from independent PCPs to (1) build relationships with those PCPs with the goal of involving them with other value based care programs and (2) ensure a broader network across the County to drive PCP access and improve attractiveness of the product
Did not meet goal
Membership x members (# redacted for blinding)
Achieve annual membership goal
Shared responsibility of Payer, System and another payer2
Did not meet goal
Gain share alignment
N/A Create gain shares with the PCPs and Hospital, allowing them to participate in the benefits from practicing value based care over time
Gain share in place
1 The parties evaluate goals annually, and goals in future years may be different.
2 Another payer is delegated for sales and marketing in the County on behalf of the VBR partnership.
Table 6: Hospital care delivery metrics - performance vs. benchmarks
2015 FFS Benchmarks (Regional) @ 1.0 Risk Score
Payer 2015 Performance*
Inpatient Admits per 1,000 Patients 236 Lower than benchmark
Inpatient Average Length of Stay 5.3 Lower than benchmark**
Inpatient Readmission Rate % 16.1%*** Lower than benchmark
*Based on 2015 dates of service claims data
** LOS at 1 Hospital where Payer had the ability to influence hospitalist processes and inpatient LOS ***Data based on all 2015 FFS & Medicare Advantage Data; not risk adjusted
Note: There is one System Hospital in the County.
36
VBR partnership was advantageous overall to the System in 2015. Each of these metrics is discussed in detail below.
Metric: New patients served: This metric measures the proportion of plan members who are new to the System. In this metric, a new patient is defined as someone who has not been seen by the System in the 18 months prior to becoming a member of the VBR partnership’s Medicare Advantage plan.
Goal & performance: The goal was set at a significant percentage of members being new to the System, and it was exceeded.
Reaction to metric results: The Payer key informants celebrated exceeding this goal. An example is the following comment:
“…I think the fact that we were able to bring net new members into a System where a lot of their utilization was predominantly going to [System], and these are members who had not previously used a [System] facility in the last 18 months, is evidence that we were able to deliver on a key component of the value proposition in terms of a market share shift.” (Payer comment) For the most part, the System interviewees also responded positively to this metric result.
Other comments-Network: This Medicare Advantage HMO plan utilizes a narrow network of providers, with higher member costs for going out of network. Only one hospital was in network in the County, and it was the System’s hospital. Patients are strongly incentivized to use the Hospital and to go to providers who are part of the plan’s narrow network. This network feature was mentioned by two key informants as a contributing factor to meeting this particular metric:
“…so for [the new patients served metric], I think the biggest thing that affected [it] was just the narrow network and [System] being the primary provider.” (Payer comment)
“Because our specialist providers are so heavily [name of System network], I think it definitely helps drive that particular [metric].” (Payer comment)
37
them with other value based care programs, and ensure a broader network across the County to drive PCP access and improve attractiveness of the VBR partnership’s Medicare Advantage product.
Goal & performance: The 2015 goal was that a significant percentage of network PCPs would be independent. The actual network composition did not meet the goal.
Reaction to metric results: While this goal was not met, a System key informant did note that through this VBR partnership, they made progress compared with where they started:
“So although they didn’t meet the goal initially, you know we really weren’t working in a meaningful way around value based care with that many independent PCPs prior to the partnership.” (System comment)
One System key informant pointed out that there are two large PCP groups in the County which are missing from the network, which makes it challenging to meet this metric goal as well as the
membership metric goal.
Other comments-CIN: It arose in the interviews that the System began a clinical integration network (CIN)2 after the VBR partnership began. Some interviewees commented about differences between the VBR network and the CIN network. There is an overlap between the two networks, and there was commentary about the Payer’s vs. the System’s approach to network development.
“…even the network, they [Payer] directly contracted with those independent primary care docs. We created a clinically integrated network. That was the governance framework for making decisions about redesigning care, how to improve quality of care, and that kind of thing, that we created, to work directly with our docs. Well, they [Payer] didn’t contract with our [System] CIN, they kept contracting, having individualized contracts with these docs, and so it was like their relationship with docs wasn’t our relationship with those docs in the context of the CIN.” (System comment)
The Payer’s contrasting viewpoint was that they needed to contract with the independent practices in order to achieve network adequacy.
“We have not been involved with the clinically integrated network at all, and it’s really a lost opportunity because [the VBR partnership] came before this [name of CIN]…So when it first started out, our network was pretty much the backbone of the network with [System] and its
38
networks, but [System] doesn’t have all of their providers that would fill network adequacy, so it kind of just ended up being independent practices that can be part of that network to meet adequacy.“ (Payer comment)
Metric: Membership: This metric is the count of members enrolled in the specific Medicare Advantage plan which is linked with the VBR partnership. This figure is an average of the monthly member counts in 2015. Member count fluctuates month to month due to members reaching age 65 and changes such as enrollment, disenrollment, death, etc. Major changes in membership figures also occur during the annual enrollment period.
Goal & performance: A goal was set for the initial year (2015) of the new plan, and it was not met. This metric is described as a shared responsibility of the Payer, a local administrator delegated for sales and marketing in the County on behalf of the VBR partnership, and the System. Brokers are another stakeholder group involved in the sales and enrollment process.
Reaction to metric results
HMO vs. PPO: Medicare Advantage HMO plans are common across the U.S.; two-thirds of Medicare Advantage policy holders are in HMOs (MedPAC, 2016). However, Medicare Advantage participation varies widely by state and county. Several key informants mentioned that this geographic area was a difficult location in which to market an HMO plan, and that made it challenging to recruit plan members. One System interviewee summed up this difficulty as follows:
“…we've never really been a strong HMO market in [name of state].” (System comment) Payer interviewees had informative comments on this topic as well:
“It's the seniors who have a lot of money, who have a secondary insurance and are not Medicaid-eligible, who didn't like our plan because it requires prior authorization ... they like their PPO broad network plan. So, those types of folks weren't as happy, I think, or satisfied or weren't selecting our plan.” (Payer comment)