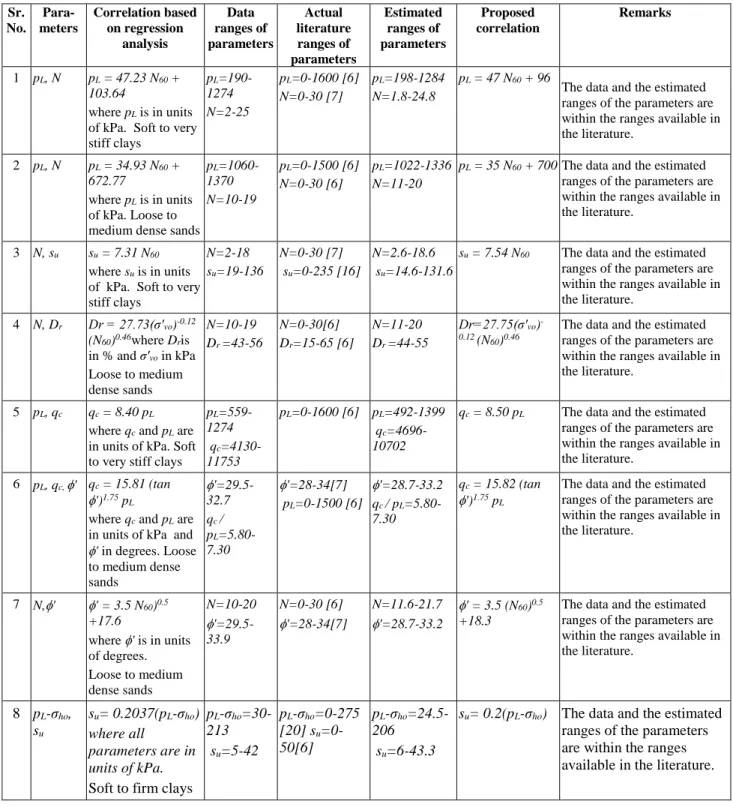
Correlations of Pressuremeter Data with SPT, CPT and Laboratory Tests Data
Full text
Figure


Related documents
Research into health effects of radiation from cell towers and cell phones provides overwhelming evidence warranting immediate and drastic change in policy
(b) The Hilbert time–frequency spectrum of the multiplicative data: the modulation of the wave can be seen at the carrier frequency of the IMF with the modulating sine wave given by
Figure 5.21 Fructose, glucose and sucrose concentrations of ‘Russet Burbank’ potatoes measured after harvest (day 0), after curing for 2 weeks, at 2 weeks storage in ethylene and
in the body of law has a positive influence on the likelihood of the further generation of rules, we use the total rule birth density variable to measure the total number of rules
Gods and Dead and mighty Spirits, Powers of Land and Sky and Sea, By Fire and Well and sacred Tree, offerings I make to thee.. To those who dwell below, to those who dwell above,
This pumps water from the saddle tank into the boiler while the loco is running and therefore maintains a steady level of water in the gauge glass (3).. Setting the water
ABStrAct | In “Animal Spirits” looks in some depth at several of Williams’s poems about dogs or cats written over the course of his career, from “Sub Terra” (1917); “Poem
Taking into account scheduled tranches of loans from international financial institutions to be drawn the 2014 State budget borrowing requirements in foreign currency
