ISSN: 2252-8938, DOI: 10.11591/ijai.v7.i3.pp125-129 125
Design Process to Reduce Production Cycle Time in Product
Development
Mahesh Mallampati1, Kolla Srivinivas2, Tirumala Krishna. M3
1,3Department of Mechanical Engineering, Guntur Engineering College, Guntur, India 2Department of Mechanical Engineering, RVR & JC College of Engineering, Guntur, India
Article Info ABSTRACT
Article history: Received Mar 18, 2018 Revised May 18, 2018 Accepted Jun 24, 2018
In today’s business climate, the old adage “time is money” has been expanded to mean that time is competitive weapon. Today customer’s demands are quick delivery and good quality at reasonable price. When entering the global market the companies encounter several difficulties, the most important one being excessive time for new product development. Thus to perform in a global market, short lead times are essential to provide customer satisfaction. Lead time in manufacturer point of view is the time elapse between placing of an order and the receipt of goods ordered. There are various components of lead time such as setup time, process time, move time and waiting time. This paper deals with review of various tools and techniques to reduce lead time. This problem can be solved by transition from sequential engineering to concurrent engineering, A survey of published works in the field of designing teams in big companies has revealed that in big companies a three-level team structure is recommended, as well as a workgroup, consisting of four basic teams. Method study techniques use to examine current way of work and develop effective method base on elimination, combining, changing and simplification of activities. Various lean tools such as Single Minute Exchange of Dies (SMED), 5S, Poka-yoke, Kanban, Just-in-time (JIT), Value Stream Mapping (VSM), Jidoka, Cellular manufacturing etc. helps in reducing lead time. Also Manufacturing Resource Planning (MRPII), Theory of Constraints (TOC) classic approaches of Production Planning and Control (PPC) are use to reduce Work in Process (WIP) and flow time.
Keyword: Just-in-time (JIT) Manufacturing resource planning (MRPII)
Theory of constraints (TOC) Value stream mapping (VSM) Work in process
(WIP)
Copyright © 2018 Institute of Advanced Engineering and Science. All rights reserved.
Corresponding Author: Mahesh Mallampati,
Department of Mechanical Engineering, Guntur Engineering College, Guntur, India. Email: [email protected]
1. INTRODUCTION
Analysis of the three-level team structure has led us to the conclusion that in SMEs a two-level team structure and a workgroup consisting of two basic teams should be preferred. The results of designing a two-level team structure and the project of transition to concurrent development of mini-loader are presented. The paper presents the principle of concurrent product development process. The market forces small-and medium-size enterprises (SMEs) to a transition from sequential to concurrent engineering and as team work is the basic element of the concurrent engineering, special attention is being paid to team and workgroup forming in the loops of concurrent product development process in an SME.
2. PROBLEM DESCRIPTION
Equation 1 shows little‟s law, and it is widely applicable to almost any queuing situation. It shows that by maintaining same production rate reduction in lead time will reduce WIP or means of identifying the largest component of lead time is to find largest inventories and work to reduce them [3].
Inventory = production rate * Lead time (1)
Section 2 discuss in detail, lead time measures and various component of lead time. Section 3 reviews various tools and techniques presented in literature for lead time reduction. Section 4 illustrates benefits of lead time reduction. In section 5, the paper evaluates and categorizes the applicability of tools and techniques reviewed in the previous section in order to assist practitioner in the choice of appropriate tools and techniques. Section 6 highlights areas in need of further research.
2.1. Concurrent Engineering
The term ‘‘concurrent engineering’’ denotes an interdisciplinary co-operation and parallel work toward a common set of consistent goals on development, manufacturing and sales of products. Responsibility for products is transferred to teams which are being formed for the time frame of development of innovative products.
2.2. Goals of Concurrent Engineering
Using concurrent engineering, the following goals should be achieved: Considerably shorter new product development time reduced new product development costs, and better quality of new products regarding the customer needs. Concurrent product development time is reduced by 50% or more due to the following reasons: activities run in parallel, team members have regular meetings which allow fast and efficient exchange of information, responsibility for all product features is transferred to teams (no time is wasted for searching the person ‘‘who is to be blamed for errors’’). Stages and activities of the new product development process Concurrent and sequential engineering usually consist of seven stages of product development process: Definition of goals, feasibility study, development, design, process planning, Manufacturing and assembly, and delivery.
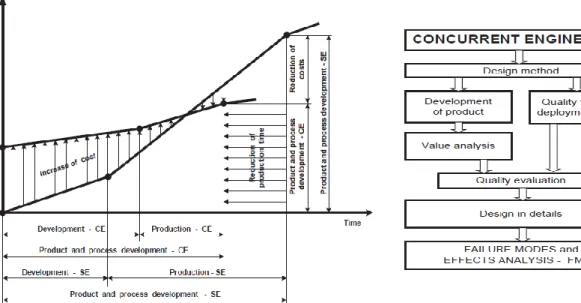
Figure 1. Costs of Sequential and Concurrent Product and Process Development.
Figure 2. Concurrent Engineering Tools
3. PROBLEM DESCRIPTION
3.1. Lead Time Measures
There is an old adage that “The road one takes matters only if one knows where they are and where they are trying to go.” There is necessity to firm have a cycle timeperformance base line against which to compare results of new processes. Abbie Griffin (1993) presented one set of product development
measurement tools, which can be used by firms to generate product development cycle time performance baselines. She has produced relationships between development time and percent change across product generations, complexity and whether or not a formal process was used. She also demonstrate how to use them to either forecast expected project duration, given that you have not changed your development process, or determine whether a process change has actually decreased development cycle time [5].
Lead time is equal to sum of the processing time, setup, move, queue, wait-in-batch, wait-to-batch, and wait-to-match times. Because queue, wait-in-batch, wait-to-batch, and wait-to-match times all involves waiting, they are collectively referred as waiting time. Equation 2 is formula for lead time calculation. Waiting time is usually largest of the four components, accounting for as much as 90% of manufacturing lead time in some system.
Danny J. Johnson (2003) studied the basic factors that determine manufacturing throughput time and explain why each factor occurs. Manufacturing throughput time is length of time between the release of an order to factory floor and its receipt into finish good inventory. These factors are processing time, production and transfer batch size, setup and move time, variability and workstation utilization. Author also presented a conceptual framework that illustrates the action that can be taken to reduce each factor, and relationships between them. Framework provides an easy-to-use tool that managers can use determine a course of action to reduce manufacturing throughput in their own plants [6].
Lead time = Setup time + Processing time + Move time + Waiting time (2)
4. TOOLS AND TECHNIQUES FOR LEAD TIME REDUCTION
As described earlier lead time is compose of setup time, processing time, move time and waiting time. There are different tools for different component. This section first shows tools for setup time reduction, and then discussed tools to reduce other component.
a. Setup Time Reduction
b. Processing, Move and Waiting time reduction c. Production Planning and Control
d. Design for Production (DFP) 4.1. Setup Time Reduction
A.Allahverdi and H.M.Soroush (2008) demonstrated that scheduling activities profoundly depends on setup time/costs. Treating setup times/costs separately from processing times/ costs allows operations to be performed simultaneously and hence improves resource utilization [7].
M.Diaby et al. (2013) developed nonlinear optimization model to determine optimal level of setup reduction, defect rate reduction, and production cycle time for each product subject to demand, process improvement budget, and manufacturing and warehousing capacity constraints. A convex geometric programming approximation of these models is developed in order to solve them [8].
4.1.1. Single Minute Exchange of Die (SMED)
S.Patel et al. (2001) illustrate that reducing set-up time mainly by teamwork, standardization methods, work study, new machinery/technology, empowerment, fixtures/fittings, pre-set tooling and automatic tool changers. If set-up times are to be reduced to single digit figures then the companies need to embrace the SMED methodology [9]. S.Patel et al.(2001) studied set-up time reduction and mistake proofing methods in a small company involved in the machining of precision components in small batches with high variety for aerospace industry. Authors evaluated setup to examine the type of improvements which can be made using Shingo‟s SMED methodology [10].
Patel Chintankumar (2012) demonstrated that by implementing SMED methodology on C.N.C machine which produced platen; reduce down time 113.75 min to 59.75 min per month. Also production of platen increases [11].
4.1.2. Method Study
S.Patel et al. (2001) stated that companies are reducing set-up time using method study techniques as opposed to Shingo‟s SMED methodology. The Companies use typical step for reduce setup times are 1) Selecting the setup which provide greatest return on the investment of the time spent studying them, including those which offer the greatest scope for improvement , or which are causing bottlenecks and delays. 2) Recording all relevant facts of the present setup with respect to the sequence of time, interrelationship of activities and path of movements. 3) Examining those facts critically and in sequence relation to: Purpose; place; sequence; person and means. 4) Developing the most practical, economic and
effective method in relation to elimination, combining, changing, and simplification of the setting-up activity. 5) Installing the improved set-up procedure and method. 6) Maintaining the method by periodically checking it in use [9].
4.1.3. Design for Production (DFP)
Design for Production (DFP) evaluates how many parts the manufacturing system can output and how long each order will take. That is, it evaluates manufacturing capacity and measures the manufacturing time. Product development teams need, early in the product development process, methods that can estimate the manufacturing cycle time of a given product design. If the predicted manufacturing cycle time is too large, the team can reduce the time by redesigning the product or modifying the production system. DFP methods evaluate a product design by comparing its manufacturing requirements to available capacity and estimating manufacturing cycle time.
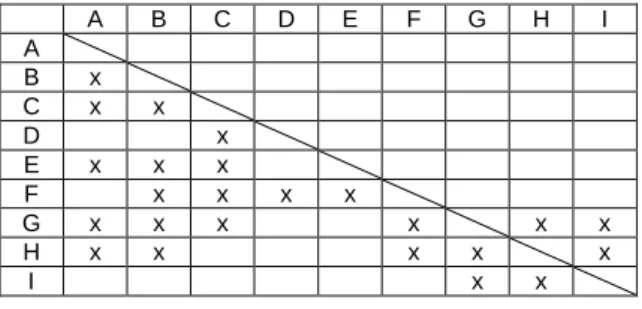
Jeffrey W. Herrmann and Mandar M. Chincholkar (2000) developed DFP decision support tool that analyzes capacity requirements, estimates themanufacturing cycle time of the new product, and provides feedback to the product development team. Product development team use this feed back to reduce manufacturing cycle time. The decision support tool has five modules: the 5. Design Structure Matrix (DSM) Design Structure matrix (DSM) was originated by steward in 1989. It is also called dependency structure Matrix. DSM is tool to identify the dependencies between activities and to sequence the development process. The DSM is a square matrix with one row (i) and column (j) per activity. The activities are listed in roughly chronological order. Figure 3 shows DSM matrix. Diagonal elements are place holder in a simple DSM, and off-diagonal elements indicate activity interfaces. Sub diagonal matrix elements show feed forward information and super diagonal element indicates feedback. Thus, if activities in rows and corresponding columns of DSM have no direct interfaces, entries ij and ji in the matrix will be empty. On other hand, both entries ij and ji are filled, this indicate two way inter dependency. Traditional CPM/PERT method and Gantt charts do not adequately represent this type of relationships.
A B C D E F G H I
A
B x
C x x
D x
E x x x
F x x x x
G x x x x x x
H x x x x x
I x x
Figure 3. Design Structure Matrix
5. BENEFITS OF LEAD TIME REDUCTION
Reducing lead time has many benefits. Main benefits are as follows. Reduce WIP Reduce Safety Stock, Reduce costs, Improved Product Quality, Faster response to customer need, Increased Flexibility, Reduce time to market, Increase Profitability
6. SUMMARY
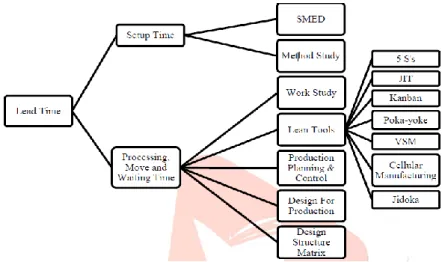
Figure 4 summarizes various tools and technique applicable to lead time component. SMED is tools to reduce setup time from hours to minutes. Work study techniques use for work simplification, reduce work content and reduce ineffective time. Lean manufacturing focuses on reduction of all kind of waste to make continuous flow of the work, reduce lead time, reduce movement of worker, eliminate non-value added activity, reduce inventory in the production space. Lead time also reduce by improving production planning and control. DFP methods evaluate a product design by comparing its manufacturing requirements to available capacity and estimate manufacturing lead time. If predicted lead time is too large, the time can reduce by redesigning product. DSM helps in reduce lead time by proper sequencing of development activities.
Figure 4. Summary of Tools and Techniques for Lead Time Reduction
REFERENCES
[1] Marc H. Meyer, James M. Utterback, “Product Development Cycle Time and Commercial Success” IEEE Transactions on Engineering Management, Vol. 42, No. 4, pp. 297-304, November 1995.
[2] A.J Senapati, P.C.Mishra, B.C.Routra, A. Biswas, “An Extensive Literature Review on Lead Time Reduction in Inventory Control” International Journal of Engineering and Advanced Technology, Volume-1, Issue-6, pp. 104-111, August 2012.
[3] Wallace J. Hopp, Mark L. Spearman, David L. Woodruff, “Practical Strategies for Lead time Reduction” American Society of Mechanical Engineer, Manufacturing review vol.3, no.2, June-1990 pp. 78-84.
[4] R. Mason-Jones, D.R. Towill, “Total cycle time compression and the agile supply chain” Int. J. Production Economics 62 (1999) pp. 61-73.
[5] Abbie Griffin, “Metrics for Measuring Product Development Cycle Time” J PROD INNOV MANAG, 1993; 10:112-125.
[6] Danny J. Johnson, “A Framework for Reducing Manufacturing Throughput Time” Journal of Manufacturing Systems, Vol. 22/No. 41, pp. 283-298, 2003.
[7] A. Allahverdi, H.M. Soroush, “The significance of reducing setup times/setup costs” European Journal of Operational Research 187 (2008) pp.978-984.
[8] Moustapha Diaby, Jose M. Cruz, Aaron L. Nsakanda, “Shortening cycle times in multi-product, capacitated production environments through quality level improvements and setup reduction” European Journal of Operational Research 228 (2013) 526-535.
[9] S. Patel, B.G. Dale, P. Shaw, “Set-up time reduction and mistake proofing methods: an examination in precision component manufacturing” The TQM Magazine Volume 13. Number 3, 2001. pp. 175-179.
[10] S. Patel, P. Shaw, B.G. Dale, “Set-up time reduction and mistake proofing methods: A study of application in a small company” Business Process Management Journal, Vol. 7 No. 1, 2001, pp. 65-75.
[11] P.C Kumar, “Set up Reduction-A perfect way for productivity improvement of computer numerical control (CNC) set up in manufacturing company” Journal of Mechanical Engineering Research, Vol. 5(8), pp. 166-170, November 2013.
[12] International Labour Office, “Introduction to Work Study”, 3rd edition, Geneva, Universal Book Corporation, pp 29.
[13] Khalid S. Al-Saleh, “Productivity improvement of a motor vehicle inspection station using motion and time study techniques” Journal of King Saud University-Engineering Sciences (2011) 23, pp. 33-41.