Sharif University of Technology
Scientia IranicaTransactions A: Civil Engineering www.scientiairanica.com
Prediction of unsaturated soils eective stress
parameter using gene expression programming
A. Johari
a;, M. Nakhaee
aand G. Habibagahi
ba. Department of Civil and Environmental Engineering, Shiraz University of Technology, Shiraz, Iran. b. Department of Civil and Environmental Engineering, Shiraz University, Shiraz, Iran.
Received 20 October 2012; received in revised form 7 January 2013; accepted 18 February 2013
KEYWORDS Unsaturated soil; Eective stress parameter; Gene expression programming; Soil suction.
Abstract. Unsaturated soil shear strength can be determined using eective stress relation that depends on the eective stress parameter. Several models have been developed in the past few years to estimate this parameter. In this research, the Gene Expression Programming (GEP) is used as an Articial Intelligence (AI) method for developing a model to predict the eective stress parameter, using ecient parameters. The principal advantage of the GEP approach is its ability to generate powerful prediction equations without any prior assumption on the possible form of the functional relationship. The input terminal set consists of net conning pressure, suction, Soil Water Characteristic Curve (SWCC) tting parameter, bubbling pressure, residual and saturated volumetric water content. The output terminal set has one member, which is the eective stress parameter. An experimental database obtained from the literature is employed to develop the model. Comparison of the model prediction with the actual data, as well as other investigators, indicates a very good performance and ability of model. Sensitivity and parametric analyses are conducted to verify the results. It is also shown that soil suction is the most inuential parameter in the eective stress parameter of unsaturated soils.
c
2013 Sharif University of Technology. All rights reserved.
1. Introduction
An optimized design of many geotechnical problems above water table such as foundations, earth retaining structures and slopes are based on shear strength of un-saturated soil. Unun-saturated soil shear strength may be determined directly in the laboratory [1-5] or indirectly using the developed models. The fundamental goal of the experimental methods is to establish the shear strength characteristics of unsaturated soils in terms of net normal stress and matric suction. The main challenges of the experimental determination of the shear strength of unsaturated soils are generally more complicated, more time consuming and more expensive
*. Corresponding author.
E-mail address: [email protected] (A. Johari)
when compared to conventional test methods for satu-rated soils. In the indirect method of determining the unsaturated shear strength, two major categories are available that are described below:
1. The models developed by considering two indepen-dent state variables, namely suction, S, and mean net stress, P . The model proposed by Fredlund et al. [1] as given below falls in this category.
= c0+ S tan b+ P tan 0; (1)
where:
= Shear strength; S = ua uw;
P = ua;
uw= Pore water pressure;
b= Angle of shearing resistance with
respect to matric suction; 0 = Eective friction angle;
c0= Eective cohesion.
Several models introduced recently fall in this group [6-8].
2. Eective stress-based method.
In this method, the shear strength is simply expressed in terms of the eective stress by:
= c0+ 0tan '0; (2)
where 0 is the eective normal stress that is
expressed by the eective stress equation proposed by Bishop [9] given by:
0= u
a+ (s); (3)
where (s) is the eective stress parameters. Sub-stituting Eq. (2) in Eq. (1) yields:
= c0+ [P + S] tan 0; (4)
where is Eective stress parameter. This param-eter is related to the matric suction with a value of = 0 for dry soils and = 1 for saturated soils.
Although the value of is known to be aected by the soil structure, stress changes and cycles of wetting and drying, this parameter has been expressed in dierent forms as listed in the next section. There has been a considerable work in the literature to come up with a suitable closed form relationship for the eective stress parameter [8,10,11]. However, the approaches employed so far make certain assumptions in order to arrive at the desired equation.
The main objective of this paper is to employ a powerful approach called Gene Expression Program-ming (GEP), a branch of articial intelligence method, to propose a suitable relationship for the eective stress parameter. The main advantage of the GEP approaches over the regression and other soft comput-ing techniques is their ability to generate prediction equations without assuming prior form of the existing relationship. In this study, soil water retention parame-ters such as bubbling pressure (hb), residual volumetric
water content (r), saturated volumetric water content
(s), as well as soil suction (S) and net conning
pressure (P ), are considered independent variables.
2. Available methods for determining eective stress parameter
There are several methods available for obtaining the eective stress parameter for a particular soil. These methods can be classied into four major groups described below.
2.1. Experimental
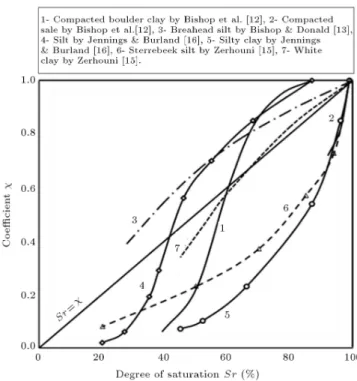
The rst group contains relationships that are obtained based on experimental result. In this group, Bishop et al. [12] were the rst who measured for several soils, using volume change and shear strength processes, the results of which are indicated in Figure 1. Bishop and Donald [13] arranged several experiments and plotted the relationship between degree of saturation and as shown in Figure 1. Jennings [14] determined the by comparing the behavior of a soil specimen under changes in applied suction with the behavior of an identical saturated sample under changes in external pressure. Zerhouni [15] updated Figure 1 initially taken from Jennings and Burland [16].
2.2. Fitting
The second group includes methods that correlate eec-tive stress parameters with unsaturated soil parameters such as matric suction, air entry value, saturated water content and residual volumetric water content. Aitchison [17] gives a tted expression for the eective parameter, written as follows:
= (
1 if Sr= 1
S
Se if Sr< 1 (5)
where S is the matric suction, Seis the air entry suction
and is a coecient varying from 0.3 to 0.35.
Khalili and Khabbaz [10] demonstrated that the eective stress parameter is unity at the suctions below bubbling pressure, and the relationship between
Figure 1. Eective stress parameter versus degree of saturation for a number of dierent soils by Zerhouni [15].
and logarithm of matric suction is linear: = ( S hb
for S > hb
1 for S hb
(6)
where
: Varies from -0.4 (lower bound of the equation) to -0.65 (upper bound), averaging -0.55;
S : Is the matric suction;
hb: Is the air entry value in the drying
process being equal to the air expulsion value in the wetting condition.
The validity of several forms of as a function of the degree of saturation was also examined by Vanapalli and Fredlund [18], using a series of shear strength test results for statically compacted mixtures of clay, silt and sand from Escario et al. [19]. For matric suction ranging between 0 and 1,500 kPa, the following two forms showed a good t to the experimental results:
= Sk r = s k ; (7)
where Sr is the degree of saturation, is volumetric
water content, sis the saturated water content, and k
is a tting parameter used to obtain a best-t between measured and predicted values.
They also proposed an expression for in terms of eective saturation or eective volumetric water content as follows:
= S1 Sr Sr
r = r
s r; (8)
where Sr is the degree of saturation, is volumetric
water content, s is the saturated water content, r
is the residual volumetric water content and S r is the
residual degree of saturation. Russell and Khalili [20] developed the following equation for sand:
= 8 > > > < > > > :
1 for S hb < 1 S hb 0:55
for 1 <S hb
< 25 250:45S
hb
1
for S hb
> 25
(9)
2.3. Theoretical
In this group, the relation for eective stress parameter developed mathematically. In these categories, Xu [11] dened the eective stress parameter, using surface fractal dimension of soil (Ds):
=
S hb
3 Ds
; (10)
where Dsis surface fractal dimension of soil pores.
2.4. Articial intelligence
Articial intelligence methods such as Neural Network (NN), Genetic Programming (GP), Gene Expression Programming (GEP), Evolutionary Polynomial Re-gression (EPR) and other machine learning methods have been used in various disciplines of civil engineer-ing [21-26]. Prediction of eective stress parameter, using articial intelligence, fall into the fourth group. Kayadelen [27] developed a neural network model with six neurons in the input layer representing the angle of shearing resistance, air entry value, sand fraction, silt+clay fraction, suction and plasticity index. The hidden layer includes: Three neurons and eective stress parameter as output layer. The model square correlation coecient (R2) for training data was 0.96.
Ajdari et al. [28] proposed a multilayer perceptron network with six neurons in the input layer representing the air entry value, the volumetric water content at residual and saturated conditions, the slope of soil water characteristic curve, the net conning stress, suc-tion and bias. The hidden layer includes seven neurons and eective stress parameter as the output layer. The model square correlation coecients for training and testing data were 0.96 and 0.75, respectively.
Gene expression programming by Ferreira [29] is a branch of articial intelligence and recent extension to genetic programming that develops computer pro-grams of dierent sizes and shapes encoded in linear chromosomes of xed length. There have been some scientic eorts directed at applying GEP to the civil engineering tasks [30-34]. The objectives of this paper can be categorized as follows:
- Investigating the feasibility of gene expression pro-gramming in order to nd dependence of eective stress parameter on soil suction, net stress and parameters dening the Soil Water Characteristic Curve;
- Assessing predictability of the model, using exper-imental data not exposed to the model during its development;
- Carrying out sensitivity analysis and parametric study, using the developed GEP model;
- Comparing the accuracy of the GEP model with a recent model.
3. Gene expression programming
Gene expression programming is a method for learning the most t computer programs by means of articial evolution. It incorporates both the simple linear chromosomes of xed length similar to Genetic Algo-rithms (GA) and the ramied structures of dierent sizes and shapes similar to the parse trees of genetic programming [29,35,36].
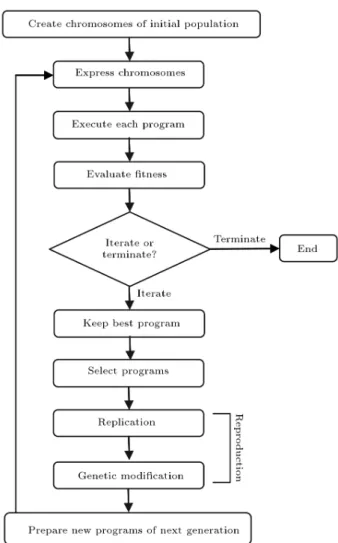
Behavior of GEP forms a metaphor of the pro-cesses of evolution in nature. GEP, similar to GA and GP, initializes a population that compounds the random members known as chromosomes. Afterwards, tness of each chromosome is evaluated with respect to a target value. The principle of Darwinian natural selection is used to select and reproduce \tter" pro-grams. The process continues until a best solution for that problem is reached (Figure 2).
In brief, eight stages are employed in GEP to solve a problem. These stages are shown in Figure 2 and listed below:
1. Generation of a random population of chromosomes (genotype). Each chromosome is a symbolic ex-pression that consists of variables (terminal) and several mathematical operators (function) in the Karva language;
2. Translating chromosomes into computer pro-grams/models (phenotype);
3. Execution of the programs/models generated in the previous step;
Figure 2. A typical representation of the GEP algorithm.
4. Performance evaluation of the programs, using the selected tness function;
5. Selection of the best performing programs;
6. Reproduction of chromosomes, using the best per-forming individuals programs through genetic op-erators replication, mutation, transposition and recombination;
7. Development of a new generation of programs as a result of the reproduction in the last step;
8. Re-execution of steps 1 to 7 until the chosen termination criteria are fullled.
In GEP application, the chromosome can have one or more genes. The gene contains two types of information. The rst type is stored in the head of the gene containing the information which is used in producing the overall GEP model. The head contains some of the functions from the pre-selected function set `F ', along with some terminals from the terminal set `T '. The second type is stored in the tail, and contains only terminals. The tail contains information that can be used in generating future GEP models. The arrangement of functions and terminals in head and tail of a GEP gene is called its structural architecture. The fundamental structural and functional dierences among GEP, GP and GA are summarized in Table 1. It is only in recent years that GEP has found its applications in geotechnical engineering [31-34].
4. GEP modeling of unsaturated soils eective stress parameter
A GEP software, GeneXproTools 4.0 [37] was used in this study to perform symbolic regression, using GEP, to nd a formulation for the eective stress parameter. From previous works on the topic, it is well understood that the eective stress parameter is dependent on the SWCC of the soil considered. Hence, any of the SWCC parameters and/or any combination of these parameters may be considered appropriate candidates for inputs of the model. Therefore, six independent parameters, namely net conning pressure, suction, SWCC tting parameter, bubbling pressure, residual volumetric water content, and saturated volumetric water content were considered as potential input vari-ables. These variables were then converted to dimen-sionless quantities, listed in Table 2, to serve as input terminals. The output terminal was the eective stress parameter corresponding to the assigned input suction. A large number of generations were needed to nd a formula with minimum error. The formulation selection was based on simplicity and its relevance to the nature of the problem; thus, ensuring a simple and ecient nal GEP model. Dening the chromosome structure requires the specication of the number of
Table 1. Comparison of GEP technique to GP and GAs, Ferriera [29].
Genetic programming Genetic algorithms Gene expression programming Population individuals
(chromosomes) are non-linear, varying in length as well as shape (also known as `parse trees')
Population individuals (chromosomes) are linear and of xed length
Population individuals (chromosomes) are linear and xed length that are converted to non-linear with varying sizes and lengths (expression trees or computer programs) at a later stage Uses a single entity working as
genome (gene) and phenome (body) at the same time
Similar to GP Has totally separated genomes and phenomes Sometimes, invalid expressions
can be obtained Similar to GP Always produces valid expressions Not yet established beyond the
replicator threshold Similar to GP Well established beyond the replicator threshold
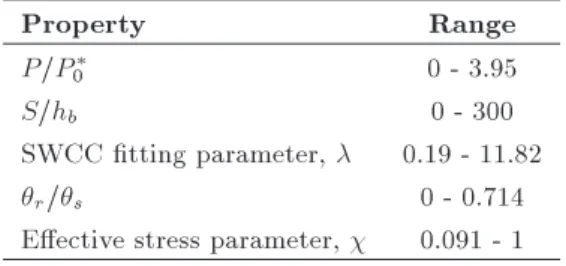
Table 2. Range of basic properties adopted for developing the GEP model.
Property Range
P=P
0 0 - 3.95
S=hb 0 - 300
SWCC tting parameter, 0.19 - 11.82
r=s 0 - 0.714
Eective stress parameter, 0.091 - 1
* P; P0: Net conning stress and atmospheric
pressure, respectively.
genes per chromosome, as well as the size of the gene. The head size of gene is the maximum number of functions and terminals that can be stored in the head and the tail of the gene. The size of the gene is normally controlled by its head size and the complexity of the problem.
The stopping criterion for the GEP model evo-lution process was achieved when the coecient of determination (R2) reached 0.8 or more. The process
was executed several times, and stopped when no signicant changes were noticed in the model statistics (ttness value and R2).
5. Database
A database consisting of 121 literature's triaxial shear and pressure plate/lter paper test results were used to train and test the GEP model. Frequently, 80 to 85 percentage of database are used for training while the remaining 15 to 20 percentage of data are used for testing the model. In this study, the results from 100 Consolidated Drained (CD) triaxial shear tests (83% of total data) performed on 14 dierent soil types were collected from the literature and employed to train the GEP model to determine the eective stress parameter
under dierent suctions [19,38-46]. The model was further tested using another database containing 21 Constant Water (CW) data sets (17% of total data) obtained from triaxial shear tests on dierent soil by Thu et al. [44]. Table 2 indicates the range of basic soil properties adopted for this study. It should be noted that, like all empirical models, GEP performs best in interpretation rather than extrapolation; thus, the extreme values of the data used are included in the training set. For the testing data bubbling pressure, residual volumetric water content, saturated volumetric water content and SWCC tting parameter were constant and equal to 27kPa, 8.75, 52 and 0.94, respectively.
Due to hydraulic hysteresis, the SWCC has two dierent branches, one corresponds to adsorption and another to desorption. The soil tends to dilate and absorb water during the softening phenomenon. How-ever, the soil behavior in the strain hardening condition is characterized by a reduction in volume accompanied by ow of water out of the soil specimen. Hence, the drying branch of the SWCC should be employed for CW tests in the strain hardening condition and the wetting branch of the SWCC should be used if the strain softening and strength drop occur.
6. Performance
To set the model parameters a performance analysis was done. In GEP, values of setting parameters have signicant inuence on the tness of the output model. These include the number of chromosomes, number of genes, gene's head size and the rate of genetic operators. This approach involved using dierent settings and conducting runs in steps. During each step, runs were carried out and the values of one of the above mentioned parameters were varied, whereas the
values of the other parameters were kept constant [34]. The runs were stopped after one hundred thousand generations, which were found sucient to evaluate the tness of the output. At the end of each run, the Mean of Squared Errors (MSE) for both training and testing sets was recorded in order to identify the values that give the least MSE. The results are shown in Figures 3 to 7. Selection of the optimum chromosome was based on the following rules:
- When the output had several generations with sim-ilar MSE around the minimum value in the training set, the generation with the lower error for testing data was selected.
- When the dierence in MSE between two or three cases was negligible, as in Figure 4, the one which leads to a model with a smaller length (smaller head
size or gene number) was selected. More details are given below:
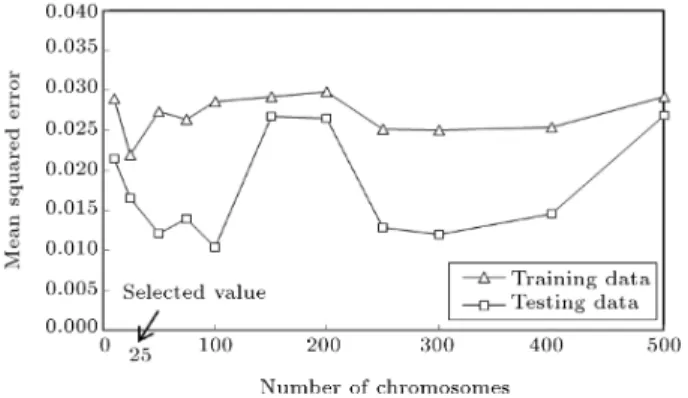
In the rst step, the number of chromosomes was determined. Figure 3 shows that the model has the best performance when the number of chromosomes was 25. This value corresponds to the least MSE for the training sets.
For selecting the number of genes and head size it was tried to nd the values with minimum length
Figure 3. Eect of number of chromosomes on the performance of the GEP model.
Figure 4. Eect of gene head size on the performance of the GEP model.
and acceptable error measure. From Figures 4 and 5, it could then be concluded that the optimum chromosome structure consists of 4 genes of head size=5.
Figures 6 and 7 present the inuence of the rates of genetic operators, mutation and gene recombination on the performance of the GEP model. It can be seen that the GEP model performs best when mutation and gene recombination rates are 0.1 and 0.3, respectively. After obtaining the optimum GEP model, the inuence of model operators on the model performance may be investigated. Figure 8 shows the eect of
Figure 5. Eect of gene number on the performance of the GEP model.
Figure 6. Eect of mutation rate on the performance of the GEP model.
Figure 7. Eect of recombination rate on the performance of the GEP model.
Figure 8. Eect of linking function on the performance of the GEP model.
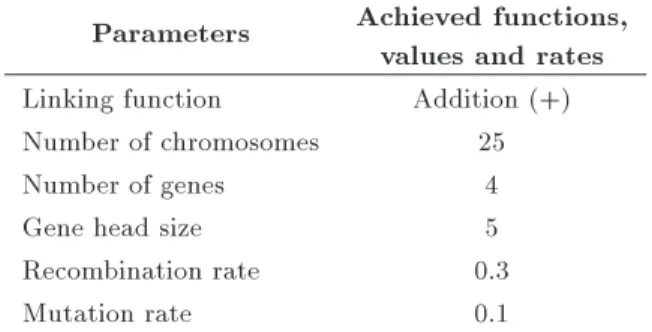
Table 3. Optimum GEP setting based on performance operation.
Parameters Achieved functions, values and rates Linking function Addition (+) Number of chromosomes 25
Number of genes 4
Gene head size 5
Recombination rate 0.3
Mutation rate 0.1
the linking function on the performance of the GEP model. It can be seen that the GEP model performs best when linking function is addition. The optimum GEP settings according to performance operation are presented in Table 3.
7. Model development
The optimum GEP program (optimum formulation) was obtained by evolving the programs toward the formulation with minimum error, compared with the actual test results. In this process, performance was also checked using the sum of absolute dierences between the predicted and actual values of the eective stress parameter. The average relative error is dened as:
Relative Absolute Error (RAE) =Xn
i=1
Ai Pi
Ai
100; (11) where Ai and Pi are, respectively, the actual and
predicted output values for the ith output and n is the number of data.
Iterations continued until this error measure did not decrease appreciably for training and testing data. Figure 9 indicates the variation of error (relative
Figure 9. Variation of error measured during training and testing generations.
absolute error) measure during model development. The model training error dropped from 2.69 in the rst generation to about 0.375 after 100,000 generations and, in testing, the error dropped from 3.37 to about 0.633 in the same generation.
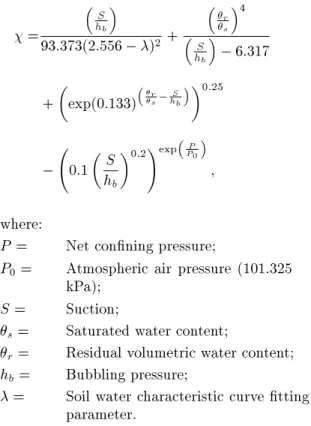
As mentioned earlier, one of the advantages of the GEP technique is that the relationship between the inputs and corresponding output is automatically constructed in the Expression Trees (ET). In this research the appropriate ETs (ET1 to ET4) that are linked to each other with addition to produce the nal model are presented in Figure 10. The trees are easily formulated into a mathematical equation given by:
Figure 10. Expression Tree (ET) of the developed GEP mode.
=
S hb
93:373(2:556 )2 +
r
s
4
S hb
6:317
+
exp(0:133)
r s hbS
0:25
0:1
S hb
0:2!expP P0
; (12)
where:
P = Net conning pressure;
P0= Atmospheric air pressure (101.325
kPa); S = Suction;
s= Saturated water content;
r= Residual volumetric water content;
hb = Bubbling pressure;
= Soil water characteristic curve tting parameter.
Several GEP models were developed using dier-ent arrange of input variables. The performance of four GEP models and eect of input parameter on error of training and testing data-set are shown in Table 4. It can be seen that model 1 has a signicantly superior performance. Therefore, the eective stress parameter of unsaturated soils strongly depends on the whole selected input parameters (P=P0), (S=hb), (), (r=s).
8. Results and discussion
Eq. (12) was used to predict all 100 eective stress parameters of the training set and 21 in the testing set. Figures 11 and 12 compare the predicted eective stress parameter with the actual data for training and testing, respectively. These gures show a good correlation between the predictions made, using GEP formulation, and the actual data, both for training and testing data. Furthermore, the proposed model is compared with the model presented by Russell and Khalili [20]. Figures 13 and 14 show the eective stress parameters predicted the model proposed by Russell and Khalili [20] for
Figure 11. Actual versus predicted eective stress parameter values for training data, R2= 0:81.
Figure 12. Actual versus predicted eective stress parameter values for testing data, R2= 0:83.
training and testing set data, respectively. In these gures, square correlation coecient, R2, is used to
compare the results given by:
R2= 1 n
P
i=1(Ai Pi) 2 n
P
i=1 Ai
Ai2
; (13)
Table 4. Performance of dierent GEP models.
Set type Training set Testing set
Model Used variables R2 RAE R2 RAE
1 (P=P0), (S=hb), (), (r=s) 0.81 0.375 0.83 0.633
2 (P=P0), (S=hb), (r=s) 0.78 0.399 0.84 0.613
3 (S=hb), (), (r=s) 0.73 0.434 0.59 0.929
Figure 13. Actual versus predicted eective stress parameter by Russell and Khalili [20] for training data, R2= 0:52.
Figure 14. Actual versus predicted eective stress parameter by Russell and Khalili [20] for testing data, R2= 0:848.
where Ai and Pi are, respectively, the actual and
predicted output values for the ith output; Ai is the
average of the actual outputs; and n is the number of data.
9. Sensitivity analysis
To evaluate the model response to changes in input parameters, a sensitivity analysis was carried out. For this purpose, all input parameters, the normalized net conning pressure (P=P0), SWCC tting parameter
(), and normalized suction by bubbling pressure (S=hb), ratio of residual volumetric water content to
the saturated volumetric water content (r=s) were
considered. To evaluate the inuence of each parameter on the eective stress parameter, the mean value of
the input parameter was increased approximately 20%, while the ranges of the other input parameters were kept constant. The results are given in Table 5. In this table, negative change means reduction and positive means increasing eect on the eective stress parameter. It is shown that, with an increase in P=P0 and , an increase occur in the eective stress
parameter. Furthermore, Table 5 shows that with an increase in S=hb and r=s, the eective stress
parameter decreases. This table shows that the applied mean net stress (P=P0) plays an important role in the
eective stress parameter.
10. Parametric analysis
For further verication of the proposed GEP models, a parametric analysis was performed. The main goal was to nd that how each parameter aects the eective stress parameter. Figures 15 to 18 present the predicted values of the eective stress parameter as a function of each parameter where others were constant. For this purpose, several arbitrary data sets from training and testing data set were considered for the parametric analysis. Response from typical data set, given in Table 6, was selected to investigate inuence of various parameters.
The results of the parametric analysis indicate that as expected, the eective stress parameter con-tinuously increases due to increasing mean net stress and SWCC tting parameter. The eective stress
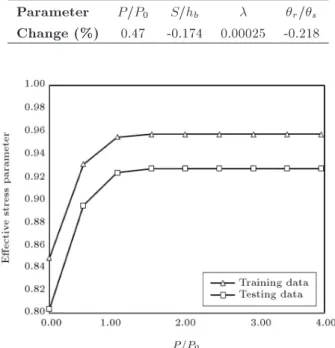
Table 5. The change in eective stress parameter corresponding to 20% increase in the mean value of the input parameters.
Parameter P=P0 S=hb r=s
Change (%) 0.47 -0.174 0.00025 -0.218
Figure 15. Parametric analysis of output model with respect to P=P0.
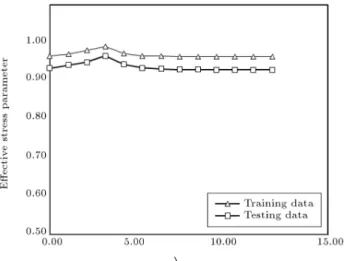
Figure 16. Parametric analysis of output model with respect to S=hb.
Figure 17. Parametric analysis of output model with respect to SWCC tting parameter.
parameter decreases when the ratio of suction to bubbling pressure and the ratio of residual to saturated volumetric water content increases.
11. Conclusion
A model based on GEP as an articial intelligence method was proposed to estimate the eective stress parameter for unsaturated soils. The input model consisted of net conning pressure, suction, soil water characteristic curve tting parameter, bubbling
pres-Table 6. Selected data from training and testing data-set for parametric analysis.
Parameter P=P0 S=hb r=s
Training 0.987 1.50 0.89 0.0051 Testing 2.960 2.815 0.94 0.1680
Figure 18. Parametric analysis of output model with respect to r=s.
sure, residual volumetric water content, and saturated volumetric water content. A database containing the results of 121 literature's triaxial shear and pressure plate/lter paper test carried out was employed to develop the model. The results from 100 consolidated drained triaxial shear tests performed on 14 dierent soil types were employed to train the model to de-termine the eective stress parameter under dierent suctions. The model was further tested using another database containing 21 constant water data sets ob-tained from triaxial shear tests on dierent soils. The model prediction indicated a reasonable accuracy both for the results used in the training, as well as the results in the testing. The model prediction compared to the actual test data indicated its good performance for prediction of the eective stress parameter. The sensitivity analysis also showed that the soil suction is the most inuential parameter in eective stress parameter. Furthermore, a parametric analysis showed an acceptable trend for the eective stress parameter with changing the input parameters of the model. These models have certain limitations in that they do not take into account the hysteresis phenomena and soil fabric eects.
The authors suggest the following future works for further improvements and extension on the topic:
- Studying other types of AI systems such as EPR;
- Validating the conclusions drawn in this paper as further data becomes available;
- Extending the AI systems to include hysteresis phenomena and soil fabric;
- Reliability assessment of the developed model.
References
1. Fredlund, D.G., Morgenstern, N.R. and Widger, R.A. \Shear strength of unsaturated soils", Can. Geotech.
J., 15(3), pp. 313-321 (1978).
2. Escario, V. and Saez, J. \The shear strength of partly saturated soils", Geotechnique, 36(3), pp. 453-456 (1986).
3. Rahardjo, H., Lim, T.T., Chang, M.F. and Fredlund, D.G. \Shear-strength characteristics of a residual soil", Can. Geotech. J., 32(1), pp. 60-77 (1995).
4. Feuerharmel, C., Bica, A.V.D., Gehling, W.Y.Y. and Flores, J.A. \A study of the shear strength of two unsaturated colluvium soils", Int. Sym. on Adv. Exp. Unsat. Soil Mech. Trento, Italy, pp. 169-174 (2005).
5. Nam, S., Gutierrez, M., Diplas P. and Petrie, J. \Determination of the shear strength of unsaturated soils using the multistage direct shear test", Eng. Geol., 122(3-4) , pp. 272-280 (2011).
6. Fredlund, D.G., Xing, A., Fredlund, M.D. and Bar-bour, S.L. \The relationship of the unsaturated soil shear strength to the soil water characteristic curve", Can. Geotech. J., 33, pp. 440-448 (1996).
7. Vanapalli, S.K., Fredlund, D.G., Pufahl, D.E. and Clifton, A.W. \Model for the prediction of shear strength with respect to matric suction", Can. Geotech. J., 33(3), pp. 379-392 (1996).
8. Garven, E.N. and Vanapalli, S.K. \Evaluation of empirical procedures for predicting the shear strength of unsaturated soils", Int. Unsat. Soil Con., ASCE, pp. 2570-81 (2006).
9. Bishop, A.W. \The principle of eective stress", Teknisk Ukeblad, 106(39), pp. 859-863 (1959).
10. Khalili, N. and Khabbaz, M.H. \A unique relationship for the determination of the shear strength of unsatu-rated soils", Geotechnique, 48(5), pp. 681-687 (1998).
11. Xu, Y.F. \Fractal approach to unsaturated shear strength", J. Geot. Geoenv. Eng., ASCE, 130(3), pp. 264-273 (2004).
12. Bishop, A.W., Alpan, I., Blight, G.E. and Donald, I.B. \Factors controlling the strength of partly saturated cohesive soils", Con. Shear Strength Cohesive Soils, ASCE: New York, pp. 503-532 (1960).
13. Bishop, A. and Donald, I. \The experimental study of partly saturated soil in the triaxial apparatus", 5th Int. Con. Soil Mech. Found. Eng., Paris, pp. 13-21 (1961).
14. Jennings, J.E. \A revised eective stress law for use in the prediction of the behaviour of unsaturated soils", Pore Pressure and Suction in Soils, Butterworths, London, pp. 26-30 (1960).
15. Zerhouni, M.I. \Role of negative pore water pressure in the soil behavior with application to pavements" [R^ole de la pression interstitielle negative dans le comporte-ment des sols-apllication au calcul des routes], Ph.D. Thesis, Ecole Centrale, Paris (1991).
16. Jennings, J.E.B. and Burland, J.B. \Limitations to the use of eective stresses in partly saturated soils", Geotechnique, 12(2), pp. 125-144 (1962).
17. Aitchison, G.D. \Relationships of moisture stress and eective stress functions in unsaturated soils", Pore Pressure and Suction in Soils Con., Butterworths, London (1960).
18. Vanapalli, S.K. and Fredlund, D.G. \Comparison of dierent procedures to predict the shear strength of unsaturated soils uses the soil-water characteristic curve", Geo-Denver, ASCE, 99(5), pp. 195-209 (2000).
19. Escario, V., Juca, J. and Coppe, M.S. \Strength and deformation of partly saturated soils", 12th Int. Con. Soil Mech. Foun. Eng., 130(3), pp. 43-46 (1989).
20. Russell, A.R. and Khalili, N. \A unied bounding surface plasticity model for unsaturated soils", Int. J. Numer. Anal. Methods. Geomech., 30(3), pp. 181-212 (2006).
21. Cheng, C.T., Wang, W.C., Xu, D.M. and Chau, K.W. \Optimizing hydropower reservoir operation using hy-brid genetic algorithm and chaos", Water Resources Management, 22(7), pp. 895-909 (2008).
22. Xie, J.X., Cheng, C.T., Chau, K.W. and Pei, Y.Z. \A hybrid adaptive time-delay neural network model for multi-step-ahead prediction of sunspot activity", Int. J. Env. Poll., 28(3-4), pp. 364-381 (2006).
23. Zhang, J. and Chau, K.W. \Multilayer ensemble pruning via novel multi-sub-swarm particle swarm optimization", J. Uni. Com. Sci., 15(4), pp. 840- 858 (2009).
24. Johari, A., Javadi, A.A. and Habibagahi, G. \Mod-elling the mechanical behaviour of unsaturated soils using a genetic algorithm-based neural network", Com-puters and Geotechnics, 38(1), pp. 2-13 (2011).
25. Ahangar-Asr, A., Johari, A. and Javadi, A.A. \An evolutionary approach to modelling the soil-water characteristic curve in unsaturated soils", Computers & Geosciences, 43, pp. 25-33 (2012).
26. Taormina, R., Chau, K.W. and Sethi, R. \Articial neural network simulation of hourly groundwater levels in a coastal aquifer system of the Venice lagoon", Eng. Appl. Artif. Intell., 25(8), pp. 1670-1676 (2012).
27. Kayadelen, C. \Estimation of eective stress param-eter of unsaturated soils by using articial neural networks", Int. J. Numer. Anal. Methods Geomech., 32(9), pp. 1087-1106 (2008).
28. Ajdari, M., Habibagahi, G. and Ghahramani, A. \Predicting eective stress parameter of unsaturated soils using neural networks", Comput. Geotech., 40, pp. 89-96 (2012).
29. Ferreira, C. \Gene expression programming: A new adaptive algorithm for solving problems", Complex Syst., 13(2), pp. 87-129 (2001).
30. Cevik, A. and Cabalar, A.F. \Modelling damping ratio and shear modulus of sand-mica mixtures using genetic programming", Expert Syst. Appl., 36(4), pp. 7749-7757(2009).
31. Mollahasani, A., Alavi, A.H. and Gandomi, A.H. \Empirical modeling of plate load test moduli of soil
via gene expression programming", Comput. Geotech., 38(2), pp. 281-286 (2011).
32. Allavi, A.H., Aminian, P., Gandomi, A.h. and Arabesmaeili, M. \Genetic-based modeling of uplift ca-pacity of suction caissons", Expert Syst. Appl., 38(10), pp. 12608-12618 (2011).
33. Calabar, A.F. and Cevik, A. \Triaxial behavior of sand-mica mixtures using genetic programming", Ex-pert Syst. Appl., 38(8), pp. 10358-10367 (2011).
34. Alkroosh, I. and Nikraz, H. \Predicting axial capacity of driven piles in cohesive soils using intelligent com-puting", Eng. Appl. Artif. Intell., 25(3), pp. 618-627 (2011).
35. Ferreira, C., Gene Expression Programming: Mathe-matical Modeling by an Articial Intelligence, Second Ed. Springere Verlag, Germany (2006).
36. Ferreira, C., What is GEP? from GeneXprotools Tuto-rials - A Gepsoft Web Resource (2010).
37. GEPSOFT. GeneXproTools. Version 4.0, http://www. gepsoft.com
38. Lee, I.M., Sung, S.G. and Cho, G.C. \Eect of stress state on the unsaturated shear strength of a weathered granite", Can. Geotech. J., 42(2), pp. 624-631 (2005).
39. Russell, A.R. and Khalili, N. \A bounding surface plas-ticity model for sands exhibiting particle crushing", Can. Geot. J., 41(6), pp. 1179-1192 (2004).
40. Rahardjo, H., Heng, O.B. and Choon, L.E. \Shear strength of a compacted residual soil from consolidated drained and constant water content triaxial tests", Can. Geotech. J., 41(3), pp. 421-436 (2004).
41. Bishop, A.W. and Blight, G.E. \Some aspects of eective stress in saturated and partially saturated soils", Geotechnique, 13(3), pp. 177-197 (1963).
42. Khalili, N., Geiser, F. and Blight, G.E. \Eective stress in unsaturated soils: review with new evi-dences", Int. J. Geomech., 4(2), pp. 115-126 (2004).
43. Rassam, D.W. and Williams, D.J. \A relationship describing the shear strength of unsaturated soils", Can. Geotech. J., 36(2), pp. 363-368 (1999).
44. Thu, T.M., Rahardjo, H. and Leong, E.C. \Eect of hysteresis on the shear strength envelopes from con-stant water content and consolidated drained triaxial tests", Unsaturated Soils, ASCE, 147(1), pp. 1212-1222 (2006).
45. Miao, L., Liu, S. and Lai, Y. \Research of soil water characteristics and shear strength of Nanyang expansive soil", Eng. Geol., 65(4), pp. 261-267 (2002).
46. Rampino, C., Mancuso, C. and Vianale, F. \Ex-perimental behavior and modeling of an unsaturated compacted soil", Can. Geotech. J., 37(4), pp. 748-763 (2000).
Biographies
Johari is Assistant Professor at Shiraz University of Technology, Civil and Environmental Engineering Department. He has been a faculty member of this University since 2009. He graduated from Shiraz University in 1995 with a BSc degree and received his Master Degree from this university in 1999. He was granted his Ph.D. degree from Shiraz University in 2006, and he was a Post-Doctoral researcher at Exeter University in 2008 and currently is a research sta of Computational Geomechanics Group of this University. His main areas of research interests are in unsaturated soil mechanics, application of intelligent systems in geotechnical engineering, probabilistic anal-ysis and reliability assessment. He has also consulted and supervised numerous geotechnical projects. Milad Nakhaee was born in Birjand, Iran, in 1986. He received his BS degree in Civil engineering from Azad University of Birjand in 2008, and now is un-dergraduate student in Geotechnical Engineering MS in Shiraz University of Technology. His research area is study on conventional soil retaining systems, using nite element method, unsaturated soils, later-ally loaded piles and articial intelligence methods. At present, he is actively involved in Geotechnical engineering projects and researches.
Ghassem Habibagahi received his PhD from Ecole Polytechnique, University of Montreal, Canada in 1990. Currently, he is a Professor of Civil Engineering at Shiraz University, Shiraz, Iran. He has authored numerous papers in the eld of geomechanics, partic-ularly in mechanics of unsaturated soils, application of intelligent systems in Geotechnical Engineering and Geoenvironmental Engineering. He is member of dif-ferent technical societies including member of TC 106 committee on unsaturated soils, international society of soil mechanics and geotechnical engineering.