Core Requirement 2.8
The number of full-time faculty members is adequate to support the mission of the institution and to ensure the quality and integrity of its academic programs.
X Compliance ___ Non-Compliance
After extensive analysis, we have determined that the University of Louisville is in compliance with SACS standard 2.8. Demonstrable evidence is provided by the following metrics: 1) faculty to student ratios; 2) faculty instructional activity determined by student credit hour production at the undergraduate, graduate and professional levels; 3) academic qualifications of faculty; and 4) faculty productivity and scholarship. In 2008, UofL implemented a new strategic plan, The 2020 Plan: Making it Happen [1], which articulates a clear mission statement with five strategic goals. UofL’s mission states that “the University of Louisville shall be a premier, nationally recognized metropolitan research university with a commitment to the liberal arts and sciences and to the intellectual, cultural, and economic development of our diverse communities and citizens.” The 2020 Plan is highly focused and addresses the five critical areas of the university’s mission:
• Educational Excellence
• Research, Scholarship, and Creative Activity • Community Engagement
• Diversity, Opportunity, and Social Justice • Creative and Responsible Stewardship
UofL’s 2020 Plan states a firm commitment to accountability, transparency, and the demonstration of institutional effectiveness across the university community. Institutional accountability is demonstrated by continuous quality assessment though the creation of metrics with measurable performance goals. The university manages the assessment of our institutional performance through the use of a university-wide scorecard [2] and academic and administrative unit-level scorecards. UofL’s Board of Trustees completes an annual assessment of our institutional performance based on fourteen overarching metrics, which is the culmination of the specific and measurable goals for academic and administrative units. Of the 14 metrics, three pertain to research, scholarship, and creative activity of faculty. Contributions of individual
departments and programs to the achievement of the strategic goals are assessed on a continual basis and are used in decisions regarding the allocation of resources.
Instructional Capacity
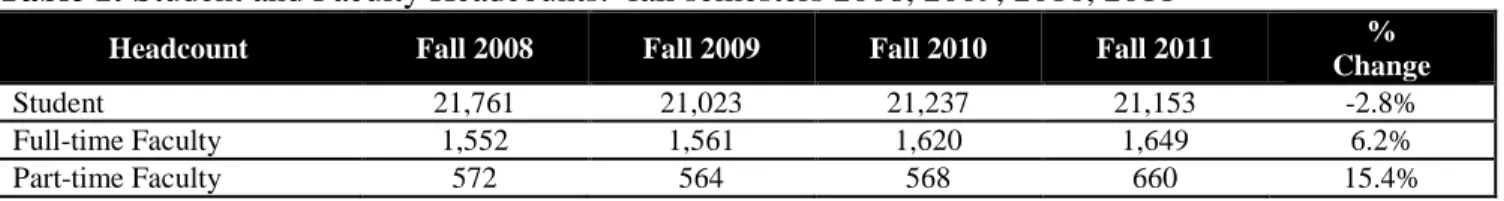
Two analyses support that UofL employs a sufficient number of full-time faculty to support its mission. Table 1 details the student and faculty headcounts for 2008, 2009, 2010, and 2011. As shown, the student headcount remained stable while the full-time faculty headcount increased by 6.2% and the part-time faculty headcount increased by 15.4%. UofL experienced an overall increase in the number of faculty as compared to changes in student enrollment during this period of time.
Table 1: Student and Faculty Headcounts: fall semesters 2008, 2009, 2010, 2011
Headcount Fall 2008 Fall 2009 Fall 2010 Fall 2011 % Change
Student 21,761 21,023 21,237 21,153 -2.8%
Full-time Faculty 1,552 1,561 1,620 1,649 6.2%
Part-time Faculty 572 564 568 660 15.4%
Source: UofL’s official student enrollment and faculty/staff census files
Despite significant financial constraints, UofL budgeted funds for new faculty hires in fiscal years 2008-2009 (fall 2008), 2010-2011 (fall 2010), and 2011-2012 (fall 2011). The 2008-2008-2009 operating budget included $1.5 million to fund the recruitment of 15 new faculty. The primary goal of these hires was to enhance the institution’s research agenda. The 2010-11 operating budget allocated $200,000 to support two new faculty positions, one in the J.B Speed School of Engineering and another position in the Brandeis School of Law. The 2011-2012 operating budget included $250,000 to fund new tenure-track faculty positions in the College of Arts and Sciences to support its effort to achieve a Phi Beta Kappa charter. Seven positions were either created or enhanced in departments as diverse as Anthropology, Classical and Modern Languages, Communications, Humanities, Mathematics, Philosophy, and Political Science. The 2011-2012 budget also included $1.4 million to support the recruitment of approximately 14 new research active faculty positions.
UofL’s student-faculty ratios, calculated on an FTE basis, are comparable to other SACS-accredited benchmark institutions, as well as to the University of Kentucky. These institutions share UofL’s institutional academic profile of offering research and professional degrees in addition to holding the Carnegie Foundation for the Advancement of Teaching’s basic classification of RU/VH: Research Universities (very high research activity) [3].
Table 2 compares UofL’s student FTE to faculty FTE ratios with those of its SACS-accredited institutional benchmarks and the University of Kentucky, the largest postsecondary research institution in Kentucky. The table shows data from fall 2008 to fall 2010, drawing from the Integrated Postsecondary Education Data System (IPEDS) Peer Analysis Tool. Data for fall 2011 were not available at the time the analysis was completed. UofL’s student FTE to faculty FTE ratio was lower than the median FTE ratio of comparable institutions for each of the three academic years reported. The student FTE to faculty FTE ratio for UofL, 10.00 in 2008 and 9.95 in 2010, were between the first quartile (9.87 in 2008 and 9.34 in 2010) and the median (10.96 in 2008 and 10.81 in 2010). In 2009, the student FTE to faculty FTE ratio for UofL was 10.13. This placed UofL between the minimum (5.85) and the first quartile (10.34) of all of our benchmark institutions. Three of UofL’s five SACS benchmark institutions show higher ratios (Virginia Commonwealth University, University of South Carolina – Columbia, and University of South Florida – Main Campus), with two showing lower ratios, specifically the University of Alabama at Birmingham and the University of North Carolina at Chapel Hill. These results indicate that UofL’s student-faculty FTE ratios are comparable to other SACS-accredited institutions.
Table 2: Student FTE1 ratio to faculty FTE2 ratio comparison with SACS-accredited benchmark institutions and the University of Kentucky
Institution Name (ordered alphabetically) SACS institutions 2010 Student FTE to Faculty FTE Ratio 2009 Student FTE to Faculty FTE Ratio 2008 Student FTE to Faculty FTE Ratio
Stony Brook University 12.30 12.52 12.55
Temple University 13.92 13.47 13.37
University at Buffalo 14.75 14.40 14.11
University of Alabama at Birmingham 6.71 6.57 6.21
University of California - Irvine 12.56 12.41 12.12
University of California - San Diego 10.64 10.54 10.98
University of Cincinnati - Main Campus 10.81 10.55 9.85
University of Illinois at Chicago 10.76 10.34 9.92
University of Iowa 10.60 10.80 10.64
University of New Mexico - Main Campus N/A 10.42 N/A
University of North Carolina at Chapel Hill 8.06 8.29 8.33
University of Pittsburgh – Pittsburgh Campus 5.11 5.85 5.64
University of South Carolina - Columbia 16.18 15.64 14.58
University of South Florida - Main Campus 21.47 21.59 21.76
University of Utah 8.08 7.70 N/A
Virginia Commonwealth University N/A 10.86 N/A
Wayne State University 10.99 11.10 10.94
University of Kentucky (UK)5 10.93 10.86 11.02
University of Louisville (UofL)5 9.95 10.13 10.00
Minimum 5.11 5.85 5.64
1st quartile 9.34 10.34 9.87
Median 10.81 10.80 10.96
3rd quartile 13.24 12.52 13.16
Maximum 21.47 21.59 21.76
Source: IPEDS Peer Analysis Tool 1
The IPEDS formula for the calculation of student FTE is: (1 x full-time headcount) + (0.403543 x undergraduate part-time headcount) + (0.600000 x first-professional part-time headcount) + (0.361702 x graduate part-time headcount).
2
The IPEDS formula for the calculation of faculty FTE is: (1 x full-time headcount) + ((1/3) x part-time headcount). 3
The Human Resources component of IPEDS is optional reporting for institutions during even numbered years. 4
The student enrollment data reported to IPEDS exclude the following student classifications: auditor, post-doctoral students, house staff, and students enrolled in international programs.
5
UK and UofL are excluded from the five number summary.
Faculty Instructional Activity
Further assurance of the adequacy of faculty resources is provided by the requirement of the Kentucky Council on Postsecondary Education (CPE) and the UofL Board of Trustees that adequate faculty resources be demonstrated before approval of any new degree program [4]. Projections of estimated student and faculty headcounts for any new proposed programs are required. These projections are reviewed by unit faculty, the Faculty Senate, CPE staff and university administrators for consistency with standard academic practice. Other public higher education institutions in Kentucky may also review and comment on
proposals for new degree programs in an effort to promote collaboration and reduce program duplication as required by state law.
At least two-thirds of the total student credit hours generated at all academic career levels are produced by full-time faculty. The student credit hour (SCH) production analysis comparing fall semesters from 2008 to 2011 documents this trend. Full-time employees holding a primary appointment as administrators or professional staff (and teach part-time) are classified as part-time faculty. Table 3 highlights the
distribution of student credit hours taught by full-time and part-time faculty by class level for the four years under review analysis. The fall semester is UofL’s official reporting semester and was used within the analysis. See Appendix A for analysis of SCHs by academic unit, class level, and class location. [5]
Table 3: Percent of student credit hour (SCH) production by faculty status and class level1 for the fall semesters of 2008, 2009, 2010, 2011
Semester
Undergraduate SCH2 Graduate SCH Professional3 SCH Full-time Faculty Part-time Faculty Full-time Faculty Part-time Faculty Full-time Faculty Part-time Faculty Fall 2008 70% 30% 82% 18% 91% 9% Fall 2009 71% 29% 80% 20% 88% 12% Fall 2010 69% 31% 81% 19% 90% 10% Fall 2011 70% 30% 83% 17% 87% 13% % change 0% 0% 1% -1% -4% 4%
Source: UofL’s official university course census files
Note: Student credit hours are calculated by multiplying the total course enrollment by the course credit hour. Graduate assistants who are designated as the instructor of record are included as part-time faculty.
1Determined by the academic career level of the class as indicated within PeopleSoft. 2
Total includes general education student credit hours.
3Defined as classes offered in the School of Medicine, Brandeis School of Law, and School of Dentistry.
The general education program at the University of Louisville fosters active learning by asking students to think critically, to communicate effectively, and to understand and appreciate cultural diversity. General education students establish foundations in the following content areas: arts and humanities, mathematics, oral and written communication, social and behavioral sciences, and natural sciences. Students also acquire a competency in cultural diversity through work in the content areas. UofL’s instructional faculty members are committed to a general education program that emphasizes critical reasoning, and faculty participate liberally in general education instruction, which helps support UofL’s Quality Enhancement Plan (Ideas to Action, i2a) [6], approved for the 2007 SACS reaffirmation. i2a was developed based upon critical thinking skills instruction introduced in the general education program and integrated throughout the coursework of a student’s academic major. The application of critical thinking skills is demonstrated and evidenced by a discipline-specific culminating undergraduate experience (CUE) taken just prior to graduation.
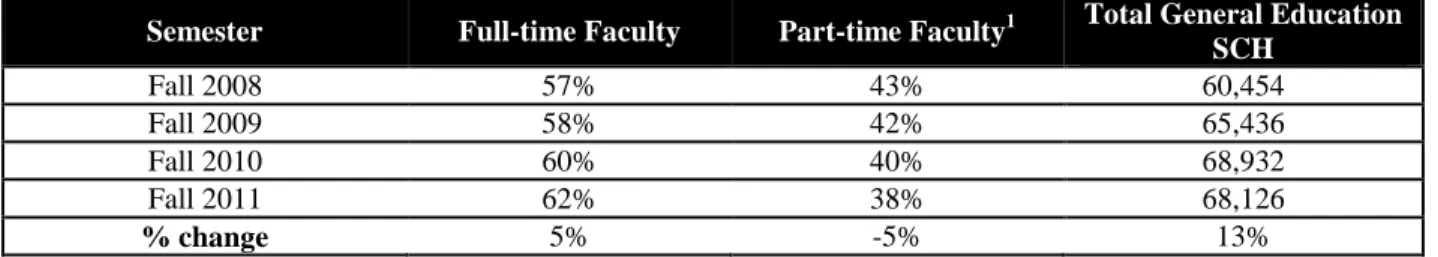
In order to demonstrate that students have access to a sufficient number of full-time faculty in general education, an analysis was conducted of student credit hours for this component of undergraduate education. Table 4 shows the total number of general education credit hours generated by full-time and part-time faculty during the fall semesters of 2008 to 2011.
Table 4: Total and percent general education student credit hours generated by full- and part-time faculty during the fall semesters 2008, 2009, 2010, 2011
Semester Full-time Faculty Part-time Faculty1 Total General Education SCH Fall 2008 57% 43% 60,454 Fall 2009 58% 42% 65,436 Fall 2010 60% 40% 68,932 Fall 2011 62% 38% 68,126 % change 5% -5% 13%
Source: UofL’s official course census files
1Includes graduate teaching assistants.
The university has three primary instructional sites: 1) the main instructional site is the Belknap campus; 2) the Health Sciences Campus, located in downtown Louisville in the city’s main medical complex, houses the Schools of Dentistry, Medicine, Nursing, and Public Health and Information Sciences; 3) the Shelby Campus location in eastern Louisville Metro/Jefferson County is undergoing transformation into a technology and biosciences site. UofL also offers courses in various off-campus locations in Jefferson County, including several local high schools, but also at Fort Knox, Kentucky, providing educational programs to members of the U.S. Armed Forces; Owensboro, Kentucky, at Brescia University (social work); the Owensboro Medical Center (Owensboro, Kentucky); and in Madisonville, Kentucky, at the Trover Campus of the School of Medicine. Students also earn UofL credit in various locations across the United States via online education as well as in Germany (business and engineering), Russia (business) and Panama (arts and sciences, education and engineering) [7].
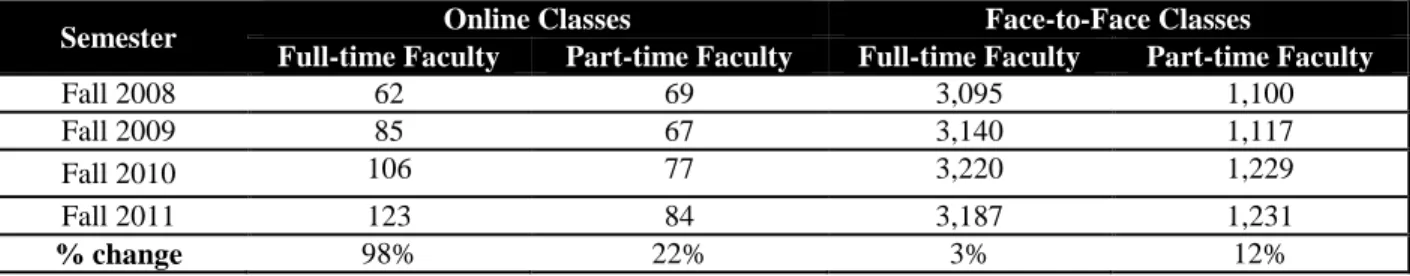
The Internet has come to accommodate the greatest portion of student credit hours earned off-campus. Some programs are offered completely online while others are a blend of face-to-face and online classes. The number of UofL students taking exclusively online classes has increased by 28% from fall 2008 (n = 699 students) to fall 2011 (n = 894 students). During this same time period, the percentage of UofL students taking both online courses and face-to-face courses increased by 28% from 1,339 students in fall 2008 to 1,720 students in fall 2011. Table 5a details student enrollments for the fall semesters of 2008 to 2011 by class delivery method. Table 5b provides course data by delivery method and faculty for this same time period.
Table 5a: Student enrollment by class delivery method for the fall semesters of 2008, 2009, 2010, 2011
Semester Online Classes Only
Online Classes and Face-to-Face Classes Face-to-Face Classes Only Total University Enrollment1 Fall 2008 699 1,339 19,026 21,064 Fall 2009 711 1,462 19,160 21,333 Fall 2010 833 1,579 19,164 21,576 Fall 2011 894 1,720 18,885 21,499 % change 28% 28% -1% 2%
Source: UofL’s official course census files 1
Total university enrollment excludes post-doctoral students and house staff.
Table 5b: Courses by delivery method for the fall semesters of 2008, 2009, 2010, 2011 taught by Faculty Status
Semester Online Classes Face-to-Face Classes
Full-time Faculty Part-time Faculty Full-time Faculty Part-time Faculty
Fall 2008 62 69 3,095 1,100
Fall 2009 85 67 3,140 1,117
Fall 2010 106 77 3,220 1,229
Fall 2011 123 84 3,187 1,231
% change 98% 22% 3% 12%
Source: UofL’s official course census files
The University’s Delphi Center for Teaching and Learning [8], the unit charged with providing support for faculty and students involved in distance learning, monitors distance learning offerings. The Delphi Center offers a wide variety of services to faculty, which includes one-on-one consultations; professional
development training; and instructional design support to establish both a qualified cadre of faculty teaching online courses and quality online pedagogy.
Faculty Qualifications
A measure of full-time faculty adequacy and sufficiency is the percentage of faculty with terminal degrees. UofL participates annually in the US News and World Report’s Survey of Best Colleges. One factor used to rank institutions is the percent of full-time faculty with terminal degrees. Table 6 summarizes the results of this survey for UofL, UofL’s benchmark institutions, and the University of Kentucky for the past 4 years. From 2008 to 2011, UofL fell beneath the median percent of faculty with a terminal degree; however, the median for these institutions slightly decreased from 90% to 89%. There was no net change in the percent of full-time faculty with a terminal degree from 2008 to 2011 for eight of the 19 institutions, and three of the 19 institutions experienced a negative net change. UofL was one of the eight institutions that experienced a net 1% to 3% increase in the percent change of the number of full-time faculty with a terminal degree. Additionally, during this same time period, the number of full-time faculty at UofL increased by 6.2% (see Table 1).
Table 6: Percent of full-time faculty with terminal degree1 at UofL, benchmark institutions, and the University of Kentucky2 Institution SACS benchmark 2008 2009 2010 2011 Net change (2008-2012)
SUNY-- Stony Brook × 84% 84% 85% 85% 1%
SUNY--University at Buffalo × 85% 87% 87% 87% 2%
Temple University × 73% 73% 74% 76% 3%
University of Alabama--Birmingham 97% 97% 97% 97% 0%
University of California--Irvine × 90% 91% 93% 93% 3%
University of California--San Diego × 93% 93% 93% 94% 1%
University of Cincinnati × 99% 99% 99% 99% 0%
University of Illinois--Chicago × 91% 91% 90% 90% -1%
University of Iowa × 98% 98% 98% 98% 0%
University of New Mexico × 84% 85% 85% 84% 0%
University of North Carolina - Chapel Hill 98% 97% 97% 97% -1%
University of Pittsburgh × 92% 90% 89% 89% -3%
University of South Carolina--Columbia 88% 88% 87% 88% 0%
University of South Florida 97% 97% 97% 97% 0%
University of Utah × 86% 85% 86% 87% 1%
Virginia Commonwealth University 84% 83% 84% 84% 0%
Wayne State University × 76% 76% 76% 78% 2%
University of Kentucky 90% 91% 91% 90% 0%
University of Louisville 84% 84% 84% 85% 1%
Median Percent of Benchmark Institutions 90% 90% 89% 89% -1%
1
Institutions are asked to provide the total number of full-time instructional faculty with a terminal degree. A terminal degree is defined as a doctorate or the highest degree in a field.
2
Source: US News and World Report’s America’s Best Colleges. The data are published in the next year’s edition. For example, 2011 data are published in the 2012 Edition.
Faculty Productivity and Scholarship
Several processes ensure that collective faculty productivity is consistent with institutional mission and goals and that the quality and integrity of the academic programs are maintained:
• Annual reviews with faculty work plans
• Academic Program Review [9] [10a] [10b] [11]
• Student Learning Outcomes (SLOs) annual report [12] [13] [14]
• Appropriate committees -- department, unit, and, at the university level, the Undergraduate Council and the Graduate Council -- review and approve all curriculum and program changes and new degree program proposals and make recommendations to the Provost [15]
In order to manage faculty work effort and to ensure consistency with the mission of the institution, each faculty member collaborates with his or her department chair/head or appropriate supervisor to develop an annual work plan, which is submitted to the respective dean for approval. As specified by The Redbook [16], which is the institution’s official statement of the organizational structure, rules of governance and procedures, and University-wide policies, work plans allocate effort into teaching, research, service, and other institution obligations, usually on a percentage of effort basis. These plans may be revised when circumstances warrant, such as increased teaching needs in a department, supervising or mentoring
graduate students, student research, service on dissertation committees, the funding of a grant proposal, or increased service obligations.
Annual merit reviews are based on the annual work plan with most weight given to areas with greatest allocation of work effort. Minimum guidelines for such reviews are provided by The Redbook, although specific criteria in teaching, research/creative effort, and service are developed and approved by faculty within each unit or department. As academic head of the unit, each dean is responsible for ensuring that the aggregated work effort achieves the mission of the unit and is consistent with the mission of the entire institution. In addition to annual merit reviews, promotion and tenure reviews are also based on the extent to which the annual work plan is fulfilled.
Faculty serve on department, unit, and university-level committees, including the Undergraduate Council and the Graduate Council committees, to review and approve all curriculum and program changes, student learning outcomes, new degree program proposals and make recommendations to the executive vice president and university provost. All of these activities insure the quality and integrity of the academic programs.
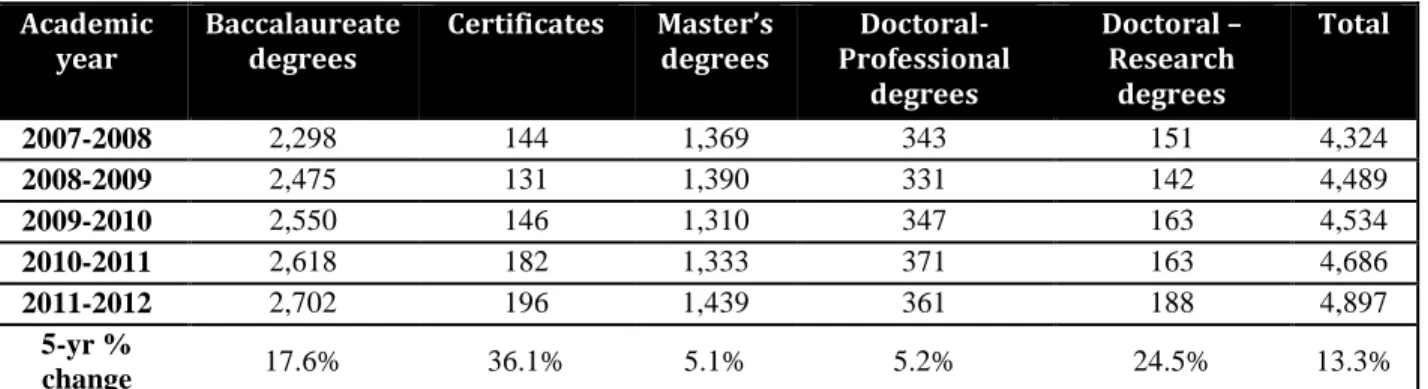
The institution closely tracks its progress in achieving the goals of the 2020 plan. In addition to individual faculty reviews, the university scorecard and academic unit-level scorecards track the performance of each unit’s faculty with specific measures [17]. Evidence of progress is an increase in the number of
baccalaureate degrees awarded from 2,298 in 2007-2008 to 2,702 in 2011-2012, while the six-year graduation rate increased from 45.7% to 52.1% during the same time period. In addition, the number of doctoral awards has increased from 142 in 2008-2009 to 188 in 2011-2012 (see Table 7).
Table 7: Degrees* conferred in academic years 2007-2008, 2008-2009, 2009-2010, 2010-2011, and 2011-2012
Academic
year Baccalaureate degrees Certificates Master’s degrees Professional Doctoral- degrees Doctoral – Research degrees Total 2007-2008 2,298 144 1,369 343 151 4,324 2008-2009 2,475 131 1,390 331 142 4,489 2009-2010 2,550 146 1,310 347 163 4,534 2010-2011 2,618 182 1,333 371 163 4,686 2011-2012 2,702 196 1,439 361 188 4,897 5-yr % change 17.6% 36.1% 5.1% 5.2% 24.5% 13.3%
* Associate degree data are: 19 in 2007-2008, 20 in 2008-2009, 18 in 2009-2010, 19 in 2010-2011, and 11 in 2011-2012. Specialist degrees are included in the Master’s degree counts. Source: UofL’s official degree census file.
As one of 108 Carnegie Level RU/VH (very high research activity) universities, UofL maintains a strong commitment to the support of faculty research activities. The university tracks specific economic
development and entrepreneurial metrics on an annual basis as evidence of success in achieving the goals of the research mission. Table 8 documents progress for selected measures from 2008 to 2012. Evidence of success in achieving UofL’s research mission is an increase in research expenditures from $148.9 million in 2008 to $195.5 million in 2012 and an increase in licensing agreements from 73 in 2008 to 104 in 2011. As noted above, the university has hired new research focused faculty in this time period and, coupled with support for existing faculty, has seen significant increases for these metrics.
Table 8: Research Scorecard Indicators: 2008, 2009, 2010, and 2011
University Scorecard Indicators 2008 2009 2010 2011
Startup companies (cumulative) 22 27 31 36
Patents (cumulative) Applications filed 710 871 1,053 1,203
Formal patents issued 130 138 156 190
License option agreements (cumulative) 73 85 91 104
Research expenditures $148.9M $146.9M $188.3M $195.5M
Endowed chairs and professorships 131 134 141 145
An additional metric on the university-wide scorecard calls for an increase in the number of faculty peer-reviewed publications (articles in high impact journals, university presses, academic publishing houses, or other outlets for peer-reviewed scholarship). Scholarly publications included in this measure are to be from peer-reviewed publications within a researcher’s academic discipline and approved by the submitting academic unit dean and/or chair. Data are submitted and aggregate totals of peer-reviewed publications are maintained by the Office of the Executive Vice President of Research & Innovation. For 2009 to 2010, UofL experienced at 25.3% increase in the number of peer-reviewed publications, with that number increasing an additional 35.3% in 2011. Academic units are also asked to document the number of faculty creative activities in premier venues. Creative activity is defined as achieving recognition by professional peers as documented by awards, reviews, citation patterns, and other discipline-specific measures of impact and quality. Although subjective, the number of creative activities in premier venues increased by 8.2% for the period of 2010 to 2011 and 41.8% from 2011 to 2012.
The University of Louisville contributes to the community and society through teaching, research, and service. The Office of Community Engagement was established to facilitate the use of university resources to support existing partnerships and to engage new partners to contribute to the educational, social, and economic progress of the community, region, and state. It is also responsible for developing a process to evaluate the effectiveness of existing and new university/community partnerships.
UofL recently celebrated five years of teamwork and community improvement through its Signature
Partnership initiative. The Signature Partnership is focused on creating, enhancing, and launching programs designed to eliminate or reduce disparities that West Louisville residents experience in education, health, economic development, and social services. Faculty, students, and staff from across the university have been involved in the Signature Partnership. Since 2007, more than 3,000 UofL students and more than 400 faculty and staff have worked with 79 community partnerships to provide services that benefited West Louisville residents.
In 2007, UofL applied and in 2008 was awarded the Carnegie Foundation for the Advancement of
Teaching’s Community Engagement classification in the category of curricular engagement and outreach and partnerships. UofL is slated for renewal in 2014.
The qualifications and sufficiency of the full-time faculty at UofL insure the ability to meet the accrediting standards of multiple external agencies [18]. After an extensive analysis, UofL concludes that SACS standard 2.8 is met. These analyses show that our student FTE to faculty FTE ratios are stable and
comparable to our SACS-accredited peers; faculty instruction is well diversified among our programs, with full-time faculty teaching the great majority of classes and online instruction treated as comparable to face-to-face. The percent of faculty with terminal degrees is comparable with benchmark institutions. The university implements a systematic work allocation plan to manage faculty allocation among teaching, research, and service activities. While academic programs are maintained at a high level of quality and integrity, faculty members have also succeeded in measures such as greater numbers of scholarly
publications, increased research grant funding, and an expanded range of service activities. These analyses demonstrate that the number of full-time faculty members adequately supports the university’s mission.
[1] UofL’s 2020 Plan: Making It Happen
http://louisville.edu/president/2020plan 2_8_fn01.pdf [2] University Scorecard http://louisville.edu/provost/planning/University%20Scorecard%20rev.%203.5.10.xls/view 2_8_fn02.pdf
[3] Carnegie Foundation for the Advancement of Teaching Classification, Institutional Profile
http://louisville.edu/institutionalresearch/accreditation/carnegie-foundation-classification.html
2_8_fn03.pdf
[4] Kentucky Council on Postsecondary Education
http://cpe.ky.gov/policies/academicpolicies/AcPrograms.htm 2_8_fn04.pdf
[5] 2.8 SACS Template, Appendix A 2_8_fn05.pdf
[6] Quality Enhancement Plan (QEP), Ideas to Action (i2a)
Ideas to Action. i2a
2_8_fn06.pdf
[7] UofL’s Instructional Sites 2_8_fn07.pdf
[8] Delphi Center for Teaching and Learning
http://louisville.edu/delphi
2_8_fn08.pdf
[9] Academic Program Review Instructions 2_8_fn09.pdf
[10a] Academic Program Review Template, Full/Ten-Year Progressand Fifth-Year Progress 2_8_fn10a.pdf
[10b] Academic Program Review Template, Fifth-Year Progress 2_8_fn10b.pdf
[11] Academic Program Review, Statistical Overview 2_8_fn11.pdf
[12] Student Learning Outcomes: Integrated Assessment of Student Learning 2_8_fn12.pdf
[13] Instructions for Student Learning Outcomes Annual Report Process 2_8_fn13.pdf
[14] Revised Reporting Template for Student Learning Outcomes Annual Report Process 2_8_fn14.pdf
[15] Academic Program Review Flow chart 2_8_fn15.pdf
[16] The Redbook (Sec. 4.3.1.A)
http://louisville.edu/provost/redbook/chap4.html#4a3s1 2_8_fn16.pdf [17] University Scorecard http://louisville.edu/provost/planning/University%20Scorecard%20rev.%203.5.10.xls/view 2_8_fn17.pdf 10
[18] External Accreditation by Program 2_8_fn18.pdf
2.8 Data Definitions
The following definition of terms will assist in a review of information for this requirement: Full-time Instructional Faculty (IPEDS)
IPEDS defines faculty as follows: Persons identified by the institution as such and typically those whose initial assignments are made for the purpose of conducting instruction, research or public service as a principal activity (or activities). They may hold academic rank titles of professor, associate professor, assistant professor, instructor, lecturer or the equivalent of any of those academic ranks. Faculty may also include the chancellor/president, provost, vice provosts, deans, directors or the equivalent, as well as associate deans, assistant deans and executive officers of academic departments (chairpersons, heads, or the equivalent) if their principal activity is instruction combined with research and/or public service. The designation as faculty is separate from the activities to which they may be currently assigned. For example, a newly appointed president of an institution may also be appointed as a faculty member. Graduate, instruction, and research assistants are not included in this category. For UofL, IPEDS faculty refers to the category, based upon their primary appointment as defined by their administrative or academic home
department. The IPEDS terminology is not used to identify only those employees providing instruction. A faculty member may or may not provide instruction during any given semester. REDBOOK , Chapter 4 - Faculty Excerpts
Full-Time Faculty
A. Term faculty may be appointed for a contract period not to exceed 3 years. Such
appointments shall not be tenurable. No term contract, continuation, or renewal shall result in the acquisition of tenure or imply renewal for subsequent terms.
B. All persons with full-time faculty appointments who are appointed for at least one year and a part of whose work for the current year is in a particular academic unit shall be members of its faculty except in the case of those units which define faculty membership differently in their by-laws. The Board of Trustees shall be responsible for the appointment of all full-time faculty members. It may make these appointments on the recommendation of the President of the University or it may delegate appointing authority to the President. Tenure is the right of certain time faculty personnel who hold academic rank to continuous full-time employment without reduction in academic rank until retirement or termination as provided in Sec. 4.5.3
Part-time faculty shall be appointed by contract to teach specified courses or to engage in specified instruction, research or service less than full time for a designated period. No such appointment, continuation, or renewal thereof shall result in acquisition of tenure or implied renewal for subsequent periods.
Graduate Assistant (GA)
Graduate-level students employed on a part-time basis, not limited to, but often employed for the primary purpose of assisting in classroom or laboratory instruction or in the conduct of research. Graduate students having titles such as graduate assistant, teaching assistant, teaching associate, teaching fellow, service or research assistant typically hold these positions. (Source: IPEDS) In most cases at the university, graduate assistants are not listed as the instructor of record. The majority of graduate teaching assistants (GTA) serve as support for labs, grading, or tutoring. However, there can be wide variances based on academic unit.
Course
Courses are defined by the subject, catalog, and section number (e.g., Math 111-01). Sub-sections, such as labs and recitations, are excluded.
Definition of metric: faculty publications and scholarly activity
2.3a. Increase number of faculty peer-reviewed publications (articles in high-impact journals, university presses, academic publishing houses, or other outlets for peer-reviewed scholarship) (calendar year).
Scholarly publications included in this measure need to be from peer-reviewed publications within a researcher’s academic discipline and approved by the submitting academic unit dean and/or chair. Specific acknowledgement of top-tier will be determined by the Provost or her designee.
Definition of Metric: Faculty creative activities
2.3b. Increase the number of faculty creative activities in premier venues (academic year)
Creative activity must achieve recognition by professional peers as documented by awards, reviews, citation patterns, and other discipline-specific measures of impact and quality. Unit Deans and Department Chairs will submit all faculty creative activities. Specific acknowledgement of premier venue will be determined by the Provost or her designee. Only creative activities from the School of Music and select departments of the College of Arts and Sciences will be included.