Impact of Content Delivery Networks on service and
content innovation
Patrick Maill´
e, Bruno Tuffin
To cite this version:
Patrick Maill´
e, Bruno Tuffin. Impact of Content Delivery Networks on service and content
innovation. NetEcon 2015 : the 10th Workshop on the Economics of Networks, Systems and
Computation, Jun 2015, Portland, United States. pp.1 - 4, 2015.
<hal-01217929>
HAL Id: hal-01217929
https://hal.archives-ouvertes.fr/hal-01217929
Submitted on 20 Oct 2015
HAL
is a multi-disciplinary open access
archive for the deposit and dissemination of
sci-entific research documents, whether they are
pub-lished or not.
The documents may come from
teaching and research institutions in France or
abroad, or from public or private research centers.
L’archive ouverte pluridisciplinaire
HAL
, est
destin´
ee au d´
epˆ
ot et `
a la diffusion de documents
scientifiques de niveau recherche, publi´
es ou non,
´
emanant des ´
etablissements d’enseignement et de
recherche fran¸cais ou ´
etrangers, des laboratoires
publics ou priv´
es.
Impact of Content Delivery Networks on service and
content innovation
Patrick Maillé
Institut Mines-Telecom, Telecom Bretagnepatrick.maille@telecom-bretagne.eu
Bruno Tuffin
Inriabruno.tuffin@inria.fr
ABSTRACT
Content Delivery Networks (CDNs) are major actors of the current telecommunication ecosystem. Our goal in this pa-per is to study their impact on other actors of the sup-ply chain, especially on content innovation which is a key concern in the network neutrality debate where CDNs’ role seems forgotten. Our findings indicate that vertically in-tegrating a CDN helps Internet Service Providers (ISPs) collect fees from Content Providers (CPs), hence circum-venting the interdiction of side payments coming from net-neutrality rules. However, this outcome is socially much better in terms of user quality and innovation fostering than having separate actors providing the access and CDN ser-vices: in the latter case double marginalization (both ISP and CDN trying to get some value from the supply chain) leads to suboptimal investments in CDN storage capacities and higher prices for CPs, resulting in reduced innovation.
Categories and Subject Descriptors
C.2.3 [Computer Systems Organization]: Computer-Communication Networks—Network Operations
General Terms
Economics, Neutrality, CDNs, Innovation
1.
INTRODUCTION
Content Delivery Networks (CDNs) are organizations of large distributed systems of servers positioned at the edges of the Internet network. Thanks to this placement of servers closer to users, content can be delivered with higher avail-ability and better performances. In addition, because the most downloaded content is often chosen to be cached at the edges, the load on the Internet network is reduced.
CDNs have become key player of the Internet, serving an important proportion of content [7]. For example Akamai, one of the leaders, manages a network of around 170,000 servers worldwide and has made a revenue of more than US$1.5 billion in 2013.
While there is a lot of research activity on CDN caching strategies at servers from a technical point of view [1], the activity on CDN economics is more limited and rather fo-cuses on price optimization strategies for the CDN [4, 5], or on cost-minimizing CDN cache deployment strategies in
Copyright is held by author/owner(s).
Internet AS-level topologies [3]. Very few works exist on the other hand on the economic impact of CDNs on the whole Internet ecosystem. Though, this economic impact is worth studying, especially in the era of the vivid network neutrality debate. Among the focuses of this debate are the payments from distant content providers (CPs) to ISPs (the so-calledside payments), with service differentiation–if not blocking–when those payments are not settled. This threat has triggered a lot of reactions and discussions about how the network should be ruled, and the FCC took a strong stance in February 2015 to prevent such practices. But sur-prisingly, CDNs have not been included in the debate, while they ease the pressure on ISPs (one of the claims of ISPs being that they could not afford upgrading the capacity of their network without side payments from CPs whose flows saturate their links) and could on the other hand themselves introduce some differentiation, which may look unfair and against the neutrality principles (although not against recent rules). This issue is discussed in [6]. In [8], the impact of economic strategies of a CDN is investigated and illustrated to indeed lead to differences of treatment among CPs.
One of the main arguments of neutrality proponents is that side payments from ISPs would reduce content innova-tion because of an increased economic strain. We particu-larly aim in this paper at investigating the impact of CDN on content innovation (for example, content was considered fixed in [8]). The questions we would like to answer are: 1) What is the impact of CDNs on content innovation with respect to a no-CDN situation? 2) What is the impact on other actors (ISPs, demand from users, quality)? 3) Should ISPs propose their own CDN service and would that replace the side payments without breaking the neutrality rules? 4) What is the best solution for content providers and users, an integrated CDN or an independent one not colluding with ISPs?
The next sections propose a model to answer those ques-tions, where we analyze and compare three cases: no CDN, a vertically integrated CDN (or in other words, a CDN col-laborating with the ISP), and a non-cooperative interaction between a CDN and an ISP. The non-cooperative CDN be-ing an intermediary between CPs and the ISP, the case when it has no storage capacity is also considered for comparison purposes.
The rest of the paper is organized as follows. Section 2 presents the model that we will use, Section 3 describes the outcomes of the three different situations and the order of decisions, and Section 4 tries to answer the above questions by analyzing the respective outcomes.
2.
MODEL
We consider the model displayed in Figure 1 representing the supply chain and relations between the main actors of the Internet: content/application providers, CDNs, ISPs, and end users.
Content/Applications (massn)
ISPs
No service
Set of end users (massD)
CDN q
p
Figure 1: Representation of relations between users, ISPs, CDN and CPs
Users and content providers are treated as a continuum, meaning that no individual user (or individual piece of con-tent) has an impact on the system (i.e., they are assumed infinitesimal).
Figure 1 also displays the payments: CPs pay the CDN for delivering content (subscription priceqper unit of content), users pay ISPs for access (subscription pricep per unit of users). In this formulation, the price paid by CPs to CDNs is independent of the content being cached or not; indeed, CPs are not clearly aware of what is cached, they pay the CDN for delivering their content, but the CDN has a posi-tive externality in caching content, since increasing quality and as an indirect consequence the number of customers. In turn, this may also induce more CPs subscribing to the ser-vice. Another induced assumption in our model is that ISPs let CDNs freely install servers at the edge of their network, a situation observed in practice for some ISPs with CDNs reducing the load on ISPs’ architecture and that content providers only deal with CDNs.
The next subsections characterize the behavior of each of the four classes of actors described in Figure 1.
2.1
Users
We consider a standard discrete choice model, more ex-actly alogitone, for both (infinitesimal) end users and CPs, having the choice between subscribing to the service or not. The choice is then between two options, made of a valua-tion for each opvalua-tion plus a Gumbel random variable (r.v.). More on this type of user modeling can be found in [2]; it is adapted here to our context.
For an end user, the (random) valuation for subscribing to the service is assumed to be
vu=kln(1/p) + lnQ+ lnn+κs,
to be compared to the valuation for choosing no service:
kln(1/p0) +κ0. In this formulation,
• κs and κ0 are i.i.d. Gumbel random variables
repre-senting variations among users in the service percep-tion;
• the valuation decreases with the service pricep,kbeing a sensitivity parameter that we assume strictly larger than1;
• it also increases with the qualityQper download and the massnof content. Indeed, better quality and more choices of content induce an increased level of satisfac-tion.
The logarithm function that we use comes from the Weber-Fechner law describing the relationship between the magni-tude of a physical stimulus and its perceived intensity within the human sensory system, that was also observed to be valid for quality perception of network services [10].
The probability of choosing to subscribe is then (see [2] for details) (1/p)(1kQn/p)+(1kQn/p
0)k,that we multiply byD, the fixed base mass of users, to get the mass dof end users actually subscribing: d=D (1/p) kQn (1/p)kQn+ (1/p 0)k . (1)
2.2
Content/Applications
Like for users, we consider a discrete-choice model for CPs; the valuation for subscribing to the (CDN) service is here
vc = lln(1/q) + lnd+κc, that is compared to the
valua-tion of no subscripvalua-tion: lln(1/q0) +κ0. Again, κc and κ0
are independent Gumbel random variables still represent-ing the variations among content providers. The valuation decreases with price q, lbeing a sensitivity parameter (as-sumed strictly above 1), and increases with the mass d of end users because more end users induces more business op-portunities. There is no direct dependence on quality here (the quality is experienced by users), but an indirect one because a better quality means more customers.
If the base mass of CPs isN, the actual mass of CPs in action is n=N (1/q) l d (1/q)ld+ (1/q 0)l . (2)
It is this quantitynthat we will consider as an indicator for innovation.
2.3
ISP’s utility
We consider a single ISP. Its utility is its revenue:
Ri=dp. (3)
Operational costs are assumed negligible, and the infras-tructure already existing. The goal of the ISP will be to determine the pricepmaximizingRi.
2.4
CDN revenue and quality of service
The CDN is also playing on its priceqin order to maxi-mize its revenueRc, defined by
Rc=nq−`C, (4)
where`is the price per unit of server capacityC. Costs of transits to caches are assumed negligible.
The CDN activity induces a better quality perceived by users (as represented in their valuation). The quality of service per download seen by users is a function of capac-ity C: we assume the quality is 1 for the cached content, and δ <1for the uncached one. Let F be the cumulative
distribution function (cdf) of popularity of content and F¯
the complementary cdf. ThusF¯(x) gives the proportion of content with popularity (number of downloads per unit of time) at leastx. F¯−1(y) is then the number of downloads
per unit of time of the yth most popular unit of content. But the most popular contents are cached, representing a proportion min(1, C/n), the average quality per download is thus Q= 1·P+δ·(1−P)withP = RC/n y=0 F¯ −1 (y)dy R1 0 F¯ −1(y)dy , (5)
where P is the probability that a given request is served from the cache. In our numerical section, we will takeF as an exponential cdf with rateη, so thatF−1(y) = (−ylny+ y)/η and Q= δ+ (1−δ)Cn 1−lnCn
, which is actually independent of the parameterη.
3.
ANALYSIS
Let us now specify the order of decisions. We assume that (i) At the largest time scale, the CDN and ISP fix the prices and caching capacity; (ii) at the smallest time scale the mass of content/applications and users are decided.
This is solved by backward induction: CDN and ISP make their choice anticipating the impact on content and users.
3.1
Determining the masses of content and
users for fixed prices
At the smallest time scale, we have the system of equations onn and d (with p, C and q fixed) given by (1) and (2), whereQdepends onnas in (5).
This leads to the fixed-point equation inn
n=N
(1/q)lD(1/p)(1kQn/p)+(1kQn/p0)k (1/q)lD (1/p)kQn
(1/p)kQn+(1/p0)k+ (1/q0)l
(6)
withQagain given in (5). For this equation, the left-hand side is increasing starting from 0. The right-hand side is also starting from 0, so that(n = 0, d = 0) is a (trivial) solution. Indeed, if no user, no interest to produce content, and reciprocally.
If we exclude the solution atn= 0, this fixed-point equa-tion seems intractable analytically, but it can easily be solved numerically. Figure 2 draws the right- and left-hand sides of the equation for k = 2, l = 2, p0 = 3 q0 = 1, p = 1, q= 2,D= 10,N= 10,C= 3,δ= 0.6so thatQ= 1when n < C,Q= (0.6+(1−0.6)(−C n ln C n+ C n)whenn>C(those
values will be used throughout the paper). We get here an intersection point different from(0,0)atn= 7.1081.
Remark that here the equilibrium(0,0)is not stable in the sense that a small increase inn ord would put the values
nor dabove the equilibrium, inducing further increases of the values; this can be seen from the derivative of the red (solid) curve being larger than 1 at that equilibrium1. On
the other hand,(n= 7.1081, d= 9.83193)is locally stable: small variations ofdandnlead back to that point, because the dashed curve has a derivative smaller than 1.
The values ofnanddbeing determined that way for any combination ofp, q and C, the next section considers the determination of the latter values at the larger time scale.
1computing the derivative of this curve, it can be shown
that(0,0)is a stable equilibrium ifN D <1
0 5 10
0 5 10
n
Figure 2: Determination of the solution for n
from(6)when prices and capacity C are fixed.
0 5 10 0 2 4 6 8 ISP pricep CDN price q BRCDN(p) BRISP(q)
Figure 3: Best-response functions whenC= 0
3.2
Selection of prices and caching capacity
At the largest time scale, pricespandq and capacity C
can be decided knowing the resulting values ofnandd. We consider three situations: 1) C = 0 (no caching), q being decided by the ISP; 2) the CDN and ISP cooperate as in the case of a vertical integration of services; 3) the CDN and ISP play a non-cooperative game on their decisions, so that we look for a Nash equilibrium. For that latter case, we will consider both the case without caching from the CDN (who is then just an intermediary) and the case where the CDN decides the caching capacity.
3.2.1
Without CDN
In this caseC = 0and q is actually decided by the ISP, that is, the CPs need to connect to the ISP. We look for maxp,q>0(dp+nq).
With the above values for parameters, a maximum rev-enuemaxp,q>0(dp+nq) = 42.12is at(p= 5.92, q= 1.09).
3.2.2
Cooperation between the CDN and the ISP
This happens when the CDN and the ISP are vertically integrated. We look formaxp,q,C>0(dp+nq−`C).Still with the above parameter values, we get a maximum value of46.43obtained at(p= 7.47, q= 1.06, C= 3.31).
3.2.3
Pricing game between the CDN and the ISP
First, assume that the CDN is just acting as an access ser-vice to CPs, but does not cache anything, i.e., plays onqbut withC = 0. Figure 3 displays the best-response functions. We clearly see a unique Nash equilibrium (intersection point of the two best-response curves) at(p= 4.74, q= 2.03).Now assume that the CDN decides its storage capacityC
at the same time as its priceq, and also at the same time the ISP setsp. We again have a game, but now the CDN has
two decision variables. For our example parameter set, the equilibrium is forp= 4.92,q = 2.04, C= 0.126, obtained after performing successive best-responses from alternating actors (the so-called fictitious play [9], that leads to a stable equilibrium). That equilibrium yields revenue28.64to the ISP and11.77to the CDN.
4.
IMPACT
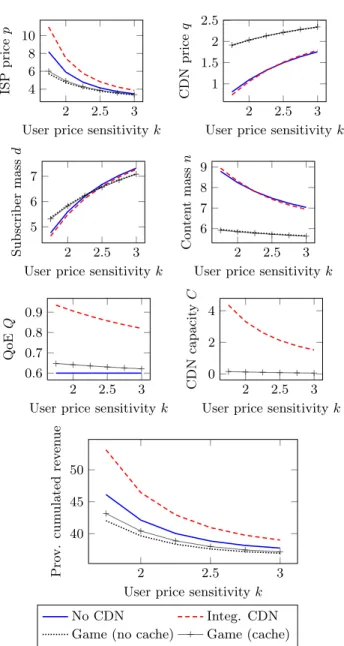
Figure 4 compares the outcomes for our model when the user sensitivity to pricekvaries, the other values being those taken so far. We can make the following observations:
2 2.5 3
4 6 8 10
User price sensitivityk
ISP price p 2 2.5 3 1 1.5 2 2.5
User price sensitivityk
CDN price q 2 2.5 3 5 6 7
User price sensitivityk
Subscrib er mass d 2 2.5 3 6 7 8 9
User price sensitivityk
Con ten t mass n 2 2.5 3 0.6 0.7 0.8 0.9
User price sensitivityk
QoE Q 2 2.5 3 0 2 4
User price sensitivityk
CDN ca p a cit y C 2 2.5 3 40 45 50
User price sensitivityk
Pro v. cum ulated rev e n ue No CDN Integ. CDN
Game (no cache) Game (cache)
Figure 4: Effect of user price sensitivityk
1. Comparing the case without caching with that of an integrated CDN, despite the cost of capacity caching brings an increase of about 10% of revenue. Caching increases the subscription price of users, and decreases that of CPs. Inno-vation (mass of content) is slightly larger when caching, but it is not the case of the number users despite the increased
quality, due to the larger subscription fee.
2. Comparing the case where the CDN is just an access provider to CPs (withC= 0) to the case where this is han-dled by the ISP itself, quite surprisingly the integrated case leads to much more content (around +40% for our values) than competition. The effect on user demand is smaller, and not always in the same direction.
3. An independent and non-cooperative CDN leads to a much smaller caching capacity and a worse QoE than the integrated case.
4. The best situation in terms of content mass among all scenarios is that of an integrated CDN for our (above) values, but can be the no-CDN situation if users are very sensitive to prices. The difference is quite drastic with re-spect to an independent CDN.
5. To discuss the difference between caching (and ask-ing subscription from CPs) and side payments, the latter correspond to the “no CDN” scenario, and the former to the “integrated CDN” case. Caching (integrated CDN) increases the provider’s revenue and reduces the load on the network architecture from the ISP point of view. In this sense, it allows to circumvent the side payment proposal. But as we said, this also increases quality and mass of content at a limited cost in terms of users’ subscription, meaning that regulatory bodies and user associations can hardly complain about the situation, unless using other types of arguments.
5.
REFERENCES
[1] H. Atzmon, R. Friedman, and R. Vitenberg.
Replacement policies for a distributed object caching service. InProc. of CoopIS, pages 661–674, 2002. [2] P. Coucheney, P. Maillé, and B. Tuffin. Network
neutrality debate and ISP inter-relations: Traffic exchange, revenue sharing, and disconnection threat.
Netnomics, 1(3):155–182, 2014.
[3] S. Hasan, S. Gorinsky, D. C., and R. K. Sitaraman. Trade-offs in optimizing the cache deployments of CDNs. In Proceedings of IEEE INFOCOM, Toronto, Canada, pages 460–468, 2014.
[4] K. Hosanagar, J. Chuang, R. Krishnan, and M. Smith. Service adoption and pricing of content delivery network (CDN) services.Management Science, 54(9):1579–1593, 2008.
[5] K. Hosanagar, R. Krishnan, M. Smith, and J. Chuang. Optimal pricing of content delivery network (CDN) services. InProc. of the Annual Hawaii Int. Conf. on System Sciences, 2004.
[6] P. Maillé, G. Simon, and B. Tuffin. Toward a Net Neutrality Debate that Conforms to the 2010s.
https://hal.inria.fr/hal-01127958, 2015. [7] P. Maillé and B. Tuffin.Telecommunication Network
Economics: From Theory to Applications. Cambridge University Press, 2014.
[8] P. Maillé, B. Tuffin, G. Simon, and K. Pires. How Neutral is a CDN? An Economic Approach. InProc. of IEEE CNSM, Rio de Janeiro, Brazil, Nov. 2014. [9] D. Monderer and L. S. Shapley. Potential games.
Games and Economic Behaviour, 14:124–143, 1996. [10] P. Reichl, R. Schatz, and B. Tuffin. Logarithmic laws
in service quality perception : Where microeconomics meets psychophysics and quality of experience.