Data Point:
Trevor Bakker Nicole Kelly
Jesse Leary
Éva Nagypál
This is another in an occasional series of publications from the Consumer Financial Protection Bureau’s Office of Research. These publications are intended to further the Bureau’s objective of providing an evidence-based perspective on consumer financial markets, consumer behavior, and regulations to inform the public discourse.
Table of contents
Table of contents... 3
1.
Introduction ... 4
2.
Data ... 6
3.
Average Checking Account Fees ... 8
4.
Distribution of Overdraft Frequency ... 11
5.
Overdrafting by Transaction Type ... 16
1.
Introduction
Users of checking accounts sometimes engage in debit transactions in amounts that exceed their accounts’ balances. An overdraft occurs if their financial institution chooses to cover such a transaction. Financial institutions will typically charge a fee for an overdraft, although particular overdrafts may avoid a fee depending on the particular circumstances of the transaction and the financial institution’s policies. Overdraft fees generally do not vary by the size of the transaction or the amount by which the consumer’s account balance falls below zero.1
In this Data Point we present the results of several analyses of consumers’ experiences with overdrafts at a number of large banks. In many instances we break down our results by an account holder’s status under Regulation E requirements (also known as “opt-in status”). This refers to the 2009 Federal Reserve Board amendment to Regulation E, subsequently recodified by the CFPB, that generally requires financial institutions to obtain affirmative consent from account holders (“opt-in”) to be charged fees for overdraft coverage on automated teller machine (ATM) and non-recurring point of sale (POS) debit card transactions. This has the practical effect of institutions being less likely to authorize overdrafts on these types of
transactions for account holders who have not opted in. This change became effective for new accounts on July 1, 2010, and for existing accounts on August 15, 2010.
1 Some institutions have de minimis policies in which non-sufficient funds (NSF) and overdraft transactions are not
assessed fees if the transaction amount or the amount by which the account balance falls below zero dollars is less than a specified threshold. Some institutions also have caps on the number of overdraft fees and NSF fees that will be assessed in a single day. Institutions may also empower employees to waive fees manually on individual judgment or in accordance with institutional guidelines. Additionally, an observed minority of institutions tier NSF and overdraft fees by transaction amount. However, in general, NSF and overdraft fees are fixed for transactions that do not trigger de minimis policies.
Key findings of this report with respect to the banks studied include:
Overdraft and non-sufficient funds (NSF) fees constitute the majority of the total
checking account fees that consumers incur. For opted-in consumers, overdraft and NSF fees account for about 75 percent of their total checking account fees and average over $250 per year.
Most overdraft fees are paid by a small fraction of bank customers: eight percent of customers incur nearly 75 percent of all overdraft fees.
The propensity to overdraft generally declines with account holder age, with 10.7 percent of the 18-25 age group having more than 10 overdrafts per year, but only 2.8 percent of the 62 and over age group falling into this category.
The number of overdraft transactions and fees varies substantially with opt-in status.
Opted-in accounts are three times as likely to have more than 10 overdrafts per year as accounts that are not opted in. Opted-in accounts have seven times as many overdrafts that result in fees as accounts that are not opted in. Disentangling the causal nature of the relationship between opt-in status and overdrafting would require further analysis.
Transactions that lead to overdrafts are often quite small. In the case of debit card transactions, the median amount that leads to an overdraft fee is $24 and the median amount of a transaction that leads to an overdraft fee for all types of debits is $50.
Most consumers who overdraft bring their accounts positive quickly, with more than half
becoming positive within three days and 76 percent within one week.
The Bureau’s analysis of the overdraft data is ongoing as the Bureau seeks to gain further insight into some of the questions posed by the white paper the Bureau issued last year.2 Future Data
Points or other Bureau publications will report on further findings.
2.
Data
In its supervisory role, the CFPB has obtained a representative sample of account-level and transaction-level checking account histories from each of several large banks. These are large banks covered by the CFPB’s supervisory authority and do not include credit unions, thrifts, or banks with total assets under $10 billion. These same large banks also provided the institution-level data used in the CFPB Study of Overdraft Programs: A White Paper of Initial Data
Findings (June 2013), hereafter referred to as the “White Paper.” Neither the account-level nor
the transaction-level data contain any directly-identifying personal information.3
The transaction histories contain every transaction that a random sample of the banks’ account holders undertook during the 18-month period spanning January 2011 through June 2012. Each entry generally includes a transaction’s dollar amount, type, posting date, and posting order; the account ledger balance at the end of the previous day’s processing; and a flag indicating whether the transaction resulted in an overdraft or was returned for non-sufficient funds (NSF) and, if so, whether a fee was charged.4 The transaction histories provide a more detailed picture of
overdraft activity than do the aggregated statistics that formed the basis of the White Paper, and have allowed us to apply a uniform method across banks to measuring the various statistics.
3 Because the data used in this analysis are Confidential Supervisory Information, this paper only presents results
that are aggregated and does not identify specific institutions.
4 For many of the banks, we do not have data on debit card or ATM transactions that were declined at the point of
sale; we do not include these declined transactions in calculating total transactions, although we do include
returned checks and returned ACH debits. If an item (such as a check or ACH debit) was presented more than once, each occurrence is counted as a separate transaction.
The account-level data are monthly account summaries for the 30 months spanning January 2010 through June 2012.5 For each month and each account in the sample, they include, among
other information, summary information about transactions such as total deposits (volume), end-of-month balances, and indicators for account configurations such as the Regulation E opt-in status of the account. In addition, the banks provided the year of birth for the primary holder of each account.
Detailed account and transaction data allow us to narrow our analysis to “active” accounts, defined as accounts which averaged more than one customer-initiated debit transaction per month over the period for which we have data and during which the account was open. In all analyses, only active accounts are included. Analysis is conducted at the account or transaction level, and therefore the results reflect the relative number of accounts or transactions at the different study banks.
Overall, the data contain information on roughly two million accounts. As these samples come from a small number of large banks, they cannot be considered fully representative of the checking account market as a whole. Nevertheless, we expect it is likely that they are similar to what one would observe at any institution that offers similar checking account and overdraft products. Due to data availability and comparability issues, we cannot calculate all reported statistics for all study banks. We therefore calculate each statistic for the largest possible set of banks that the data will allow. As a consequence, results from different tables may not be directly comparable, and considerable caution should be exercised when drawing conclusions that require inter-table comparison.
5 As is the case within the study banks’ total checking portfolios, many of the accounts in our sample files were not
3.
Average Checking Account
Fees
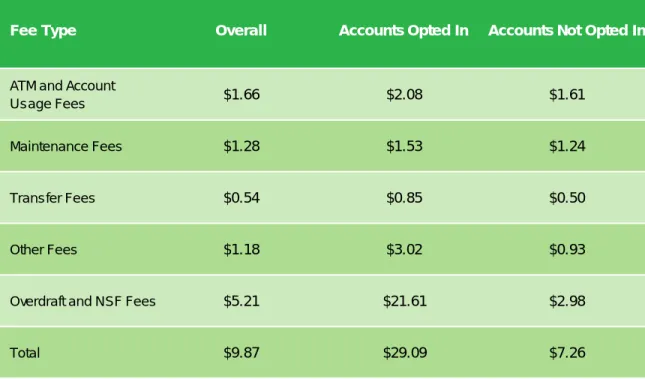
Table 1 shows average net checking account fees,6 in dollars per account per month, across five
major fee categories: ATM and Account Usage Fees7 (such as fees for wire transfers and money
orders), Maintenance Fees (periodic fees that are often waived for consumers that meet balance or other account usage requirements), Transfer Fees,8 Other Fees (such as fees for stopped
payments and returned deposit items), and Overdraft9 and NSF Fees. We see that Overdraft and
NSF Fees make up more than half of net checking account fees at $5.21 per account per month. The second largest category is ATM and Account Usage Fees at $1.66 per account per month. Maintenance Fees comprise a smaller portion at $1.28 per account per month, reflecting the fact that many of the account holders at the study banks either utilize accounts with no maintenance fees (free checking) or meet the terms necessary to qualify for waivers of the maintenance fees associated with their accounts.
6 Net of fee waivers (automatic fee reversals) and identifiable fee refunds (discretionary fee reversals).
7 ATM fees include only those fees assessed by the study banks on their accountholders and do not include host fees
incurred by accountholders charged by other institutions and third-party ATM deployers.
8 “Transfer fees” are fees charged by banks for automatically transferring funds from a linked account (e.g., a linked
savings account) to a checking account in order to cover an item that exceeds the checking account balance.
9 “Overdraft Fees” includes sustained negative balance fees, which are charged by some banks when an account
holder fails to bring his or her account balance positive within a specified period of time after the account balance becomes negative.
TABLE 1: MONTHLY NET CHECKING ACCOUNT FEES PER ACCOUNT
Table 1 also shows net checking account fees by opt-in status. Overall, 14.3 percent of account holders in our study bank sample were opted in during the period of study.10 Not surprisingly,
opted-in accounts experienced higher Overdraft and NSF Fees as compared to accounts that are not opted-in, both in absolute terms and as a fraction of the total fees they represent. In fact, among opted-in accounts, Overdraft and NSF Fees per account per month were over 14 times greater than Maintenance Fees ($21.61 vs. $1.53). Overdraft and NSF Fees constituted a
significant share of the total net account fees for non-opted-in accounts as well; even within this class of accounts, Overdraft and NSF Fees constituted over 40 percent of net checking account fees at an average $2.98 per account per month. Note that the Regulation E opt-in requirement only covers ATM and non-recurring debit card transactions, so even non-opted-in accounts can incur overdraft fees on, for example, checks or ACH transactions.
10 We categorize each account as either opted-in or not opted-in for the entire study period. If the account changed
status, we categorize it according to the status it had for the majority of the period. It should be noted that records of changing opt-in status are very rare among our study banks’ account holders. If a bank did not provide its
customers with the opportunity to opt in, all accounts at that bank would be treated as not opted in.
Fee Type Overall Accounts Opted In Accounts Not Opted In
ATM and Account
Usage Fees $1.66 $2.08 $1.61
Maintenance Fees $1.28 $1.53 $1.24
Transfer Fees $0.54 $0.85 $0.50
Other Fees $1.18 $3.02 $0.93
Overdraft and NSF Fees $5.21 $21.61 $2.98
TABLE 2: COMPOSITION OF GROSS OVERDRAFT AND NSF FEES
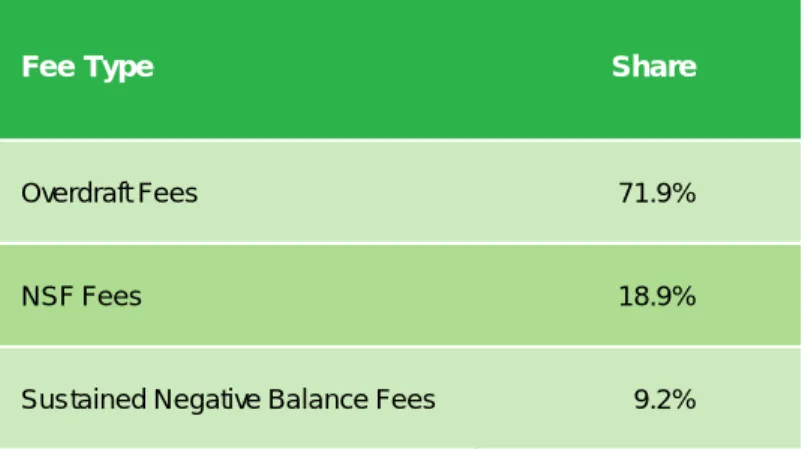
Table 2 breaks down gross Overdraft and NSF Fees into three categories: Overdraft Fees, NSF Fees, and Sustained Negative Balance (SNB) Fees.11 Not all banks charge SNB Fees; these results
are for study banks that charge SNB Fees. Over 70 percent of the fees in this table are Overdraft Fees. Because our study banks (and most institutions) generally charge the same fees for
overdrafts and NSFs, this indicates that most transactions that exceed a consumer’s balance are paid – as opposed to returned – by our study banks. SNB Fees make up 9 percent of Overdraft and NSF Fees at the banks that charge SNB Fees.
11 Gross fees are fees before deducting fee waivers (automatic fee reversals) and identifiable fee refunds (discretionary
fee reversals).
Fee Type Share
Overdraft Fees 71.9%
NSF Fees 18.9%
4.
Distribution of Overdraft
Frequency
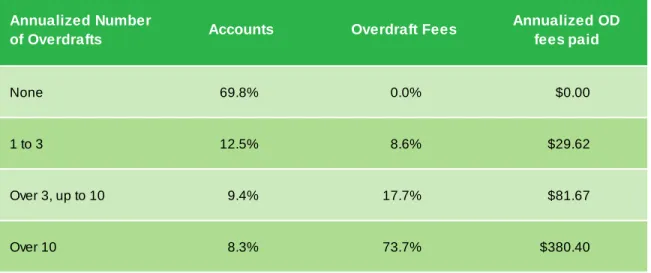
We categorize accounts into four groups based on the frequency of overdraft transactions they experience per year, including transactions that do not incur a fee or those for which the fee was eventually reversed: never, one to three, more than three and up to 10, and more than 10.12
Table 3 shows the distribution of accounts and overdraft fees by these overdraft frequency groups. It shows that a relatively small number of account holders are responsible for most overdrafts, with 8.3 percent of account holders who overdraft more than 10 times per year responsible for 73.7 percent of overdraft fees. A majority of accounts, 69.8 percent, do not incur any overdrafts, and 82.3 percent of accounts incur 3 or fewer overdrafts.13 This table also shows
the average amount of gross fees paid by account holders in different overdraft frequency categories. Because many overdrafts do not result in fees, such as overdrafts covered by a de
minimis policy or debit card transactions that result in an overdraft for an account holder who is
not opted-in, the dollar amounts may be less than the number of overdrafts multiplied by the overdraft fee amount.
12 The analysis in this section uses only information from the last 12 months of the time period covered by the data.
Those accounts that were open for only part of that period are assigned to an overdraft frequency category by annualizing their count of overdrafts.
13 These results are slightly different from those reported in the White Paper, which, based upon aggregate-level data
supplied by the banks, reported that between 73 percent and 80 percent of study bank customers incurred no overdrafts. There are several methodological differences between these calculations and those reported in the White Paper, especially the exclusion here of inactive accounts. CFPB Study of Overdraft Programs: A White Paper of Initial Data Findings, pp. 3, available at http://files.consumerfinance.gov/f/201306_cfpb_whitepaper_overdraft-practices.pdf.
TABLE 3: DISTRIBUTION OF ACCOUNTS AND GROSS OVERDRAFT FEES BY OVERDRAFT FREQUENCY
Annualized Number
of Overdrafts Accounts Overdraft Fees
Annualized OD fees paid
None 69.8% 0.0% $0.00
1 to 3 12.5% 8.6% $29.62
Over 3, up to 10 9.4% 17.7% $81.67
TABLE 4A: DISTRIBUTION OF ACCOUNTS AND GROSS OVERDRAFT FEES BY OVERDRAFT FREQUENCY AND OPT-IN STATUS
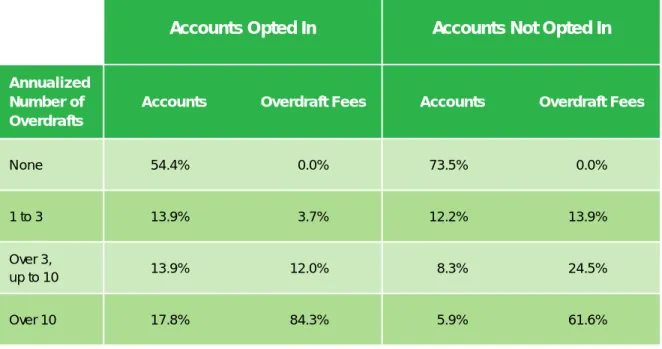
Table 4a. shows the distributions of account overdraft frequency among opted-in and non-opted-in accounts. Much like Table 1, we can see that accounts which overdraft most frequently (more than 10 items per year) are three times as prevalent among accounts that are opted in; indeed, nearly one in five of the opted-in accounts has more than 10 overdraft items per year. The fee distribution is correspondingly skewed toward the most frequent overdrafters: 17.8 percent of the accounts representing 84.3 percent of the fees among Opted-In Accounts, and 5.9 percent of the accounts representing 61.6 percent of the fees among Non-Opted-In Accounts. Note that the difference between Opted-In and Non-Opted-In accounts in overdraft frequency and overdraft fees may be an effect of opting in or a selection effect from the choice to opt in; the underlying causal relationship would require further study.
Accounts Opted In Accounts Not Opted In
Annualized Number of Overdrafts
Accounts Overdraft Fees Accounts Overdraft Fees
None 54.4% 0.0% 73.5% 0.0%
1 to 3 13.9% 3.7% 12.2% 13.9%
Over 3,
up to 10 13.9% 12.0% 8.3% 24.5%
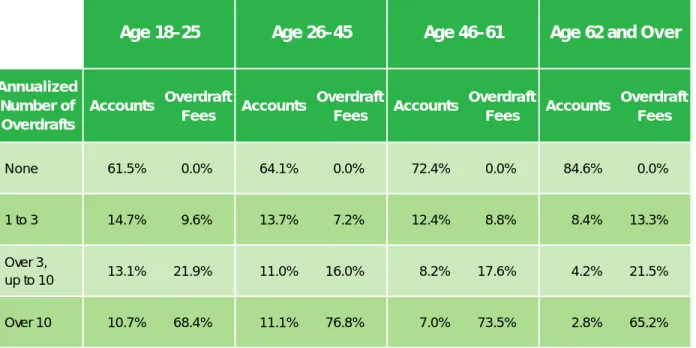
TABLE 4B: DISTRIBUTION OF ACCOUNTS AND GROSS OVERDRAFT FEES BY OVERDRAFT FREQUENCY AND AGE
Table 4b. breaks down the distribution of accounts by age of the account holder and the frequency of overdrafts. We find that the share of accounts in higher overdraft categories generally declines with account holder age, and the share of accounts without any overdrafts rising from 61.5 percent of the 18-25 age group to 84.6 percent of the 62 and over age group. Further analysis is needed to determine the underlying mechanisms of this relationship, such as differences in debit card use, differences in average balances, or other factors.
Age 18–25 Age 26–45 Age 46–61 Age 62 and Over
Annualized Number of Overdrafts
Accounts Overdraft
Fees Accounts
Overdraft
Fees Accounts
Overdraft
Fees Accounts
Overdraft Fees
None 61.5% 0.0% 64.1% 0.0% 72.4% 0.0% 84.6% 0.0%
1 to 3 14.7% 9.6% 13.7% 7.2% 12.4% 8.8% 8.4% 13.3%
Over 3,
up to 10 13.1% 21.9% 11.0% 16.0% 8.2% 17.6% 4.2% 21.5%
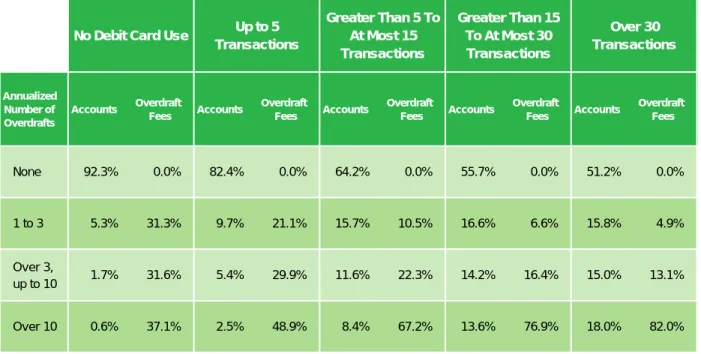
TABLE 4C: DISTRIBUTION OF ACCOUNTS AND GROSS OVERDRAFT FEES BY OVERDRAFT FREQUENCY AND MONTHLY DEBIT CARD INTENSITY
Table 4c. reports the distribution of overdraft frequency by the intensity of debit card use. Here we see that overdraft incidence changes consistently with debit card use. On one end of the distribution, 92.3 percent of accounts that do not use debit cards have no overdrafts in a year of account use. Only 0.6 percent of these accounts incur more than 10 overdrafts per year. At the other end of the distribution, accounts that use their debit cards more than 30 times per month have the lowest percentage of non-overdrafters (51.2 percent) and the highest percentage of most frequent overdrafters (18.0 percent).
No Debit Card Use Up to 5 Transactions
Greater Than 5 To At Most 15 Transactions
Greater Than 15 To At Most 30 Transactions Over 30 Transactions Annualized Number of Overdrafts Accounts Overdraft Fees Accounts Overdraft Fees Accounts Overdraft Fees Accounts Overdraft Fees Accounts Overdraft Fees
None 92.3% 0.0% 82.4% 0.0% 64.2% 0.0% 55.7% 0.0% 51.2% 0.0%
1 to 3 5.3% 31.3% 9.7% 21.1% 15.7% 10.5% 16.6% 6.6% 15.8% 4.9%
Over 3,
up to 10 1.7% 31.6% 5.4% 29.9% 11.6% 22.3% 14.2% 16.4% 15.0% 13.1%
5.
Overdrafting by Transaction
Type
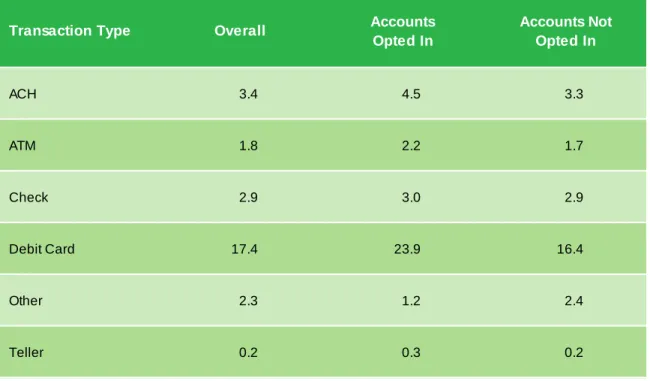
We categorize debit transactions into six transaction types: ACH (including pre-authorized ACH), ATM, Check, Debit Card (point of sale and recurring), Other (such as online transfers), and Teller. Fees, adjustments, and other bank-initiated transactions are not included within these categories. Table 5 shows the number of debit transactions per account per month across these transaction types, both overall and by opt-in status.14 By far the most frequent transaction
type is Debit Card with 17.4 transactions per account per month. Debit Card use is even more frequent among opted-in accounts at 23.9 transactions per account per month.
14 Gross transactions include transactions that may have been reversed at a later time as well as check and ACH
transactions returned for insufficient funds. As noted earlier, these totals do not include declined debit card POS and ATM transactions.
TABLE 5: MONTHLY DEBIT TRANSACTIONS PER ACCOUNT BY TRANSACTION TYPE
Transaction Type Overall Accounts Opted In
Accounts Not Opted In
ACH 3.4 4.5 3.3
ATM 1.8 2.2 1.7
Check 2.9 3.0 2.9
Debit Card 17.4 23.9 16.4
Other 2.3 1.2 2.4
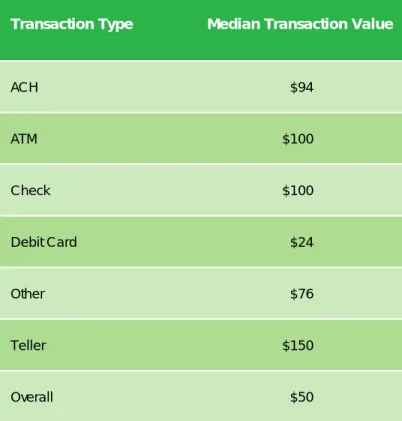
TABLE 6: MEDIAN VALUE OF OVERDRAFT TRANSACTIONS CHARGED A FEE BY TRANSACTION TYPE
Table 6 shows the median sizes of transactions that lead to an overdraft with a fee charged by the bank. These figures do not include NSF transactions. We see that the median transaction size of Debit Card overdrafts that result in an overdraft fee is the smallest at $24, while Teller overdrafts resulting in fees are the largest at $150. The median transaction size over all overdraft transactions that result in fees is $50.
Transaction Type Median Transaction Value
ACH $94
ATM $100
Check $100
Debit Card $24
Other $76
Teller $150
TABLE 7: PERCENTAGE OF TOTAL VALUE OF OVERDRAFT TRANSACTIONS NOT COVERED BY ACCOUNTHOLDER FUNDS BY TRANSACTION TYPE
When an overdraft takes place, the bank covers the portion of the transaction that is not covered by the funds in the account at the time. Table 7 shows the total percentage of funds from all overdrafts that are covered by the study banks rather than covered by funds in the account at the time of the overdraft.15 It shows a wide range across transaction types; for example, 42.4 percent
of the total dollar amount of Check overdraft transactions is not covered by funds in consumers’ accounts, while that figure is 61.3 percent for Debit Card transactions. Note that, on average, Debit Card transactions are substantially smaller than Check transactions, so the dollar amount covered by the banks may still be higher for check transactions.
15 These calculations are made using the ledger balance of the account at the time the transactions settles.
Transaction Type Percentage
ACH 49.1%
ATM 61.8%
Check 42.4%
Debit Card 61.3%
Other 42.3%
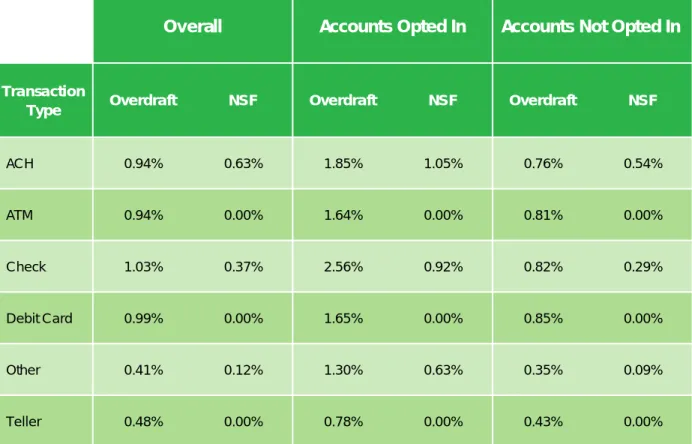
TABLE 8: SHARE OF TRANSACTIONS THAT ARE OVERDRAFT OR NSF BY TRANSACTION TYPE AND OPT-IN STATUS
Table 8 shows the share of transactions that are paid as Overdraft or returned as NSF for the various transaction types, including both transactions that result in fees and transactions that do not result in fees. The share of transactions that are Overdraft transactions is similar for Check, Debit Card, ACH and ATM transactions at around 0.9 – 1.0 percent. The share that are returned as NSF is lower, and the transaction type with the highest NSF likelihood is ACH at 0.63
percent. When breaking out Opted-In and Non-Opted-In accounts, an interesting result
emerges: among Opted-In accounts, the probability of overdrafting is significantly higher across
all transaction types, not just those covered by the Regulation E opt-in requirement (ATM and
non-recurring debit card transactions). For example, for ACH transactions, the Overdraft share
Overall Accounts Opted In Accounts Not Opted In
Transaction
Type Overdraft NSF Overdraft NSF Overdraft NSF
ACH 0.94% 0.63% 1.85% 1.05% 0.76% 0.54%
ATM 0.94% 0.00% 1.64% 0.00% 0.81% 0.00%
Check 1.03% 0.37% 2.56% 0.92% 0.82% 0.29%
Debit Card 0.99% 0.00% 1.65% 0.00% 0.85% 0.00%
Other 0.41% 0.12% 1.30% 0.63% 0.35% 0.09%
for Opted-In accounts is more than double the share for accounts not opted in (1.85% vs. 0.76%) and for Check transactions the share is triple (2.56% vs. 0.82%).16
TABLE 9: AVERAGE MONTHLY NUMBER OF OVERDRAFT AND NSF TRANSACTIONS
PER ACCOUNT BY FEE STATUS
Finally, Table 9 shows the number of Overdraft or NSF transactions per account per month, categorized by whether they were paid (leading to an Overdraft) or rejected (leading to an NSF) and whether or not the transaction incurred a fee. Again, these statistics are shown both overall and by opt-in status. Opted-in customers have seven times as many overdraft transactions with a fee (0.516 per month) as customers who are not opted in (0.072 per month). They also have more NSF transactions with fees, but this difference is smaller (0.074 per month versus 0.030 per month). As previously noted, these calculations do not include ATM or debit card
transactions that were declined at the point of sale.
16 Although the Regulation E opt-in requirement covers only non-recurring debit card transactions and our
classification of Debit Card transactions includes recurring transactions, non-recurring transactions that are covered by Regulation E make up the vast majority of all Debit Card transactions.
Fee Status Overall Accounts Opted In
Accounts Not Opted In
NSF with Fee 0.036 0.074 0.030
NSF without Fee 0.004 0.007 0.004
Overdraft with Fee 0.135 0.516 0.072
6.
Negative Balance Episodes
A negative balance episode is the sequence of days following an initial overdraft during which an account holder’s balance remains negative. A negative balance episode commences on the business day when a bank posts the transaction that results in a negative account balance. It ends on the business day the bank posts the transaction that brings the account balance positive. Between the starting transaction and the ending transaction there may or may not be additional overdraft or NSF transactions. Figure 1 shows the distribution of negative balance episodes that began on a day when an overdraft transaction was posted to the account.17 We see that mostnegative balance episodes are very short. In 29 percent of cases, the account holder returns the account balance positive the calendar day after the account goes negative. More than half of all episodes last three days or fewer, and 76.1 percent last a week or less. A small number of
episodes last much longer: 2.8 percent of episodes last 45 days or more and some of these result in an account closure and negative balance charge-off.
17 These calculations are made using the accounts’ ledger balances. We exclude a small number of situations in which
the ledger balance was not negative at the end of the day on which the overdraft transaction posted, which could arise if the transaction was identified as an overdraft at the time it was authorized but funds were deposited into the account prior to the end of the day on which the transaction settled.