PME
I
J
International Journal of
Production Management
and Engineering
Volume 3, Issue 2
June - December 2015
Pages 87-133
EdItors
Prof. Eduardo Vicéns-Salort, Universitat Politècnica de València, Spain Dr. Pedro Gómez-Gasquet, Universitat Politècnica de València, Spain Dr. Andrés Boza, Universitat Politècnica de València, Spain Dr. Josefa Mula Bru, Universitat Politècnica de València, Spain Dr. Llanos Cuenca, Universitat Politècnica de València, Spain
EdItorIal Board
Prof. Luis M. Camarinha-Matos, New University of Lisbon, Portugal Prof. Ramón Companys Pascual, Universitat Politècnica de Catalunya, Spain Prof. Luiz C. R. Carpinetti, University of Sao Paulo, Brazil
Prof. Bernard Grabot, University of Toulouse, France Dr. Susan Grant, Brunel University, United Kingdom
Prof. Paul W. P. J. Grefen, Eindhoven University of Technology, Netherlands
Prof. Roland Jochem, Fraunhofer - Institute for Production Systems and Design Technology, Germany Prof. Francisco C. Lario Esteban, Universitat Politècnica de València, Spain
Prof. Andrew C.L. Lyons, University of Liverpool Management School, United Kingdom Prof. Luis Onieva Giménez, Universidad de Sevilla, Spain
Prof. Angel Ortiz Bas, Universitat Politècnica de València, Spain
Prof. Raúl Poler, Research Centre on Production Management and Engineering Universitat Politecnica de Valencia, Spain Prof. José Carlos Prado-Prado, Universidad de Vigo, Spain
Prof. François Vernadat,European Court of Auditors, France
PUBlIsHEd BY
Universitat Politècnica de València
sUBsCrIPtIoN INForMatIoN
Editorial UPV, [email protected] Price: 15 € / issue
laYoUt
Enrique Mateo, Triskelion disseny editorial
CoVEr dEsIGN
Francisco Javier Boza García
ISSN 2340-5317 EISSN 2340-4876
Depósito Legal V-1737-2013 EDITORIAL
EDITORIAL
International Journal of Production Management and Engineering
PME
I
J
International Journal of Production Management and Engineeringtable of contents
PaPErs
total Quality Management implementation in Greek businesses: Comparative assessment 2009-2013 ... 87
Vranaki, M., Vranakis, S. and Sarigiannidis, L.
Quantitative assessment of sustainable city logistics ... 97
Grosso-delaVega, R. and Muñuzuri, J.
Fuzzy maintenance costs of a wind turbine pitch control device ... 103
Carvalho, M., Nunes, E. and Telhada, J.
Which of dEa or aHP can best be employed to measure efficiency of projects? ... 111
Sánchez, M.A.
a robust evaluation of sustainability initiatives with analytic network process (aNP) ... 123
Ocampo, L. and Ocampo, C.O.
iii
Creative Commons Attribution-NonCommercial-NoDerivatives 4.0 International Int. J. Prod. Manag. Eng. (2015) 3(2)
PME
I
J
https://ojs.upv.es/index.php/IJPME
International Journal of Production Management
and Engineering Receivedhttp://dx.doi.org/10.4995/ijpme.2015.32452014-08-26 Accepted: 2015-05-25
Total Quality Management implementation in Greek businesses:
Comparative assessment 2009-2013
Martha Vranakia,i, Stergios Vranakisa,ii and Lazaros Sarigiannidisb a Democritus University of Thrace, School of Engineering, Department of Production and Management Engineering. Xanthi, Greece
b Technological Educational Institute of Kavala, School of Business and Economics, Department of Business Administration. Kavala, Greece
abstract: The competition in the Greek manufacturing sector has become very intense and the need for businesses to survive, under these very difficult conditions, forces them to find new ways to increase their profits, but also to attract new customers and to retain old. A necessary condition for long-term business survival is to maintain a high product quality level. The implementation of Total Quality Management (TQM) approach is a key factor to achieve this goal.The main objective of this research is to identify the current situation as far as the implementation of TQM by Greek manufacturing firms, and finally to compare the results between the current research and the previous research of 2009 (Vranaki et al., 2010). The research model that has been developed incorporates nine factors which are found in literature to influence Total Quality Management. A structured questionnaire has been developed and distributed to executives of 61 companies. Descriptive statistics as well as Structure Equation Modeling (SEM) techniques were used to analyze the data.
Key words: Quality, Total Quality Management, Business Performance, Management Leadership, Supplier Management, Customer Focus.
1. Introduction
In the first decades after the Second World War, the competitiveness of products and services in international trade was defined by two related features, quality and production cost. A more recent important dimension of competitiveness is the ability to develop innovations in products and production processes. The ability to develop innovations frequently combined with quality and productivity, determine the time our chances to survive a business in a complex and uncertain environment in a context of rapid globalization, technological developments. Moreover, development in recent decades led many companies to consider the quality as the basic and most effective condition for success. This explains the ease of penetration in foreign countries many products in Japan and Germany, software packages and various technical and financial services in the U.S., and their example followed by South Korea,
Singapore, Taiwan etc. . What ultimately establish and differentiate the products of the countries is the high quality that offer the purchaser in relation to their cost, in other words a great value compared to cost to the customer.
2. Literature Review
In recent years, increasing attention has been paid to improving the overall quality. Many companies have taken initiatives to implement various techniques of quality management. An important strategy for achieving high quality is TQM (Total Quality Management). The Total Quality Management (TQM) was defined as a management system to improve efficiency within a business to maximize customer satisfaction, conduct continuous improvements and great support to the involvement of employees.
87
Int. J. Prod. Manag. Eng. (2015) 3(2), 87-95
2.1. Factors that affect operational results Improving business results through quality, assumes that many factors are quite important for enterprises. A comprehensive review and a classification of the relevant empirical literature revealed that, in general, the nine factors discussed below were the most important parameters in the application of TQM.
2.2. Leadership
As documented by various researchers (Deming, 1986; Juran, 1986), the administrative leadership is an important factor in the implementation of TQM because it improves performance by influencing other practices of TQM (Anderson et al., 1995; Flynn et al., 1995; Ahire and O’Shaughnessy, 1998; Wilson and Collier, 2000). The successful implementation of TQM requires effective change in the culture of a company. It is almost impossible to have changes in a company without any a concentrated effort by the administration, which aims at a continuous improvement in an open communication and cooperation throughout the enterprise (Bell and Burnham, 1989; Ettkin et al., 1990; Goodstein and Burke, 1991; Handfield and Ghosh, 1994; Choi, 1995; Hamlin et al., 1997; Zeitz et al., 1997; Daft, 1998; Abraham et al., 1999; Adebanjo and Kehoe, 1999; Ho et al., 1999).
2.3. Human resource management
The administration has a complex role in the implementation of TQM. It is impossible to improve the procedures of any business without a well-trained workforce. The management of human resources, previously known as personnel management, has been upgraded to the science that studies the staff not as a factor that causes costs, but as an asset in which each company must invest. The administration should provide the necessary resources for the training of staff in the use of new concepts and tools and creates a work environment that encourages employee participation in the process of change (Bell and Burnham, 1989; Schroeder et al., 1989; Burack et al., 1994; Anderson et al., 1995; Flynn et al., 1995;
Hamlin et al., 1997; Ahire and O’Shaughnessy,
1998; Daft, 1998; Handfield et al., 1998; Ho et al., 1999; Wilson and Collier, 2000). Top management should also ensure that the necessary resources for the relevant quality training is available (Ahire and O’Shaughnessy, 1998; Anderson et al., 1995; Flynn et al., 1995; Handfield et al., 1998; Ho et al., 1999). It takes more than education to be effective and successful change. Employees should be involved
at this stage. A crucial factor in accordance with the Adebanjo and Kehoe (1999), is that the participation of workers, because affected by the creation of a new working environment that encourages and facilitates open communication. In such an environment, it is possible for workers to commit themselves to work and contribute their ideas in that it facilitates and enhances the process of change (Burack et al., 1994; Anderson et al., 1995; Flynn et al., 1995; Das et al., 2000).
2.4. Information and data analysis
The information and analysis of data related to quality, including the unnecessary actions of a “poor” quality, such as repetitive labor costs, waste and control charts to identify quality problems and provide information on the areas of potential improvement (Choi, 1995; Lockamy, 1998; Ho et al., 1999). The data relating to quality have a positive effect on firm performance through three business practices of TQM. Specifically, through the quality management of suppliers, to design new products / services and through management processes.
2.5. Supplier management
Since all businesses (especially large) have their suppliers from whom they buy either materials or products, the quality that they provide them is able to affect the overall quality of the finished products. So the complete identification of products needed by their suppliers a company is a hub avoiding production of defective products and, therefore, increase business performance. The quality management of suppliers requires regular monitoring of suppliers by creating a database that measures this performance, a critical tool for improving material and raw materials costs required to develop, market prices and responsiveness of suppliers (Krause et al., 1998). With this database, companies can pursue qualitative measures such defective parts-per-million (parts-per-million defective), the reliability and the rate of discarded products (Forza and Flippini, 1998; Krause et al., 1998; Trent and Monczka, 1999), as well as timely delivery and performance in the percentage of acceptable incoming materials (Tan et al., 1998).
2.6. Product design
Each product has specific characteristics. For the design of the process or production processes, products are categorized into groups depending on
88 Int. J. Prod. Manag. Eng. (2015) 3(1), 87-95 Creative Commons Attribution-NonCommercial-NoDerivatives 4.0 International
their type, their production volume, complexity, and on the basis of characteristics of the contact point with these firm-customer. Regarding the model can distinguish the specific products that can be manufactured in many different styles, standard products and products of mass production (Adamidis, 2002). Under the IGI, efforts design new products have two objectives: planning the construction part of the products, and the design quality of the products (Flynn et al., 1995; Handfield et al., 1999). Top management of a company is responsible for the design of products for the market and meet consumer needs (Deming, 1986; Garvin, 1987; Shetty, 1988; Flynn et al., 1995). This focus is critical for the de-velopment of products, especially when they meet customer needs (Juran, 1981; Leonard and Sasser, 1982; Flynn et al., 1995; Hackman and Wageman, 1995). To simplify the design of products, top man-agement uses interoperable groups to reduce the number of parts that make up the product and stan-dardize these parts (Chase et al., 2001). By doing so achieves a more efficient management processes by reducing process complexity and differences be-tween the procedures (Flynn et al., 1995; Ahire and Dreyfus, 2000).
2.7. Process management
Another factor that affects the operational results through management procedures. Management processes in an enterprise implies a proactive method to improve the quality, such as the design of processes that provide stable production schedules and distribution work (Saraph et al., 1989; Flynn et al., 1995) to reduce the complexity of processes (Flynn et al., 1995) with the build quality of the product during the production phase (Handfield et al., 1999). Reducing the complexity of the process increases the uniformity of production, while reducing duplication and defective (Anderson et al., 1994; Forza and Flippini, 1998) because the quality problems are identified and corrected immediately (Ahire and Dreyfus, 2000). The process used to produce a product directly affects the quality. The market, for example, a machine that will facilitate the production and thus improve the quality of a solution where the money will be invested in the market will be amortized from the best production, the easiest and best price sale.
2.8. Customer focus
One element of TQM is the focus on customers. The establishment and maintenance of an open
relationship between the firm and its clients facilitate the design of new products. This is achieved because there is immediate clarification of needs and wants of customers. The key to nurturing strong relationships with customers is to establish communication between the firm and its clients (Tillery, 1985). These practices include frequent contact with customers. The Wright and Snell (2002) argue that simply focus and customer acquisition is not always good for business. Since customers can easily be lost in case they have a bad experience with the product or even if a new product does not attract them. Businesses should target customer trust to have improved operational results.
2.9. Strategic Planning
Strategic planning is the process of development and analysis of the mission and the vision, objectives, strategies and defining the sources of business. Strategic planning has a long time horizon, considering the external environment and determines the general direction of the business. This programming will be made by the highest levels of administration (Jackson and Ferguson, 1952).
3. Proposed conceptual framework
and research hypotheses
Through this research aims to study o Role of TQM in Greek businesses, and the comparison to the applications of the principles of TQM in the years 2009 and 2013. Research model is a synthesis of research findings from the literature. The opinions are varied and numerous, so an attempt was made to include as much as the model to be an integrated presentation that takes into account all factors affecting the IGI.
The 9 factors of TQM presented will serve as part of the model. All are interrelated and the proper functioning of one affects the proper functioning of the other. All are considered particularly important for an enterprise to improve its results, should take them seriously. Even the improvement of some of these factors will lead to greater earnings. Since the model will create some initial assumptions that depending on the findings of the investigation or will be verified or disproved. The research model is framed by an external agent is the economic crisis. The processing in our country now is now at breaking point. The economic crisis and the number of bureaucratic barriers that are in any healthy business initiative have created uncertainty and insecurity in the market.
89
Int. J. Prod. Manag. Eng. (2015) 3(2), 87-95
Creative Commons Attribution-NonCommercial-NoDerivatives 4.0 International
Meanwhile, the business of the country, especially manufacturing companies based in the Greek region, seeking development measures that the state promised one part, and the other was obliged to take to remove disincentives to entrepreneurship and the establishment of structural economic reforms. Given the negative sentiment in the market, it is obvious that a new approach to the development effort, especially in the field of policies to improve the external business environment in Greece.
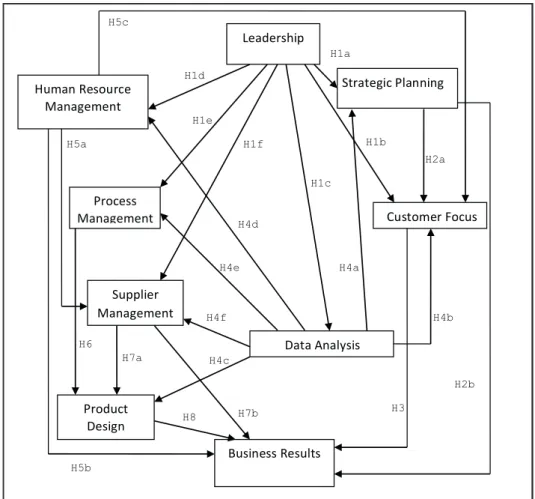
As shown in Figure 1 above, created the following assumptions:
- Hypothesis 1: The administrative leadership positively affects:
a) strategic planning, b) customer focus,
c) the information and data analysis, d) human resource management, e) management procedures, f) and supplier management.
- Hypothesis 2: The strategic planning positively affects:
a) customer focus, and
b) operational results.
- Hypothesis 3: The focus of customer positively affects business results.
- Hypothesis 4: The information and data analysis positively affects:
a) strategic planning, b) customer focus, c) the design of products, d) human resource management, e) management procedures, f) managing suppliers.
- Hypothesis 5: The management of human resources positively affects:
a) the management of suppliers, b) customer focus, and
c) operational results.
- Hypothesis 6: The process management positively affects business results.
- Hypothesis 7: Managing suppliers is positive: a) designing products, and
b) operational results.
Figure 1. Proposed Conceptual Framework. Figure 1: Proposed Conceptual Framework
Human Resource Management
Strategic Planning
Customer Focus Leadership
Supplier Management
Product Design
Business Results Process
Management
Data Analysis
H1a
H1b
H1c H1d
H1e
H1f
H2a
H2b H3
H4a
H4b
H4c H4d
H4e
H4f H5a
H5b H5c
H6
H8 H7a
H7b
90 Int. J. Prod. Manag. Eng. (2015) 3(1), 87-95 Creative Commons Attribution-NonCommercial-NoDerivatives 4.0 International
- Hypothesis 8: The product design positively affects management procedures.
4. Research Methodology
Field survey of the research are Greek companies that belong to the manufacturing sector of Greek economy, and employ more than 20 employees. The final sample consisted of 61 correctly completed questionnaires from the secondary sector. 67 of the 95 companies responded, returning 61 completed questionnaires. However, questionnaires six of them, were deemed unsuitable because responses completed poorly. Therefore 61 questionnaires (from 67 firms) were assessed as suitable for statistical analysis with a response rate of approximately 64.21% of the total population (95).
5. Exploratory Factor Analysis
One measure of sample adequacy is the ratio of the Kaiser-Meyer-Olkin (KMO), and must take values greater than 0.5 (Malhotra, 1999). In this study, the KMO values are satisfactory and acceptable. An additional check of the correlations of our data is
testing sphericity of Bartlett (1950). Note that variables removed from the tables because of low loadings (see Appendix). The results of the checks carried out, allow to assert, that the deterministic variables are compact and reliable structures, able to contribute to the measurement of the agent to which they belong. To assess the goodness of fit of deterministic variables applied confirmatory Factor Analysis. Initially, took control of the overall model, and then testing the structural model.
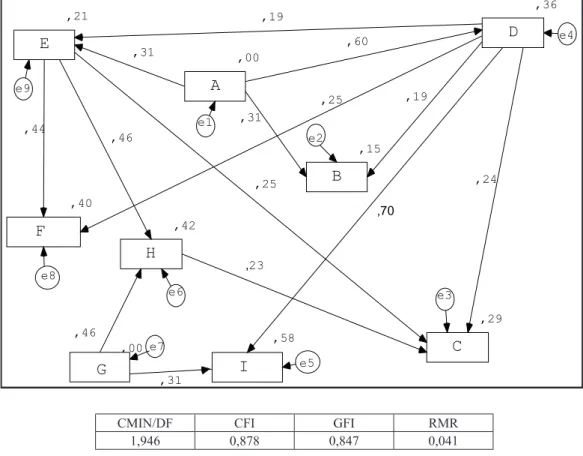
In the model below, the encodings are as follows: A. Leadership, B. Strategic Planning, C. Customer Focus, D. Information & Data Analysis, E. Human Resource Management, F. Process Management, G. Supplier Management, H. Product Design, I. Business Results.
The overall model was estimated using four indicators. Acceptable values of the indicators are: CMIN/DF<3, GFI>0.9, CFI>0.9, RMR<0.05 (Smith & McMillan, 2001). The levels of these markers suitability is acceptable, so the model is valid.
In summary, it should be noted that at first glance, observed that the main core of the model is the administrative leadership and information and analysis. The first factor directly influences the
Figure 2. Fitness Model.
CMIN/DF CFI GFI RMR
1,946 0,878 0,847 0,041
Figure 2: Fitness model
CMIN/DF CFI GFI RMR
1,946 ,878 ,847 ,041
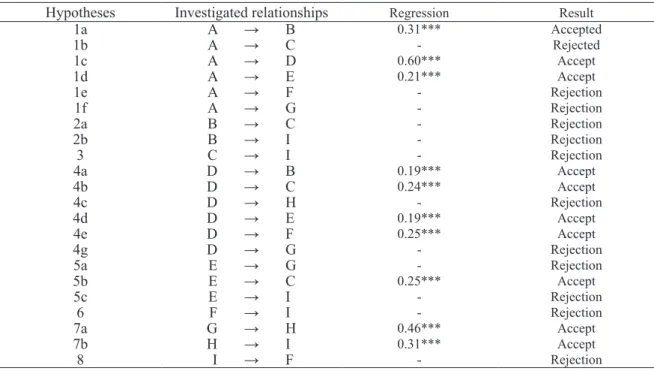
Table 1: Results of hypothesis testing
Hypotheses Investigated relationships Regression Result 1a Α B 0.31*** Accepted
1b Α C - Rejected
1c Α D 0.60*** Accept 1d Α E 0.21*** Accept
1e Α F - Rejection
1f Α G - Rejection
2a Β C - Rejection
2b Β I - Rejection
3 C I - Rejection
4a D B 0.19*** Accept 4b D C 0.24*** Accept
4c D H - Rejection
4d D E 0.19*** Accept 4e D F 0.25*** Accept
4g D G - Rejection
5a E G - Rejection
5b E C 0.25*** Accept
5c E I - Rejection
6 F I - Rejection
7a G H 0.46*** Accept 7b H I 0.31*** Accept
8 I F - Rejection
***p<0.001 level, **p<0.05 level
,00 A ,15 B ,29 C ,36 D ,21 E ,40 F G ,42 H ,58 I e1 e2 e3 e4 e5 e6 e7 e8 e9 ,25 ,60 ,24 ,19 ,31 ,25 ,31 ,31 ,46 ,44 ,46
,70
,23
,19
,00
91
Int. J. Prod. Manag. Eng. (2015) 3(2), 87-95
Creative Commons Attribution-NonCommercial-NoDerivatives 4.0 International
strategic planning, the factor relating to information and data analysis and management of human resources, which verifies three of the initial assumptions. While indirectly affects the other actors and the operational results. The second factor is that the core is the information and data analysis, which directly-affected in human resource management, the operational results and customer focus.
6. Conclusions
The aim of this study was to analyze the factors affecting the IGI operating results, the impact of the economic crisis and to compare the results of this research with the corresponding 2009. Comparing the results of this research with the research conducted in 2009 (Vranaki et al., 2010) resulted in the following conclusions:
1. To improve operational results, emphasis should be placed on all factors of TQM.
2. Focusing on customers is a key objective of Greek firms.
3. Changes in customer preferences significantly affect the management of suppliers.
4. Factor information is a “station” of administrative leadership.
The first and very impressive conclusion drawn from this research are the indirect effects that accept
business results, which verified in earlier research (Vranaki et al., 2010). It was expected that these factors will directly affect business performance to some extent. The significance of this finding is the indirect influence of these factors on business outcomes. The interpretation of the above can be a very useful tool in the hands of Greek firms. More specifically, from the above we understand that companies need to pay attention to many parameters to achieve their purpose. It is not enough to be consumed in a particular agent and others to fail.
The focus of the customer no effect. Unlike the earlier survey where the customer focus impacted upon four factors, and this in turn is impacted upon the management of suppliers. Thus, we conclude that the customer satisfaction and knowledge on the requirements of customers is the second most important goal you want to achieve the Greek companies, but also that most businesses do not make changes in supplier management with the slightest change in customer needs. The administrative leadership does not act directly to target customers, but indirectly through other factors, in contrast to the 2009 survey. Administrations business to achieve its approach and establishment of good relations with clients through the collection of information, training workers but also through product design. At this point it should be noted that research verifies the Wright and Snell (2002), The who argue that simply focus and customer acquisition is not always good for business.
Table 1. Results of hypothesis testing.
Hypotheses Investigated relationships Regression Result
1a Α → B 0.31*** Accepted
1b Α → C - Rejected
1c Α → D 0.60*** Accept
1d Α → E 0.21*** Accept
1e Α → F - Rejection
1f Α → G - Rejection
2a Β → C - Rejection
2b Β → I - Rejection
3 C → I - Rejection
4a D → B 0.19*** Accept
4b D → C 0.24*** Accept
4c D → H - Rejection
4d D → E 0.19*** Accept
4e D → F 0.25*** Accept
4g D → G - Rejection
5a E → G - Rejection
5b E → C 0.25*** Accept
5c E → I - Rejection
6 F → I - Rejection
7a G → H 0.46*** Accept
7b H → I 0.31*** Accept
8 I → F - Rejection
***p<0.001 level, **p<0.05 level
92 Int. J. Prod. Manag. Eng. (2015) 3(1), 87-95 Creative Commons Attribution-NonCommercial-NoDerivatives 4.0 International
Since customers can easily be lost in case they have a bad experience with the product or even if a new product does not attract them. The Greek companies surveyed are showing great interest in customer retention. Besides, studies have shown that attracting new customers is much more expensive strategy than keeping existing customers (Kotler, 1982). The Greek firms, given the large and increasing competition are trying to focus on customer satisfaction rather than on improving operational results, but for obtaining “good reputation.”
The next conclusion we reached was that the administrative leadership through the management of human resources affects product design product design. In the 2009 survey design products in turn impacted upon on business outcomes. However, it is very encouraging that most companies place great emphasis on training their employees. Course, must be included with the necessary resources for the training of staff in total business expenses. On the other hand, when a company has fully trained staff on quality issues as avoiding possible mistakes and defective products and therefore achieves customer focus. It should be noted that the management of human resources including the health and safety of workers. As we can conclude, businesses protecting employees from any accidents aimed at improving their emoluments as well as to improve the image of the company. Furthermore, observed that the level of training of governing and management procedures, which is repeated from 2009. Process management involves reducing the complexity of the processes in the production stage. Officials, however, the companies to be able to respond to change a process must first have the proper training. In any other case,
the “change” in business processes will have no positive benefit to business results.
Vendors directly affect the design of new products. Any change in production processes or customer habits involves the review of suppliers. As mentioned above, the quality of raw materials of products is the basis for good quality of finished products.
Finally, reference should be made to study the eco-nomic crisis as an external factor. The ecoeco-nomic cri-sis, according to the frequency analycri-sis, seems to have the most negative effects on human resource manage-ment and managemanage-ment of suppliers. This was expect-ed, considering the increase in the unemployment rate in the country the last two years, but also the need for companies to increasingly seeking “best prices” for their raw materials.
6.1. Research limitations
Observing the results of the investigation, it is useful also to refer to some restrictions. The survey was conducted with a sample of 61 Greek and craft industries in the manufacturing sector. A larger sample would likely give different results.
All companies operate in manufacturing sector, but 45 of the 61 belong to the food industry, so they subject to each agent from a different perspective, than if it were operating in different manufacturing activity.
Questions contain elements of subjectivity. Thus, some of the respondents may be overestimated to a question by scoring 1 in Likert scale that can be “worth” 2 or underestimated some grading at 7 in the Likert scale that can ‘deserved’ 6.
References
Abraham, M., Crawford, J., Fisher, T. (1999). Key factors predicting effectiveness of cultural change and improved productivity in implementing total quality management, International Journal of Quality and Reliability Management, 16(2): 112–132. doi:10.1108/02656719910239910
Adebanjo, D., Kehoe, D. (1999). An investigation of quality culturedevelopment in UK industry, International Journal of Operations and Production Management, 19(7): 633–649. doi:10.1108/01443579910271656
Ahire, S.L., O’Shaughnessy, K.C. (1998). The role of top management commitment in quality management: an empirical analysis of the auto parts industry, International Journal of Quality Science, 3(1): 5–37. doi:10.1108/13598539810196868
Ahire, S.L., Dreyfus, P. (2000). The impact of design management and process management on quality: an empirical examination, Journal of Operations Management, 18(5): 549–575. doi:10.1016/S0272-6963(00)00029-2
Anderson, J.C., Rungtusanatham, M., Schroeder, R.G. (1994). A theory of quality management underlying the Deming management method, Academy of Management Review, 19(3): 472-509.
Anderson, J.C., Rungtusanatham, M., Schroeder, R.G., Devaraj, S. (1995). A path analytic model of a theory of quality management underlying the Deming Management Method: preliminary empirical findings, Decision Sciences, 26(5): 637–658. doi:10.1111/j.1540-5915.1995. tb01444.x
Bartlett, G. R. (1950). American Journal of Physiology, 163: 614.
93
Int. J. Prod. Manag. Eng. (2015) 3(2), 87-95
Creative Commons Attribution-NonCommercial-NoDerivatives 4.0 International
Bell, R.R., Burnham, J.M. (1989). The paradox of manufacturing productivity and innovation, Business Horizons, 32(5): 58–64. doi:10.1016/0007-6813(89)90084-0
Burack, E.H., Burack, M.D., Miller, D.M., Morgan, K. (1994). New paradigm approaches in strategic human resource management, Group and Organization Management, 19(2): 141–159. doi:10.1177/1059601194192002
Burt, D.N. (1989). Managing suppliers up to speed, Harvard Business Review, 67(4): 127–135.
Chase, R.B., Aquilano, N.J., Jacobs, F.R. (2001). Operations Management for Competitive Advantage, 9th ed. McGraw-Hill, Boston, MA.
Choi, T.Y. (1995). Conceptualizing continuous improvement: implications for organizational change, Omega, 23(6): 607–624. doi:10.1016/0305-0483(95)00041-0
Cooper, M.C., Ellram, L.M. (1993). Characteristics of supply chain management and the implications for purchasing and logistics strategy, The International Journal of Logistics Management, 4(2): 13–24. doi:10.1108/09574099310804957
Daft, R.L. (1998). Organization Theory and Design. South-Western College Publishing, Cincinnati, OH.
Das, A., Handfield, R.B., Calantone, R.J., Ghosh, S. (2000). A contingent view of quality management—the impact of international competition on quality, Decision Sciences, 31(3): 649–690. doi:10.1111/j.1540-5915.2000.tb00938.x
Deming, W.E. (1986). Out of the Crisis. MIT Press, Cambridge, MA.
Ellram, L.M. (1991). A managerial guideline for the development and implementation of purchasing partnerships, International Journal of Purchasing and Materials Management, 27(3): 2–8.
Ettkin, L.P., Helms, M.M., Haynes, P.J. (1990). People: a critical element of new technology implementation, Industrial Management, 32(5): 27–29.
Evans, J., Lindsay, W. (2008). The Management and Control of Quality, 7th edition. USA: Thomson South Western.
Flynn, B.B., Schroeder, R.G., Sakakibara, S. (1995). The impact of quality management practices on performance and competitive advantage, Decision Sciences, 26(5): 659–691. doi:10.1111/j.1540-5915.1995.tb01445.x
Forza, C., Filippini, R. (1998). TQM impact on quality conformance and customer satisfaction: a causal model, International Journal of Production Economics, 55(1): 1-20. doi:10.1016/S0925-5273(98)00007-3
Garvin, D.A. (1987). Competing on the eight dimensions of quality, Harvard Business Review, 65(6): 101–109.
Goodstein, L., Burke, W. (1991). Creating successful organization change, Organizational Dynamics, 19(4): 5–17. doi:10.1016/0090-2616(91)90050-J
Hackman, J.R., Wageman, R. (1995). Total quality management: empirical, conceptual, and practical issues, Administrative Science Quarterly, 40(2): 309–342. doi:10.2307/2393640
Hamlin, B., Reidy, M., Stewart, J. (1997). Changing the management culture in one part of the British Civil Service through visionary leadership and strategically led researchbased OD interventions, Journal of Applied Management Studies, 6(2): 233–251.
Handfield, R., Ghosh, S. (1994). Creating a quality culture through organizational change: a case analysis, Journal of International Marketing, 2(3): 7–36.
Handfield, R., Ghosh, S., Fawcett, S. (1998). Quality-driven change and its effects on financial performance, Quality Management Journal, 5(3): 13–30.
Handfield R.B., Jayaram J., Ghosh S. (1999). An empirical examination of quality tool deployment patterns and their impact on performance, International Journal of Production Research, 37(6): 1403-1426. doi:10.1080/002075499191328
Ho, D.C.K., Duffy, V.G., Shih, H.M. (1999). An empirical analysis of effective TQM implementation in the Hong Kong electronics manufacturing industry, Human Factors and Ergonomics in Manufacturing, 9(1): 1–25. doi:10.1002/(SICI)1520-6564(199924)9:1<1::AID-HFM1>3.0.CO;2-L
Jackson, R.W.B., Ferguson, G.A. (1952). Manual of Education Statistics, University of Toronto, Department of educational research, Toronto. Juran, J.M. (1981). Product quality – a prescription for the West, Part I. Management Review, 70(6): 8–14.
Juran, J.M. (1988). On planning for quality. Collier Macmillan, London.
Kotler, P. (1982). Marketing for Nonprofit Organization, 2nd Edition. Prentice-Hall, Englewood Cliffs, NJ.
Krause, D.R., Handfield, R.B., Scannell, T.V. (1998). An empirical investigation of supplier development: reactive and strategic processes, Journal of Operations Management, 17(1): 39–58. doi:10.1016/S0272-6963(98)00030-8
Leonard, F.S., Sasser, W.E. (1982). The incline of quality. Harvard Business Review, 60(5): 163–171.
Lockamy III, A. (1998). Quality-focused performance measurement systems: a normative model, International Journal of Operations and Production Management, 18(8):740–766. doi:10.1108/01443579810217440
Malhotra, N.K. (1999). Marketing Research. An Applied Orientation. International Edition. 3rd edition Prentice Hall, London.
Saraph, J.V., Benson, G.P., Schroeder, R.G. (1989). An instrument for measuring the critical factors of quality management, Decision Sciences, 20(4): 810–829. doi:10.1111/j.1540-5915.1989.tb01421.x
Schroeder, R.G., Scudder, G.D., Elm, D.R. (1989). Innovation in manufacturing, Journal of Operations Management, 8(1): 1–15. doi:10.1016/ S0272-6963(89)80002-6
94 Int. J. Prod. Manag. Eng. (2015) 3(1), 87-95 Creative Commons Attribution-NonCommercial-NoDerivatives 4.0 International
Shetty, Y.K. (1988). Managing product quality for profitability, SAM Advanced Management Journal, 53(4): 33–38.
Smith,T.D., McMillan,B.F. (2001). A primer of model fit Indices in Structural Equation Model, Annual meeting of the southwest educational research association. New Orleans, LA, February 1-3.
Tillery, K.R. (1985). An exploratory study of quality function with five manufacturing organizations. PhD thesis, Georgia State University. Trent, R.J., Monczka, R.M. (1999). Achieving world-class supplier quality, Total Quality Management, 10: 927–938.
doi:10.1080/0954412997334
Vranaki, M., Vranakis, S., Chatzoglou, P. (2010). The impact of Total Quality Management in the Greek business performance, Portuguese Journal of Quantitative Methods, 1(2): 39-51
Wilson, D.D., Collier, D.A. (2000). An empirical investigation of the Malcolm Baldrige National Quality award causal model, Decision Sciences, 31: 361–390. doi:10.1111/j.1540-5915.2000.tb01627.x
Wisner, J.D., Eakins, S.G. (1994). A performance assessment of the US Baldrige Quality Award winner, International Journal of Quality and Reliability Management, 11(2): 8–25. doi:10.1108/02656719410051643
Wright, P.M. and Snell, S.A. (2002). Research update, Human Resource Planning, Vol. 25 No. 2, pp. 45-54.
Zeitz, G., Johannesson, R., Ritchie Jr., J.E. (1997). An employee survey measuring total quality management practices and culture, Group and Organization Management, 22(4): 414–444. doi:10.1177/1059601197224002
Appendix 1. Check the one-dimensional nature and reliability
Factors Variables Loading KMO TVE Bartlett’s Sig Cronbach alpha
Leadership Aa1 Aa2 Aa3 Aa4 Ab1 Ab2 0,745 0,710 0,690 0,668 0,710 0,750
0,750 60,386 0,00 0,675
Strategic Planning B2B3
B4
0,730 0,907
0,809 0,584 67,025 0,00 0,747
Customer focus C1 C3 C4 C5 0,671 0,522 0,814 0,692
0,625 52,623 0,00 0,596
Information and data analysis
Da1 Da2 Db2 Db3 Db4 Db5 0,677 0,792 0,877 0,856 0,850 0,614
0,748 62,575 0,00 0,705
Human resource management
Ε1 Ε2 Ε3 Ε4 0,734 0,810 0,727 0,513
0,685 51,647 0,00 0,658
Process management F1F2
F3
0,674 0,746
0,731 0,611 51,514 0,00 0,525
Supplier management G3aG1 G3b
0,702 0,650
0,673 0,801 52,070 0,00 0,674
Product design H1 H2 H3 H4 0,780 0,710 0,752 0,561
0,664 50,846 0,00 0,664
Business results I1 I2 I3 I4 I5 0,826 0,776 0,540 0,667 0,652
0,704 56,941 0,00 0,704
95
Int. J. Prod. Manag. Eng. (2015) 3(2), 87-95
Creative Commons Attribution-NonCommercial-NoDerivatives 4.0 International
PME
I
J
https://ojs.upv.es/index.php/IJPME
International Journal of Production Management
and Engineering http://dx.doi.org/10.4995/ijpme.2015.3320Received2014-10-17 Accepted: 2015-05-07
Quantitative assessment of sustainable city logistics
Rafael Grosso-delaVegaa,i and Jesús Muñuzuria,ii a Dpto. de Organización Industrial y Gestión de Empresas II. ETSI. Universidad de Sevilla.
Camino de los Descubrimientos, s/n. Isla de la Cartuja, 41092, Seville, Spain a,i [email protected]
a,ii [email protected]
abstract: The aim of this paper is to seek an answer to an specific question: how to make city logistics sustainable? This question in principle has no specific answer. By contrast, it could be answered in many and varied ways. Behind the search for some of these answers lies the development of a roadmap which this work aims to present. The research lines, the theoretical framework and methodology of the roadmap will be explained. Although the current status of the roadmap, its duration and timing still need to be completed, the main facts, as well as the results obtained to date and the expected results are here presented.
Key words: City logistic, Sustainable policies, Access time windows, Waste collection, Optimization.
1. Introduction
1.1. The paradigmatic framework
A multiplicity of different kinds of goods are constantly entering, transiting and leaving urban areas: consumer goods, building materials, waste, packaging and mailings, etc. (Dablanc, 2007). It is well known that the urban freight transport includes heterogeneous goods and different types of vehicles of different sizes. In addition, the movement urban goods has a direct and fundamental influence on economics (Muñuzuri et al., 2005) and is vital to industry performance. That is why urban freight management is a necessary challenge which nevertheless implies a high complexity. But goods are not only transported in urban environments, so the first problem which efficient management of urban freight transport finds is the very notion of transport itself and its variants (Figliozzi, 2012). Traffic congestion has become a daily phenomenon due to the increasing amount of traffic and the limited capacity of the road network. And these growing delays are very costly for both private road users and logistics and distribution providers. This causes high economic costs to these providers, in an attempt to avoid possible delays in deliveries or
collections to customers, by additional vehicles and its own drivers. In addition, violations of driving and traffic rules need close attention. Furthermore, it increases externalities related to the environment, such as emissions of CO2.
Another important problem that urban freight transport has to face is the urban morphology. European cities have several common characteristics that influence directly their mobility and their businesses. Likewise it imposes some restrictions on the flow associated to the supply of goods. First, most of its city centers have a radial structure with a high concentration of shopping areas, restaurants and other centers of social attraction. This structure, which is inherited from the Middle Ages, generates asymmetric flows of people (going to work, to shop, to eat or to visit tourist attractions) with those flows associated with goods. Parking problems, which virtually exist at the center of all urban areas, increase in Europe due to its peculiar morphology consisting of alleys and narrow streets (Ligocki & Zonn, 1984; Muñuzuri et al., 2012b).
In addition, the road transport sector in Spain has not been considering City Logistics as an industrial subsector. Therefore, there are no databases showing the importance of this activity.
97 Int. J. Prod. Manag. Eng. (2015) 3(2), 97-101
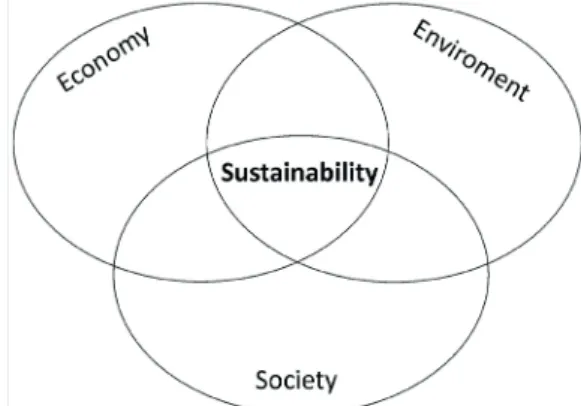
On the other hand, from the 90´s the concept of sustainable development has been attracting worldwide attention. Sustainable development has proven to be an enduring and compelling concept because it points towards a clear management policy. Also, it is also flexible enough to adapt to new challenges, technological and economic conditions and social aspirations. It appeals to the general public and the scientific community in particular, as it involves a systemic view of economy and ecology, and requires solutions that protect the interests of future generations (Goldman & Gorham, 2006). Sustainable development meets the needs of the present without compromising the ability of future generations to meet their own needs. It is widely accepted that these needs include economic, social and environmental developments (see Figure 1). This “triple” point of view understands that development should be bearable (socially and environmentally), fair (socially and economically) and viable (environmentally and economically) and, therefore, sustainable and durable. The representation of the “three pillars of sustainability” implies the fact that the concept of sustainability itself is the result of interactions between these three dimensions. That is the reason why they cannot, or rather should not, be analysed separately from each other (Rossi et al., 2012).
In response to the intersection of urban freight transport and the concept of sustainability, a holistic approach to globalize planning and urban management needs to be adopted (Robusté et al., 2000). Such a challenge needs to consider together all operations and services present in the city; special attention to the sustainability of the system should be paid. This new discipline, which aims at systemic or holistic optimization of city services, could be called Sustainable City Logistics.
Figure 1. Schematic view of the “three pillars of sustainability”.
1.2. Answering the questions
Therefore the question to answer in this roadmap is how to make city logistics sustainable. This question is very broad and covers many answers. That is why there has been an attempt at setting more specific objectives for our roadmap. Consquently, and for this purpose this work aims to solve two sub questions related to this capital aspect.
1.2.1. Are sustainability policies really sustainable?
The first sub question which is being addressed is about road freight transport. It is well known that road freight transport is causing a number of social, environmental and economic negative impacts in many cities around the world. Therefore sustainable city logistics must be the solution to the problems of urban centers, and researchers must have as their main objective to reduce these impacts without penalizing cities needs (Chang & Yen, 2012). Moreover, policy makers and decision makers aim at decreasing the above mentioned variety of negative social, environmental and economic impacts of urban freight transport. Because of this several initiatives and policies have been implemented to try reduce them (temporal regulation of access, promotion of cooperation between public and private sector, etc.). Some of the objectives of these policies are to improve the environment (air and noise quality), securing pedestrian’s space and the prevention of accidents. They all have sustainability as the ultimate goal (Dalkmann & Brannigan, 2007).
In this situation, City Logistics researches, reflect upon the impact of these policies on the different areas and upon the interests of the different stakeholders involved in urban areas and its centers (citizens, residents, merchants, transporters, local authorities, etc.). This is a field that has been investigated in recent years (Quak & de Koster, 2009; Gonzalez-Feliu et al., 2012; Stathopoulos et al., 2012). Given the heterogeneity of the interests of these stakeholders, coordination becomes somewhat cumbersome, so they generally act independently and without any centralized control. But this paper seeks to answer a less particular issue; a question which captures the overall interests of all stakeholders involved (general interests should be above individuals): are sustainability policies really sustainable? Therefore, the first purpose of this work is to evaluate one of these policies in a quantitative way to answer the question (Muñuzur et al., 2013).
98 Int. J. Prod. Manag. Eng. (2015) 3(1), 97-101 Creative Commons Attribution-NonCommercial-NoDerivatives 4.0 International
1.2.2. How to make urban fleets more sustainable?
The second sub-question that arises from the main one is about the urban fleets, more specifically about the fleet in charge of recyclable waste.
Trying to solve the problem of waste collection in cities is not a new problem. Back in the 70’s, authors already addressed the problem, either from a mathematical point of view (Marks & Liebman, 1970), or by modeling and solving a vehicle routing problem (VRP) (Beltrami & Bodin, 1974; Turner & Hougland, 1975). This problem is not easy to solve since it falls under the classification of NP-hard. The increased levels of consumption and the waste generation associated with it, the environmental considerations and the sustainability of cities have led to the emergence of new European and national policies regarding the management of municipal waste. An example of this is the National Integrated Waste Plan implemented in Spain in 2009, which is to continue the previous National Urban Waste Plan (PNRU). Among other things, it enforces municipalities over 5000 inhabitants to ensure proper separation for a selective collection of waste. Such measures imply the consideration of new challenges to municipalities, even more so in the economic recession framework in which we live. Different types of dumpsters, different types of waste, the location of dumpsters, pollution, energy consumption, cost reduction and the like, are some of these challenges. In this sense, authors address the problem from such perspectives as the consumption of fuel (Sonesson, 2000), or having in mind environmental and economic goals.
Nowadays the emergence of new technologies and the drop in their price allow researchers to find new tools to solve this problem. Examples of these new technologies are, among others, the Geographic Information System (GIS), volumetric sensors, or radio frequency identification (RFID). By using this technology, some issues may be addressed. These include eliminating unnecessary stops, fleet reduction and balancing according to demand, pollution impact reduction, operating costs reduction, etc. These issues are actually the basis of some research projects undertaken in recent years (Chang, Lu, & Wei, 1997; Nuortio et al., 2006) . Needlles to say that all these new lines of reseach offer a great potential for future work.
It is in this direction that this work moves. This part of the project addresses the problem of waste disposal in urban areas with the real-time level data
of the dumpsters. In particular, the work focuses on the collection of glass containers. A more sustainable collect policy is present and compared with other classical optimization algorithms (Grosso-delaVega et al., 2014).
2. Proposed Solutions
The objectives of the roadmap will focus on:
- Characterize and analyse the situation of city logistics and characterize and analyze the situation of recyclable waste collection in the European Union and Spain.
- Study the existing scientific literature on city logistics and recyclable waste collection, especially in the field of sustainability and city centers.
- Study of the determining factors for sustainable development of city logistics in centers in European and the particularly factors in Spanish cities.
- Design optimization models for sustainable city logistics improvement and for better understanding and analysis.
- Development of a simulation environment, using heuristics and metaheuristics, specifically designed for City Logistic problems in city centers.
- Validation of the models proposed in the simulation environment.
As already mentioned above, the proposed methodology focuses on optimization algorithms. Also, also solutions need to found in a relatively short time; in this way fast optimization mechanisms such as metaheuristics, heuristics and techniques are implemented. These will be compared with existing techniques in order to be able to verify the hypothesis.
The work has been divided into four stages, which be conducted sequentially:
1. Study of the history of freight transport in Europe and the state of the art in terms of optimization of urban transport routes and its sustainability. 2. Development of a simulation environment in
which to test the heuristics and metaheuristics. 3. Development and codification of the different
heuristics and metaheuristics are considered to solve the said problems.
99 Int. J. Prod. Manag. Eng. (2015) 3(2), 97-101
Creative Commons Attribution-NonCommercial-NoDerivatives 4.0 International
4. Analysis of heuristics raised. Study and compari-son of the results obtained. Analysis of the im-provements that the system would provide in a real environment.
3. Expected and existent
contributions
This roadmap project was initiated in September 2012. Since then there have been many experiments and some intermediate results have been obtained. There are still results to be complete, however, although some of the responses to the issues raised have been published in the following papers derived from the roadmap: Grosso-delaVega et al. (2014) and Muñuzuri et al. (2013).
Other published works related to the main theme of the roadmap are: Muñuzuri et al. (2012a) and Muñuzuri et al. (2011).
In their paper, Muñuzuri et al., (2013) developed a model based on VRP logic called Vehicle Routing Problem with Access Time Windows (VRPATW). This model was solved using genetic algorithms. They provided conclusive results, about the sustainability of the policies adopted in the city centers. Following the line of research initiated earlier, the autors are currently working on the development and resolution of the model. It is intended to solve as a mathematical model and using a Greedy heuristic. In this way the model would be solved by mathematical programming, using a metaheuristic and also a heuristic. The aims are:
- To be able to answer the questions raised in a more precise way.
- Perform a comparison of the different techniques used in terms of methodology. This comparison is intended be accomplished in terms of:
o Proximity to the optimal solution
o Size of the problem that can be solved with each technique
o Solving times.
At present, this research project is at the design of the experiment phase stage. These experiments must be designed in order to be solved by means of the three techniques. It must be said that the greedy heuristic is being tested so that it solves the problem satisfactorily. With respect to the line of garbage collection, this research project is currently trying to improve the resolution algorithm in order to to improve the results.
At the time that this work was written had another year and a half to the end of the stipulated period of time for the finalization of the roadmap. Given the published results and the results that could be obtained, it is expected that two publications can be submitted in the period of time left.
Aditionally, potential contributions of the roadmap might include the following:
- A move from the theoretical level to the practical level and transfer the results of this roadmap to local authorities.
- Continue developing as a scientist.
References
Beltrami, E. J., Bodin, L. D. (1974). Networks and vehicle routing for municipal waste collection. Networks, 4(1): 65-94. doi:10.1002/ net.3230040106
Chang, N.-B., Lu, H., Wei, Y. (1997). GIS technology for vehicle routing and scheduling in solid waste collection systems. Journal of Environmental Engineering, 123(9): 901-910. doi:10.1061/(ASCE)0733-9372(1997)123:9(901)
Chang, T.-S., Yen, H.-M. (2012). City-courier routing and scheduling problems. European Journal of Operational Research, 223(2): 489-498. doi: 10.1016/j.ejor.2012.06.007
Dablanc, L. (2007). Goods transport in large European cities: Difficult to organize, difficult to modernize. Transportation Research Part A: Policy and Practice, 41(3): 280-285. doi: 10.1016/j.tra.2006.05.005
Dalkmann, H., Brannigan, C. (2007). Transport and Climate Change. Module 5e. Sustainable Transport: A Sourcebook for Policy-makers in Developing Cities. Deutsche Gesellschaft fuer Technische Zusammenarbeit (GTZ). Available online at http://www.gtkp.com/assets/ uploads/20091123-095443-1692-5e_TCC.pdf.
Figliozzi, M. A. (2012). The time dependent vehicle routing problem with time windows: Benchmark problems, an efficient solution algorithm, and solution characteristics. Transportation Research Part E: Logistics and Transportation Review, 48(3): 616-636. doi: 10.1016/j. tre.2011.11.006
100 Int. J. Prod. Manag. Eng. (2015) 3(1), 97-101 Creative Commons Attribution-NonCommercial-NoDerivatives 4.0 International
Goldman, T., Gorham, R. (2006). Sustainable urban transport: Four innovative directions. Technology in Society, 28(1-2): 261-273. doi: 10.1016/j.techsoc.2005.10.007
Gonzalez-Feliu, J., Ambrosini, C., Pluvinet, P., Toilier, F., Routhier, J.-L. (2012). A simulation framework for evaluating the impacts of urban goods transport in terms of road occupancy. Journal of Computational Science, 3(4): 206-215. doi:10.1016/j.jocs.2012.04.003 Grosso-delaVega, R., Muñuzuri Sanz, J., Rodriguez Palero, M., Teba Fernandez, J. (2014). Optimization of recyclable waste collection using
real-time information. Annals of Industrial Engineering 2012 (pp. 171-177): Springer.
Ligocki, C., Zonn, L. E. (1984). Parking problems in central business districts. Cities, 1(4): 350-355. doi:10.1016/0264-2751(84)90006-4 Marks, D. H., Liebman, J. (1970). Mathematical analysis of solid waste collection. Public Health Service Publication (Vol. 2104): Department
of Health, Education and Welfare.
May, A. D. (2013). Urban transport and sustainability: The key challenges. International journal of sustainable transportation, 7(3): 170-185. doi:15568318.2013.710136
Muñuzuri, J., Cortés, P., Grosso, R., Guadix, J. (2012a). Selecting the location of minihubs for freight delivery in congested downtown areas. Journal of Computational Science, 3(4): 228-237. doi: 10.1016/j.jocs.2011.12.002
Muñuzuri, J., Cortés, P., Guadix, J., Onieva, L. (2012b). City logistics in Spain: Why it might never work. Cities, 29(2): 133-141. doi: 10.1016/j.cities.2011.03.004
Muñuzuri, J., Grosso, R., Cortés, P., Guadix, J. (2011). Development of a Cost Model for Intermodal Transport in Spain. In S. Renko (Ed.), Supply Chain Management - New Perspectives. doi:10.5772/22740
Muñuzuri, J., Grosso, R., Cortés, P., Guadix, J. (2013). Estimating the extra costs imposed on delivery vehicles using access time windows in a city. Computers, Environment and Urban Systems, 41: 262-275. doi: 10.1016/j.compenvurbsys.2012.05.005
Muñuzuri, J., Larrañeta, J., Onieva, L., Cortés, P. (2005). Solutions applicable by local administrations for urban logistics improvement. Cities, 22(1): 15-28. doi: 10.1016/j.cities.2004.10.003
Nuortio, T., Kytöjoki, J., Niska, H., Bräysy, O. (2006). Improved route planning and scheduling of waste collection and transport. Expert Systems with Applications, 30(2): 223-232. doi: 10.1016/j.eswa.2005.07.009
Quak, H. J., de Koster, M. B. M. (2009). Delivering Goods in Urban Areas: How to Deal with Urban Policy Restrictions and the Environment. Transportation Science, 43(2): 211-227. doi: 10.1287/trsc.1080.0235
Robusté, F., Campos, J. M., Galván, D. (2000). Nace la logística urbana. Paper presented at the Actas del IV Congreso de Ingeniería del Transporte. Editado por JV Colomer y A. García. Schleske, E., Lozano, A., Antún, JP (2001). Location of a Logistic Platform for Improving the Shoe Distribution in Mexico City. Proceedings of the XXXII Annual Conference of the Operational Research Society of Italy. Rossi, R., Gastaldi, M., Gecchele, G. (2012). Comparison of fuzzy-based and AHP methods in sustainability evaluation: a case of traffic
pollution-reducing policies. European Transport Research Review, 5(1): 11-26. doi: 10.1007/s12544-012-0086-5
Sonesson, U. (2000). Modelling of waste collection–a general approach to calculate fuel consumption and time. Waste Management and Research, 18(2): 115-123. doi:10.1177/0734242X0001800203
Stathopoulos, A., Valeri, E., Marcucci, E. (2012). Stakeholder reactions to urban freight policy innovation. Journal of Transport Geography, 22: 34-45. doi: 10.1016/j.jtrangeo.2011.11.017
Turner, W. C., Hougland, E. S. (1975). The Optimal Routing of Solid Waste Collection Vehicles. AIIE Transactions, 7(4): 427-431. doi:10.1080/05695557508975027
101 Int. J. Prod. Manag. Eng. (2015) 3(2), 97-101
Creative Commons Attribution-NonCommercial-NoDerivatives 4.0 International
PME
I
J
https://ojs.upv.es/index.php/IJPME
International Journal of Production Management
and Engineering http://dx.doi.org/10.4995/ijpme.2015.3318Received2014-10-16 Accepted: 2015-02-28
Fuzzy maintenance costs of a wind turbine pitch control device
Mariana Carvalhoa,b, Eusébio Nunesb,i and José Telhadab,ii a Polytechnic Institute of Cávado and Ave, Barcelos, Portugal
b Centro Algoritmi, University of Minho, Braga, Portugal
b,ii [email protected]
abstract: This paper deals with the problem of estimation maintenance costs for the case of the pitch controls system of wind farms turbines. Previous investigations have estimated these costs as (traditional) “crisp” values, simply ignoring the uncertainty nature of data and information available. This paper purposes an extended version of the estimation model by making use of the Fuzzy Set Theory. The results alert decision-makers to consequent uncertainty of the estimations along with their overall level, thus improving the information given to the maintenance support system.
Key words: Wind turbine, Pitch Control, Maintenance cost, Fuzzy sets.
1. Introduction
Wind power technology is one of the major growing areas in the energy sector. In a few years’ time wind power has gone from a minor energy source to a large-scale industry. Proper and well-planned service and maintenance strategies are very important to ensure an efficient energy production and required to effectively reduce the costs associated with Wind Turbine (WT) support.
Maintenance management approaches aim to find a sound balance between costs and benefits of performing maintenance. Some experiments and studies show that there is a large potential to reduce overall costs in the maintenance of WTs (e.g. Bertling et al., 2006).
According to Morthorst (2003), Operation and Maintenance (O&M) costs constitute a sizeable share of the total annual costs of a WT. For a new machine, O&M costs might easily have an average share over the lifetime of the WT of approximately 20% to 25% of the total cost per kWh produced. In an attempt to shed some light on this problem, other works (e.g. Carvalho et al., 2013a) has been focused on studying the active power control system or pitch control system of WTs.
This system assumes primordial importance in the wind turbine, because: i) it is crucial in the optimization of the turbine efficiency; ii) it is very important with regard to the safety of the turbine (Naranjo et al., 2011); and iii) reveals frequent failures and large residence time in failure state compared to other systems of the machine (Nilsson & Bertling, 2007; Carvalho et al., 2013b). Consequently, to guarantee a normal operation, they are usually needs maintenance actions, which are only provided by the manufacturer (Teresa, 2007). Moreover, information related to failure modes, (un) availability and maintenance costs of these systems remain confidential and only the manufacturer has knowledge about them. This situation does not facilitate, for example, the work of company managers who search for better warranty and maintenance contracts.
In complex systems, such as pitch control systems, the maintenance management function is commonly supported by analyses of collected data as well as on the quality and experience of maintenance engineers and others experts in this field. In this context, this function is often very difficult, and unrealistic decisions come out from the process with undesirable frequency. So, it is expected that the Fuzzy Set Theory, applied in the maintenance management, will lead to more realistic decisions.
103 Int. J. Prod. Manag. Eng. (2015) 3(2), 103-109
The study presented in this paper is based on an analysis of two years data collected from 21 identical WTs installed in a wind farm in Portugal. The data were provided confidentially by the company that manages the wind farm. For this reason, the name of the company and the WT brand are not revealed. Each WT under analysis has a nominal power of 2 MW, three rotor blades and an active power control (pitch).
The main objective of the study consists on reporting the gathering process of information about WT functioning and its failures and costs, and conducting some reliability analyses, providing an estimate of the associated maintenance costs of the pitch system. The remainder part of the paper is organized as follows. Section 2 introduces the fundamentals of the Fuzzy Set Theory. Section 3 describes the system under study, the pitch control of the WTs, and its fault and error states. In Section 4, it is proposed a model for the fuzzy maintenance costs of the pitch control system. Section 5 reports the results of the application of the proposed model and discusses its practical relevance. Finally, the main conclusions of this study are discussed in Section 6.
2. Fuzzy Set Theory
2.1. Introduction
The Fuzzy Set Theory has been extensively studied in the past 30 years, largely motivated by the need for a more expressive mathematical structure to deal with human factors. This theory has a major impact on industrial engineering and maintenance manage-ment systems. During the last decade, several models for maintenance management problems have been incorporating uncertainty of their parameters by us-ing fuzzy sets (e.g. Yuniarto and Labib, 2006; Khan-lari et al., 2008; Sharma et al., 2008; Shen et al., 2009). Nevertheless, most of the current literature on maintenance simply omits the uncertainty that is in-herent to real processes. Fuzzy sets are adequate, for instance, to estimate the lifetime or the failure rate of a given equipment that operates in different environ-ments. In most cases, statements in plain language may be the best form to express the knowledge about a system. However, this information is naturally very inaccurate and any realistic estimate inferred from that is always an approximation.
2.2. Basic Concepts
A fuzzy set A, in the universe of discourse X, is defined by a membership function, μA(x): X→[0,1],
which assigns, for each element of X, a membership degree to A.
Definition 1: Given a fuzzy set A defined on X and any number αÎ(0, 1], the α-cut set, Aα, is the crisp set
expressed by Eq. (1).
Aα ={x: A(x) ≥ α} (1)
The α-cut set concept allows us to manipulate fuzzy sets by using the interval arithmetic. Alternatively, such manipulation can be performed by the extension principle introduced by Zadeh (1975). This is an important tool by which classical mathematical theories can be fuzzified. On the other side, defuzzification is the conversion of a fuzzy quantity to a crisp quantity. Despite the fact that the bulk of the information emerging every day is fuzzy, most of the actions or decisions implemented by humans or machines are crisp or binary. A detailed application of defuzzification methods can be found in Klir and Yuan (1995).
Among the innumerous types of fuzzy sets, those that are defined in the set of the real numbers assume a particular importance. These sets have a quantitative meaning and under certain conditions they can be treated as fuzzy numbers, e.g. when intuitively and linguistically they represent approximate numbers, such as “the preventive maintenance duration is around τ hours” (Ross 1995).
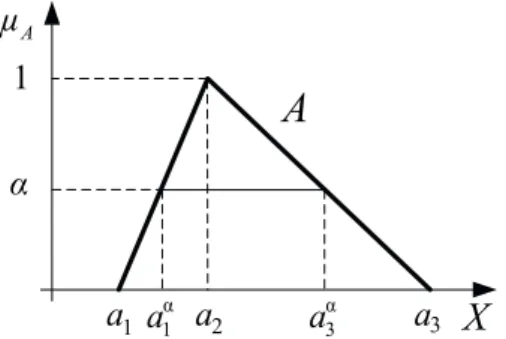
In reliability and maintenance studies, the triangular and trapezoidal numbers are the most used number patterns because their simplicity and adequacy on representing uncertainty, vagueness and subjectivity of data and human judgment. Without loss of generality, this paper only deals with triangular fuzzy numbers. A triangular fuzzy number, A, can be defined by a triplet (a1, a2, a3), where
μA(a1) = μA(a3) = 0 and μA(a2) = 1. Each α-cut, Aα, is
a closed interval represented as Aα = [a
1α, a3α], where:
a1α = (a2 – a1) α + a1
a3α = a3 – (a3 – a2) α (2)
The family of cut sets {Aα: αÎ(0, 1]} is a
representation of the fuzzy number A. An illustrative graphic representation of A is shown in Figure 1.
104 Int. J. Prod. Manag. Eng. (2015) 3(1), 103-109 Creative Commons Attribution-NonCommercial-NoDerivatives 4.0 International