Study of Multi-Classification of Advanced Daily
Life Activities on SHIMMER Sensor Dataset
Amir Mehmood
1, Akhter Raza
1, Adnan Nadeem
1, Umair Saeed
11
Department of Computer Science, Federal Urdu University of Arts, Science and Technology, Karachi, Pakistan E-mail: {aamir.mehmood, akhter, adnan.nadeem, umair.saeed}@fuuast.edu.pk
Abstract: Today the field of wireless sensors have the dominance in almost every person’s daily life. Therefore researchers are exasperating to make these sensors more dynamic, accurate and high performance computational devices as well as small in size, and also in the application area of these small sensors. The wearable sensors are the one type which are used to acquire a person’s behavioral characteristics. The applications of wearable sensors are healthcare, entertainment, fitness, security and military etc. Human activity recognition (HAR) is the one example, where data received from wearable sensors are further processed to identify the activities executed by the individuals. The HAR system can be used in fall detection, fall prevention and also in posture recognition. The recognition of activities is further divided into two categories, the un-supervised learning and the supervised learning. In this paper we first discussed some existing wearable sensors based HAR systems, then briefly described some classifiers (supervised learning) and then the methodology of how we applied the multiple classification techniques using a benchmark data set of the shimmer sensors placed on human body, to recognize the human activity. Our results shows that the methods are exceptionally accurate and efficient in comparison with other classification methods. We also compare the results and analyzed the accuracy of different classifiers.
Keywords: Advanced Daily Life Activities, Benchmark Dataset, Classifiers, WBAN, Human Activity Recognition, Performance Analysis, Shimmer mote, Wireless sensors.
1.
Introduction
The field of wireless sensor networks is taking tremendous attraction from the researchers to elevate and improve the human’s lifestyle. The sensor technology is used for monitoring the different type of applications [26] with improve QoS [27]. Some of the examples of these applications are entertainment, fitness, health care, GPS, environmental and structural monitoring, temperature sensing, mining, assistive technology, human activity recognition, etc. The wireless sensors network [24] [25], can be used to capture physical characteristics of a human, environment or structures. The network of wireless sensors, placed on a human body is called wireless body area sensor networks (WBASN). The major WBASN applications are health care, fitness, sports, military operations and assistive technology. The main application of assistive technology is to monitor and recognize the daily life activities performed by humans. These wearable sensors capture the physical parameters of the human body and send the captured data to a nearby base station for further processing. This data is used for identification of different complications associated with humans, posture and activity recognitions. The main cause of study related to the recognition of human activity is to identify the pattern of physical or postural movements. The recognition of activities and postures further used for fall
detection and fall prediction of weak patients and elderly peoples.
The two types of sensors are used in human recognition systems. The first type is external and the other is wearable to the body. In the first type, surveillance cameras are used to detect the human activity, while the others are wearable sensors. The surveillance cameras capture and send the video streaming to a nearby base station for further processing while wearable sensors capture the physical phenomenon of attached body and send it to coordinator or sink device for further forwarding to a base station (if the scenario is a multi-hop WBAN) or directly to the base station (if the scenario is single-hop WBAN). The multi-hop and single-hop WBAN scenario is depicted in figure 1.
Figure 1. (a) Single Hop WBAN (b) Multi Hop WBAN The data set we used in this paper is mHealth [1]. It is a benchmark data set comprises of 12 activities perform by 10 subjects with good in health and wearable SHIMMER2 [2] sensor devices are used for capturing the activities. SHIMMER (Sensing Health with Intelligence, Modularity, Mobility and Experimental Reusability) is an extraordinarily flexible platform to be used in several researches related to the fields of biomedical and healthcare. SHIMMER devices can be used in ambient, physiological and kinematics sensing application, the main application of these sensors is to provide support to independently living elderly peoples. According to the description of mHealth dataset, the data is gathered from a subject by placing three devices on a subject’s chest, right wrist and left ankle. These devices were integrated with the sensors like accelerometer, gyro meter and a magnetometer. The device placed on the chest is also included with electrocardiograph (ECG).
this study is to understand the human activity recognition using the third generation shimmer sensors. Our final aim is to analyze the feasibility of using certain daily life activities data (from shimmer sensor prototype) for fall detection and its risk estimation in elderly. Therefore we are now in the process of developing our own dataset using SHIMMER 3 (third generation of shimmer sensors devices) which will be publically available soon.
The analytic platform we used is Knime [3]. Knime (The Konstanz Information Miner) is an open source GUI (graphical user interface) based data analytic tool. Knime used the pipe-lining concept to integrate various machine learning and data mining components.
The other aspect of this study is, to evaluate different supervised learning algorithms. Therefore we used seven different classification algorithms in term of acquiring best accuracy results. The correct classification of activities through these types of data sets tends to create well balanced and more accurate fall detection systems. The classifiers, we used in our work are Random Forest, Neural Network, Support Vector Machine, Decision Tree, K Nearest Neighbor, Naive Bayes and Fuzzy Rule based classifier. The main reason behind selection of all these classifier is to identification of best classifier for a specific group of activities. In this paper, we first categorically selected four activities (standing, waist bends forward, cycling and jump front and back) keeping in mind that every group of activity type mentioned in table 2 should be accumulated for classification then analyze and compare the results and accuracy of different classifiers.
The rest of the paper is organized as follows, in the next section we present some related work, then in section 3, first we described the classifiers, we used in this paper, then methods are defined, evaluation and results are shown in section 4 and finally we conclude this paper.
2.
Related Work
There are two types of activity recognition systems exist. One is online activity monitoring or real time approach and other is offline. Former is used where continuous monitoring is necessary for application such as interactive games and real time patient monitoring. Latter is used when there is no need to perform recognition on real time activity such as to monitor after some predefined time. Following are some examples of online or real time activity recognition approach. Ermes et. al [4] used 3D accelerometer placed on chest, left ankle and both wrists. The Bluetooth technology is used for communication between sensors and data collector device. In their work authors used decision tree to classify activities like lying, sitting & standing, walking, running and cycling. The data set collected from 3 subjects (2 male, 1 female) and all are good in health and normal weighted, performed activities for the duration of 5 minutes. The results show that overall average accuracy is 96%.
In [5] Maurer et al. proposed an online activity recognition system called watch, containing a 2D accelerometer, temperature, light sensors and microphone. Authors placed six each prototypes on the left wrist, belt, neck less, shirt pocket, bag and in the right side pocket of the trouser of the subjects and asked to perform activities like sitting, standing,
walking, running, ascending and descending stairs. Total six subjects participated to collect data and each subject is taken about 45 to 50 minutes to perform such activities. Authors first compared different classifiers such as Decision Tree, k-Nearest Neighbor, Bayes Network and Naïve-Bayes classifiers and after comparison authors used only Decision Tree classifier for its ability to provide good balancing ratio between accuracy and complexity. Results show that in sitting and standing postures, sensor placed on belt is showing approximately 100 % accuracy. In running, sensor placed on wrist produced approximately 99% accuracy and in descending stair activity it also gave the approximately 80 % accuracy which is higher as compare to other placements of sensors. The sensor placed on bag in ascending stairs is gave approximately 69 % accuracy, higher than others, while sensor placed on necklace is slightly better than other as it shows the 96% accuracy.
In [6], authors presented a comprehensive study where 21 subjects performed total 30 activities including gymnasium activities such as push-ups, lifting weight etc. In this study, authors placed five three dimensional accelerometers on subject’s wrist, working arm, hip, thigh and ankle and a heart rate monitor on chest. The classifiers used in this study are C4.5 (Decision Tree) and Naïve Bayes. In subject dependent study, the average accuracy of both classifications is 94.6%. Accuracy is 56%, when subject-independent analysis is considered.
In offline monitoring, users do not need to obtain immediate response. An example application of this system in which one can estimate the burned calories after a routine exercise. Following are the some examples of offline systems.
Parkka et al. [7] proposed a system where they consider seven such indoor and outdoor activities like walking lying, rowing, riding a bike, standing still, running, walking, and Nordic walking to identify the right method for activity recognition by using different sensors placed on different body parts and the classification. In this study, authors evaluated three classification methods, automatically generated decision tree, a custom decision tree based on visual inspection of signals and the domain knowledge and an artificial neural network. The custom decision tree produced accuracy of 82%, automatically generated tree produced 86% accuracy, and accuracy for artificial neural network was 82%.
Bao and Intelle [8] proposed a system to recognize 20 daily life activities such as walking, vacuuming, watching TV, and working on computer, lying down and relaxing, walking carrying items etc. Accelerometers were placed on the subject’s arm, hip, knee, ankle, and wrist. A C4.5 decision tree classifier was used for recognition. The accuracy for ambulation activities is up to 95%, but activities like scrubbing, stretching, riding elevator, riding escalator etc. are somewhat confused. The system however produced 84% overall accuracy.
transition from one activity to other as described in [9]. The sensor data at the sampling rate of 20 Hz, transmitted through Bluetooth to a computer. In this study, authors used an augmented features vector comprises [10] of AR (Auto-regressive) model, TA (Tilt Angle) and SMA (Signal Magnitude Area). For feature extraction and dimension reduction, LDA (Linear Discriminant Analysis) is used. Artificial Neural Network classified activities and transitions with a 97.76% accuracy rate.
There are some other work have been done for example [22] where authors classified activities into hierarchical manner. They used four SHIMMER sensors to collect the data. The sensors are placed on the subject’s chest, right hip, right hip and left ankle. They divided different activities into different classified systems, such as BASE, HOUSE, REST, WALK, and BICYCLE. Activities like vacuuming, sweeping belongs to HOUSE, sitting, laying standing belongs to REST, walking, running, ascending stairs, descending stairs belongs to WALKING, bicycling related to BICYCLE. There are some other activities authors did not put in any classification system such as washing dish and rope jumping. In addition to this the all the activities and their classification systems are the children of BASE classification system. Authors also developed a state of the art data set of all these activities. In this study authors applied AdaBoost (ADA), Classification and Regression Tree (CART), k-Nearest Neighbor (kNN) and Support Vector Machine (SVM) classification techniques to identify which classification algorithm best suits for which classification system. Authors claims that SVM is best for BASE, REST and BICYCLE classification system while k-NN is best for WALK and ADA is best for HOUSE systems according to the mean classification rate. Another similar work is also found in [23], where the main goal of the authors is to identify the best location for the placement of the sensors on a human body. In this study authors placed six accelerometers (based SHIMMER 2 platform) on subject’s chest, lower back, wrist, thigh, hip and ankle. Subjects have to perform seven activities such as laying, sitting, standing, walking, jogging on a motorized treadmill, and walking upstairs and down stairs. To identify the best classification algorithm, authors applied four classification algorithms which are support vector machine (SVM), decision tree (J48) (DT), Neural Network (NN) (multilayer perceptron) and naïve Bayes. According to authors, SVM produced best results among all the classifiers. The overall results of this study, is compared with our results in table3. Authors use one way ANOVA to identify the best location. The sensor placed on hip produced best results while sensors placed on foot and wrist produced poor results. This is mainly because of the mobility of hand and foot. In next session we discussed the classifiers and methodology we used in this study.
3.
Methodology
Classification is the task which predicts some class labels by using given unlabeled points. The classifiers we used are briefly defined in this section as we only attentive to recognize four different activities extract from a benchmark data set by using multi classification techniques. In this section first we defined classifiers we used in this study, and then we described our implementation methods of classifiers.
3.1 Decision Tree:
Decision tree (DT) is well known classification technique in data mining, which uses a hierarchical approach. In hierarchical classifiers, decisions of accepting or rejecting the class labels are done at intermediate nodes. The data is divided in the subsets recursively and evaluated according to their influence on the label or target variable resulting the construction a tree based on decisions. This constructed tree is called decision tree. The main strength of decision tree is it provides a clear indication of which fields are most important for prediction or classification while it is not suitable for the scenario where data size is small and have many classes [11]. See details on [12] for C4.5 implemented in this study. 3.2 Random Forest:
There are many tree based algorithms have been proposed to improve prediction accuracy of decision trees, and random forest is one of them which actually is a pool of different tree predictors where each tree (k) of the forest, depends on the independently sampled random vectors defined as Θk.When quantity size of trees becomes large, then the generalization error convergence to a limit and each tree casts a vote to the most popular class at input x. Please refer to [13] for further details where the definition of random forest is also described as {h(x, Θk), k = 1 . . .}.
3.3 Artificial Neural Network:
Artificial Neural Network (ANN) is based on the collection of inputs neurons [14]. In ANN, three types of layers are used comprising processing units called neurons. These layers are input layer, hidden layer and output layer. The number of input neurons is selected based on the independent variables in the pre-processed feature data. At the start, the ANN trained and tested through one hidden layer and then gradually increment in neurons of hidden layer. The overall classification rate is depends on the number of neurons in hidden layers. For further detail please see [15].
3.4 Support Vector Machine (SVM):
Support vector machine or SVM [16] is a supervised learning technique which recognizes the data pattern and also analyzes the data for classification. SVM has a mechanism which produced high accuracy with high generalization capability. SVM creates a hyper plane (also called optimal hyper plane) which separated the data points according to their class labels. Two new hyper planes (also called soft margin hyper planes) are created at both sides (in parallel) of the optimal hyper plane to maximize the distance between the hyper plane and nearest data point of any class in training data set. See also [16] for further details.
3.5 k-Nearest Neighbor:
k-Nearest Neighbor (k-NN) [17] is working on the principle
that instances with similar properties lie in close proximity within a dataset. If a classification label assigned to the instances, then an instance with no classification labeling can be identified by observation of the classes of instances exist in its most nearest neighborhood. The k-NN finds the k
region where each dimension tallies to one or more features from the features set which describes the classification of an instance. The distance between two points determines the similarity of the points. If distance between the points is minimum then it means the two points belong to similar classes (more features are similar), while maximizing the distance between any two points, then there is more chance to dissimilarity in features, and if there are more dissimilar features exist than the similar features then there is more probability of different classes of those points.
3.6 Naïve Bayes:
In statistical learning approach, Naïve Bayes (NB) [18] is considered as a dominant technique used for classification. NB is based on Bayesian networks and it uses very simple Bayesian networks which comprises of one or more directed acyclic graph (known as DAG) with only one parent of a child. The parent node is also identified as unobserved node while child nodes are identified as observed node where each child node is independent from other child node in the context of their parent node. Therefore, the NB is based on approximating R based on the probability of i and j classes according to [19]
|
|
r
r
P i
P X i
R
P j
P X
j
If R is greater than one it predicts class i otherwise it predicts class j.Please see [19] for further details.
3.7 Fuzzy Rule:
Fuzzy rule based systems [20] are used to address complex real world scenarios. These systems are known as very useful methods to handle problems such as non-linearity, uncertainty and vagueness. In this paper, we used mixed fuzzy rules technique [21]. For the definition of each of the fuzzy rules, a fuzzy region is declared with the help of class labels and feature spaces. Mixed fuzzy rules can deal with various types of features. Please see [21] for further details. 3.8 Data set specification and normalization
As discussed earlier that we used a [1] benchmark data set to evaluate the classifiers. The sampling rate is set to 50 Hz, which is adequate for capturing activities.
Table 1.List of activities, abbreviation and duration in datset
S.
No. Activity Abbreviation Duration/Times
1 Standing Still ST 1 min
2 Sitting and Relaxing SR 1 min
3 Laying down LD 1 min
4 Walking WK 1 min
5 Climbing Stairs CS 1 min
6 Waist Bends Forward WBF 20 Times
7 Frontal Elevation of Arms FEA 20 Times
8 Knee Bending KB 20 Times
9 Cycling CY 1 min
10 Jogging JG 1 min
11 Running RN 1 min
12 Jump Front and Back JFB 20 Times
The data set comprises of activities like standing still, sitting and relaxing, lying down, walking, climbing stairs, jogging, running, cycling, waist bends forward, frontal elevation of arms, knees bending, and jump front and back. Table 1 shows the list of activities, their abbreviation, duration etc. We can further categorized activity types into more groups,
for example ambulation, transportation, exercise and fitness etc. Therefore we grouped these activities according to their types in table 2.
Table 2. Group of activity types in mHealth Dataset
Group Activities
Ambulation Standing still, sitting and relaxing, lying down, walking, climbing stairs, jogging, running
Transportation cycling
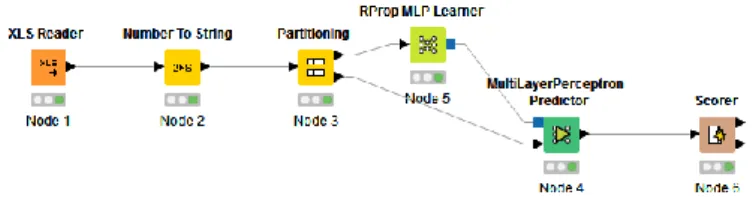
Exercise/fitness waist bends forward, frontal elevation of arms, knees bending, jump front and back We want at least one activity from each group, therefore, we took one ambulation activity such as standing still, two from exercise or fitness which are west bends forward and jump front and back and one from transportation i.e. cycling. The reason behind selection of these activities is the uniqueness of these advanced daily life activities. While most of the researches have been done on the classification of common daily life activities. We first randomly select 500 records of 10 subjects for each activity that we have selected, and then we make the model in Knime as shown in figure-2 for each classifier. Figure 2 shows an example of implementation of a MLP (Multi Layered Perceptron) Artificial Neural Network. As depicted in figure 2, we first portioned the data for learning (training) and prediction (testing) with the ratio of 70% to 30 % respectively. Scorer is used for getting results.
Figure 2. An example of Knime model
Now we described the methods we applied to all the classification techniques. We adjusted the MLP learning neural network setting by varying the multiple options to get a proper well balanced classification until we get the best results. In MLP learner the number of iterations we choose 100, while only one hidden layer comprises of 12 neurons is selected and giving the good results. We choose polynomial kernel for SVM instead of RBF or Hyper Tangent as it is well suited for our normalized training data. The value of choosing neighbors (k value) is selected as 5 in k-Nearest neighbor classifier. The value of depth level of a tree in random forest is selected to 10. The Gini index is selected as quality measure for decision tree and its minimum record per node is 2. The maximum number of the unique nominal value per feature is selected as 15 in Naïve Bayes classifier and in fuzzy rule we use minimum and maximum of fuzzy norms.
4.
Evaluation
one position to other. Table 3 shows the overall accuracy of all the classifiers we have used in this study. The main reason behind the accuracy for most of the classifiers is that we have selected the activities which have less similarities. By looking Table 3, it is clearly shown that the classifier such as fuzzy rules based, and random forests predicted more than the 99.7 % accurate classes. It is clearly shows our results are comparatively better than [23]. This may be due to the data set we used in this study. Only Naïve Bayes did not produced any significant accuracy. In [23] authors used only tri accelerometer data while we used tri accelerometer, gyro meter, and magnetometer and ECG data.
Table 3. Overall accuracy of classifiers used in this study and
[23]
Accuracy (%)
Classifiers RF DT MLP
ANN SVM k-NN NB
Fuzzy Rule
Proposed 99.7 98.58 98.96 89.1 95.95 53.18 99.79
[23] NA 94.18 95.74 96.67 NA 94.77 NA
Figure 3 shows the comparative analysis of classifiers we used in this study. We can easily see that he results produced through our methods are extremely good for Random Forest, Decision Tree, Fuzzy rule based classifiers and Artificial Neural Networks, k-Nearest Neighbors and Support Vector Machine as these classifiers produced above 89% accuracy, while Naïve Bayes produced only 53% classification.
0 10 20 30 40 50 60 70 80 90 100
RF DT MLP
ANN
SVM k-NN Naïve
Bayes Fuzzy
Rule Classifiers
Perce
n
tag
e
Accuracy
Figure 3. Comparative analysis of different classifiers accuracy
Tables from 4 to 10 show the confusion matrixes of all the classifiers. Table 4 shows the confusion matrix for decision tree classifier. One can easily understand that due to the method we applied and uniqueness of selected activities although decision tree produced very good results, but recognition of waist bends forward activity is not good as other activities.
Table 4. Confusion Matrix for Decision Tree
Activities ST WBF CY JFB
ST 1468 9 3 0
WBF 14 1461 4 14
CY 0 15 1475 8
JFB 1 8 9 1511
Table 5 shows the confusion matrix for random forest. As we know that if random forest making many trees then the generalization error converges to a specified limit.
This is the reason the convergent error rate in random forest is more accurate than others except fuzzy rule based classifier.
Table 5. Confusion Matrix for Random Forest
Activities ST WBF CY JFB
ST 1478 2 0 0
WBF 14 1478 1 0
CY 0 1 1497 0
JFB 0 0 0 1529
The confusion matrix of artificial neural network (ANN) is shown in Table 6. We varied the numbers of neurons per layer and changed the number of hidden layers to the point where we got these results. As discussed earlier, the transition from one posture to other is hard to recognize, therefore ANN is not good for recognizing the jump front and back.
Table 6.Confusion Matrix for Artificial Neural Network (MLP)
Activities ST WBF CY JFB
ST 1475 5 0 0
WBF 6 1479 3 5
CY 0 4 1483 11
JFB 0 24 4 1501
SVM is a type of supervised learning algorithm which is actually making hyper planes between points. When we select RBF or Hyper tangent kernels, SVM produced very awkward overall accuracy, but when polynomial kernel was applied it produced relatively good results because of our model was parametric. Table 7 clearly shows that waist bend forward and jump front and forward activities not classified accurately.
Table 7. Confusion Matrix for SVM
Activities ST WBF CY JFB
ST 1480 0 0 0
WBF 176 1189 34 94
CY 0 2 1494 2
JFB 137 198 11 1183
Table 8 shows the Confusion matrix of k-Nearest Neighbor algorithm. We vary and adjust the value of k up-to 5 where it produced relatively good results as compare to other values of k. As discussed earlier that except the standing still activity, all other activities are transitions due to their dynamicity, k-NN produced some errors to recognize these transitions.
Table 8. Confusion Matrix for K-NN
Activities ST WBF CY JFB
ST 1476 4 0 0
WBF 37 1447 7 2
CY 0 45 1453 0
JFB 0 62 86 1381
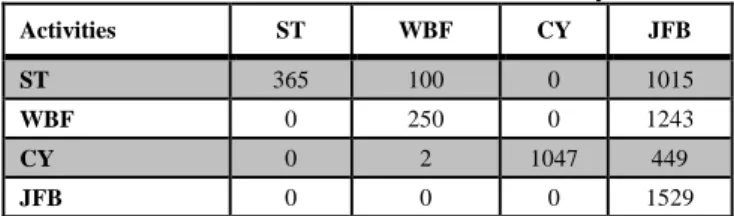
Table 9. Confusion Matrix for Naïve Bayes
Activities ST WBF CY JFB
ST 365 100 0 1015
WBF 0 250 0 1243
CY 0 2 1047 449
JFB 0 0 0 1529
Table 10 is the confusion matrix of fuzzy rule based classification. The method we applied for fuzzy rule produced the best results among all the other classifiers implemented in this study. The error rate is minimal as to compare to others.
Table 10. Confusion Matrix for Fuzzy Rule
Activities ST WBF CY JFB
ST 1479 1 0 0
WBF 4 1488 0 0
CY 0 5 1491 2
JFB 0 0 0 1526
Table 11 depicts the accuracy percentage of each classifier that how much a classifier predicts the correct pattern of an activity. One can easily understand that the Cycling is an activity which has the maximum prediction percentage from all the classifiers among all four activities. The reason behind this is may be its unique pattern which differentiates it to other activities.
Table 11. Classifier Accuracy in Percent of each activity
Activities
Classifiers
RF DT ANN SVM k-NN NB Fuzzy
Rule
ST 99.86 99.19 99.66 100 99.73 24.66 99.93
WBF 98.99 97.86 99.06 79.64 96.92 16.74 99.73
CY 99.93 98.46 98.99 99.73 96.99 69.89 99.53
JFB 100 98.82 98.17 77.37 90.32 100 100
Now if we consider our group of activities (table 1) equal to the categorization presented in [22], then we can easily compare the results among the classifiers. Table 12 shows the selected activities belongs to a specific group presented in [22] and in this work, and also the classifier with best results. It clearly shows that the methods we applied to the some classifiers produced best results according to the given scenarios. The other point is that, now we can suggest that Support Vector Machine (SVM) can be a better choice for data which relates to ambulation (sitting) / rest type activity according to the finding of both methods. The other thing we find through this study is that Fuzzy classifier can be more productive when data belongs to an exercise activity.
Table 12. Comparison Table in percent with [22]
Error! Reference
source not found.
Proposed
Activity Activity
Group Classifier Results
Activity
Group Classifier Results
ST REST SVM 97.4 Ambulation SVM 100
WBF NA NA NA Exercise Fuzzy 99.73
CY BICYCLE SVM 61.6 Transport RF 99.93
JFB WALK k-NN 97.7 Exercise RF, NB
Fuzzy 100
Also looking to figure 4 which is derived from Table 11, Random Forest and Fuzzy Rule based classifier produced relatively good results as compare to others. Decision Tree and Artificial Neural Network produced almost same level of prediction to waist bends forward activity. Naïve Bayes produced some awkward results of waist bends forward and jump front & back activities but produced 100% on cycling and standing still. SVM is the other classifier which classified the activities with below 90% except cycling.
0 10 20 30 40 50 60 70 80 90 100
RF DT ANN SVM k-NN NB Fuzzy Rule
Classifiers Accuracy Percentage
Standing Still Waist bends forward Cycling Jump front & back
Figure. 4. Accuracy percentage of classifiers.
5.
Conclusions
Today the field of human activity recognition is in the top priority for researchers to assist human being in different dimensions. In this paper we used a benchmark data set to implement multi classification techniques and used a graphical user interface based analytics platform Knime. The classifiers we used in this paper are Decision Tree, Random Forest, Naïve Bayes, Support Vector Machine, Artificial Neural Network, k-Nearest Neighbors and Fuzzy based classifiers. The methods we applied in this study produced some outstanding classification, specifically for Random Forest and fuzzy rule based classifier which produced over to 100% overall classification rate, while Decision Tree and Artificial Neural Network produced up to 99% accuracy rate. Some other finding in this paper is the pattern of an activity recognition. For example SVM is best for rest or sitting and relaxing, Random Forest is best for almost each activity, especially for cycling and jump forward and backward. Fuzzy rule based classifier is another classifier which produced better results. In future we will extend activity recognition to identify and predict the fall detection in elderly peoples and weaken patients through own collected dataset, as mentioned earlier that we are in process of developing our own data set.
References
[1] O. Banos, C. Villalonga, R. Garcia, A. Saez, M. Damas, J. A. Holgado, S. Lee, H. Pomares, I. Rojas, “Design, implementation and validation of a novel open framework for agile development of mobile health applications”. BioMedical Engineering OnLine, Vol. 14, No. S2:S6, pp. 1-20, 2015. [2] A. Burns, B. R. Greene, M. J. McGrath, T. J. O'Shea, B. Kuris,
S. M. Ayer, F. Stroiescu, and V. Cionca, SHIMMER™ “A wireless sensor platform for noninvasive biomedical research”. Sensors Journal, IEEE, 10(9), pp.1527-1534, 2010. [3] M. R. Berthold, N. Cebron, F. Dill, T. R. Gabriel, T. Kötter, T.
beyond”, AcM SIGKDD explorations Newsletter, 11(1), pp.26-31, 2009.
[4] M. Ermes, J. Parkka, and L. Cluitmans. "Advancing from offline to online activity recognition with wearable sensors." In 2008 30th Annual International Conference of the IEEE Engineering in Medicine and Biology Society, pp. 4451-4454. IEEE, 2008.
[5] U. Maurer, A. Smailagic, D. P. Siewiorek, and M. Deisher. "Activity recognition and monitoring using multiple sensors on different body positions." In International Workshop on Wearable and Implantable Body Sensor Networks (BSN'06), pp. 4-pp. IEEE, 2006.
[6] E. M. Tapia, S. S. Intille, W. Haskell, K. Larson, J. Wright, A. King, and R. Friedman. "Real-time recognition of physical activities and their intensities using wireless accelerometers and a heart rate monitor." In 2007 11th IEEE international symposium on wearable computers, pp. 37-40. IEEE, 2007. [7] J. Parkka, M. Ermes, P. Korpipaa, J. Mantyjarvi, J. Peltola,
and I. Korhonen. "Activity classification using realistic data from wearable sensors." IEEE Transactions on information technology in biomedicine 10, no. 1, pp. 119-128, 2006. [8] L. Bao, and S. S. Intille. "Activity recognition from
user-annotated acceleration data." In International Conference on Pervasive Computing, Springer Berlin Heidelberg, pp. 1-17. 2004.
[9] A. M. Khan, Y. K. Lee, S. Y. Lee, and T. S. Kim, “A triaxial accelerometer-based physical-activity recognition via augmented-signal features and a hierarchical recognizer”. Information Technology in Biomedicine, IEEE Transactions on, 14(5), pp.1166-1172, 2010.
[10]A. M. Khan, Y. K. Lee, and T. S. Kim, “Accelerometer signal-based human activity recognition using augmented autoregressive model coefficients and artificial neural nets”. In 2008 30th Annual International Conference of the IEEE Engineering in Medicine and Biology Society, pp. 5172-5175). IEEE, 2008.
[11]J. Ross. Quinlan, "Induction of decision trees." Machine learning 1, no. 1, pp.81-106, 1986.
[12]J. Shafer, R. Agrawal, and M. Mehta. "SPRINT: A scalable parallel classifier for data mining." In Proc. 1996 Int. Conf. Very Large Data Bases, pp. 544-555, 1996.
[13]V. Svetnik, A. Liaw, C. Tong, J. C. Culberson, R. P. Sheridan, and B. P. Feuston. "Random forest: a classification and regression tool for compound classification and QSAR modeling". Journal of chemical information and computer sciences 43, no. 6, pp.1947-1958, 2003.
[14]W. S. Sarle, Warren, “Neural networks and statistical models." 1994.
[15]V. Vapnik, “The nature of statistical learning theory”. Springer Science & Business Media, 2013.
[16]C. Cortes, V. Vapnik. "Support-vector networks." Machine learning 20, no. 3, pp. 273-297, 1995.
[17]T. Cover, P. Hart, “Nearest neighbor pattern classification”. IEEE Transactions on Information Theory, 13, No. 1, pp. 21– 7, 1967.
[18]I. J. Good, "Probability and the Weighing of Evidence (London, Charles Griffin; New York, Hafners)." GoodProbability and the Weighing of Evidence1950, 1950. [19]N. J. Nilsson, “Learning machines: foundations of trainable
pattern-classifying systems”. McGraw-Hill, 1965.
[20]T. R. Gabriel, and M. R. Berthold. "Influence of fuzzy norms and other heuristics on Mixed fuzzy rule formation", International Journal of Approximate Reasoning, 35, pp. 195-202, 2004.
[21]M. R. Berthold, "Mixed fuzzy rule formation." International journal of approximate reasoning, 32, no. 2, pp, 67-84.2003. [22]H. Leutheuser, D. Schuldhaus, and B. M. Eskofier,
"Hierarchical, multi-sensor based classification of daily life activities: comparison with state-of-the-art algorithms using a
benchmark dataset.", PloS one 8, no. 10 (2013): e75196. doi: 10.1371/journal.pone.0075196
[23]I. Cleland, B. Kikhia, C. Nugent, A. Boytsov, J. Hallberg, K. Synnes, S. McClean, and D. Finlay, Optimal placement of accelerometers for the detection of everyday activities. Sensors, 13(7), pp.9183-9200, 2013.
[24] F. Frattolillo, “A Deterministic Algorithm for the Deployment of Wireless Sensor Networks”. International Journal of Communication Networks and Information Security, 8(1), p.1, 2016.
[25] K. Ayub, and V. Zagurskis, 2016. “Adoption features and approach for UWB Wireless Sensor Network based on Pilot Signal assisted MAC”, International Journal of Communication Networks and Information Security, 8(1), pp.40, 2016.
[26] A Nadeem, MA Hussain, O Owais, A Salam, S Iqbal, K Ahsan, “Application specific study, analysis and classification of body area wireless sensor network applications”, published in Elsevier Computer Network Journal, Vol 83, pp 363-380, 2015.