Little research has been done on the influence of unions on employees and organisations (Muchinsky, 1990). Barling (1988); Barling, Fullagar and Kelloway (1992); Fullagar (1984) and Gordon and Nurick (1981) have agreed and mentioned that knowledge of organisational behaviour is incomplete without an understanding of union influence. Little attention is also given to union commitment (Fukami & Larson, 1984). The involvement of union members is crucial for unions to secure and maintain their power base (Gordon, Philpot, Burt, Thompson & Spiller, 1980). These facts provide a rationale and the motivation for the current study.
One needs to look at the history of South Africa to understand black and white worker union loyalty. Webster (1983) identifies three labour segments in South Africa, namely skilled labour where whites hold the majority of positions, semi-skilled labour mainly occupied by Coloured and Asian workers and finally the large unskilled black labour market. White skilled workers were part of the “protective” craft unions that gained status, security and privilege and were therefore committed to the union (Walker & Lawler, 1979).
Webster (1983) refers to these white unions as restrictionists. Black unskilled and semi-skilled workers were part of the “aggressive” unions that gained some democratic and social justice, improved security, conditions of work and standard of living (Walker & Lawler, 1979). Webster (1983) refers to the black unions as expansionists. White workers associate union loyalty with extrinsic factors. They also have access to other institutions for the satisfaction of intrinsic needs. Black workers join a union for improved benefits, and to defend African workers’ rights (Webster, 1979).
Given the above and the changes that legislation (the Employment Equity Act and the Broad-based Black Economic Empowerment Act) implies, the question arises what impact it has on individuals.
Different individuals may respond differently to a particular force of change. For some it may be satisfactory, but for others it will bring pain, stress and disadvantages (Human, 2000; Yousef, 2000). Research shows that higher committed individuals will accept change more easily (Guest, 1995; Iverson, 1996; Lau & Woodman, 1995).
With the EE Act aiming at providing a more productive workforce, that is better trained and motivated employees and helping to make a company more efficient and competitive (Republic of South Africa, 1998), the question that can be asked is whether all individuals are experien-cing the outcome of the implemented Act as positive and equally challenging. This study will empirically test which biographical variables are significantly related to the perceptions of EE (see Figure 1).
With the aim of the Broad-based Black Economic Empowerment (BBEE) Act to transfer the ownership of assets into black hands (Innes, 2002), the same question as with the Employment Equity Act can be asked. Experience in practice has shown that individuals are not equally enthusiastic about the change and that this might also affect their commitment levels. This study will empirically test which biographical variables are significantly related to the perceptions of BEE (see Figure 1). The next section will provide some research evidence on the relationship bet ween biographical variables, EE and BEE.
Biographical variables, EE and BEE
Some of the research that has been published will highlight the relationship between biographical variables and EE and, to a lesser extent, BEE because this legislation has just recently been promulgated.
Race
Easton-Leadly (1994) has reported that the perceptions of racism are more negative and black respondents claim even more experiences of discrimination. Jordaan (2002) is of the opinion
KAREN JANSE VAN RENSBURG
GERT ROODT
gr@ujhb.ac.zaDepartment of Human Resource Management University of Johannesburg
ABSTRACT
The purpose of the study was to test whether the perceptions of employment equity (EE) and black economic empowerment (BEE) are related to union commitment and whether the perceptions about the mentor’s role significantly mediate this said relationship. The sampling frame for the study constituted 1200 employees of a division of a large public transport organisation and a convenience sample including all 1200 employees yielded 637 fully completed records (a 53% response rate). The results of the study indicate that the perceptions of EE and BEE are significantly related to union commitment, but that perceptions of the mentor’s role do not mediate this relationship. More detailed findings on the study are reported.
OPSOMMING
Die doel van die studie was om vas te stel of die persepsies van werkgelykheid (EE) en Swart ekonomiese bemagtiging (BEE) verband hou met vakunieverbondenheid en of die persepsies omtrent die mentorrol hierdie verhouding beduidend medieer. Die steekproefraamwerk van die studie het bestaan uit 1200 werknemers uit ’n divisie van ’n groot vervoeronderneming en ’n gerieflikheidsteekproef wat al 1200 werknemers ingesluit het, het 637 volledige rekords opgelewer (’n 53% responskoers). Die resultate van die studie dui daarop dat die persepsies van EE en BEE beduidend verwant is aan vakunieverbondenheid, maar dat persepsies van die mentorrol nie hierdie verhouding medieer nie. Meer gedetaileerde bevindinge van die studie word gerapporteer.
THE PERCEPTIONS OF EMPLOYMENT EQUITY
AND BLACK ECONOMIC EMPOWERMENT AS
PREDICTORS OF UNION COMMITMENT
Requests for copies should be addressed to: G Roodt, Department of Human Resource Management, RAU University, PO Box 524, Auckland Park, 2006
that whites are to experience reverse discrimination, because black workers are given preference. Mahanyele (1993) reflects the frustration that organisations only talk about EE, but deny blacks the opportunity.
Gender
Müller and Roodt (1998) found women to be more negative than men about affirmative action (EE), because they have fewer opportunities. Contrary to this, Van Zyl and Roodt (2003) found women to be more positive than men about EE. This inconsistency is probably attributable to the differences in the country’s development stages.
Age
Walbrugh and Roodt (2003) reported that younger groups (<35 years) feel progressively more positive about EE than older groups (35-50). The older group (>50) again felt more positive about EE.
Tenure
Tenure is strongly related to age. The reason for the group in their mid-career to be more negative about EE may be related to their career demands and the typical mid-career crisis as pointed out by Walbrugh and Roodt (2003).
Marital status
No research could be found to shed more light on this relationship.
Education levels
No research was found to shed more light on this relationship.
Home language
Müller and Roodt (1998) found that English- and Afrikaans-speaking respondents were more negative about affirmative action (EE) than the group speaking African languages.
Job level
Several authors have commented on the excessive job mobility of black managers (Matuna, 1996; Primos, 1994; Sibanda, 1995). Innes (2001) and Roberts (1997) found that black managers were poached at high salaries that are higher than those paid by the market. Vallabh and Donald (2001) reported on the following perceptions of black managers:
They place a high value on being trusted and recognised for their work, though their values are not recognised.
They are placed in positions that do not meet their academic background.
They do not have the opportunity to use their knowledge and skills.
They are second-guessed by their colleagues and supervisors.
The above research results indicate that people have different experiences and expectations regarding EE and BEE, which will have a definite impact on their union commitment. For the purpose of this study union commitment is defined as: ‘a cognitive predisposition towards a particular focus (the union), insofar this focus has the potential to satisfy needs, realise values and achieve goals’ (Roodt, 2004, p. 85).
With reference to the theoretical model (Figure 1) the next section deals with the relationship between biographical variables and union commitment.
Biographical variables and union commitment Race
Fullagar (1986) found that there are no differences for black and white workers in South Africa with regard to their level of union commitment.
Gender
Gordon et al. (1980) found women to be more committed to an union than men.
Age
Fukami and Larson (1984) found no relationship between union commitment and age.
Tenure
Fukami and Larson (1984) found no relationship between union commitment and tenure. However, Barling, Wade and Fullagar (1990) found that only union tenure was a significant predictor of union commitment an aspect not investigated in this study.
Marital status
No evidence could be found in the relevant literature on the relationship between different marital status categories and their levels of union commitment.
Educational level
Fukami and Larson (1984) found no relationship between union commitment and educational level.
Home language
No evidence could be found in the relevant literature on the relationship between different home language groups and their levels of union commitment.
Job level
No evidence could be found in the relevant literature on the relationship between job level categories and their levels of union commitment.
In the theoretical model (Figure 1) it is suggested that the relationship between EE, BEE and union commitment is mediated by perceptions of the mentor’s role.
Commitment and mentorship
One of the key success factors in managing change and diversit y is mentorship (Clutterbuck & Abbott, 2003; Jordaan, 2002; Singh, Bains & Vinnicombe, 2002; Wingrove, 2002). Mentors inf luence the level of the commitment of protégés (Clutterbuck, 1997; Mowday, Steers & Porter, 1979).
One context in which mentorship can work is within BEE. If one departs from the vantage point that mentoring is an equal relationship between the mentor and protégé, then entrepreneurial and managerial skills can be transferred while allowing the new manager or entrepreneur to develop the right competencies (Clutterbuck & Abbott, 2003).
According to Storm and Roodt (2002) and Wingrove (2002), white, middle-aged mentors may be cynical and negative about EE and this negativity may be projected to the protégé, which can again lead to lower commitment levels. Little empirical evidence could be found to support this rationale, except for the exploratory research by Storm and Roodt (2002) that focused on organisation-related commitment.
Objectives of the study
Against this background, the primary objective of this research will be to determine whether the perceptions of EE and BEE are related to union commitment.
The secondary objectives of the study will be:
1. to determine whether this relationship is mediated by the perceptions of the mentor’s role; and
2. to determine which biographical variables are significant predictors of the perceptions of EE and BEE.
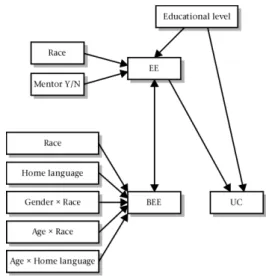
Figure 1: Predictive model of Union Commitment
[Adapted from Guest (1995); Innes (2002); Iverson (1996); Lau and Woodman (1995); Mowday et al. (1982); Müller and Roodt (1998); Republic of South Africa (55 of 1998) and Storm and Roodt (2002).]
RESEARCH DESIGN
Research approach
The research approach followed in the study is from the quantitative paradigm and the application of measuring instruments in a cross-sectional, non-random field survey generated the primary data for the study. An ex post facto approach to data analysis was used in exploring the inter-relationships between variables in the data set.
Research methodology
The research methodology followed, is described according to the following three headings:
Sample of participants
The largest division of this transport organisation was targeted for the research. A convenience sample including all employees in a sampling frame of 1200 employees yielded 637 completed questionnaires. A response rate of 53% was obtained. Only fully completed records were used for the data analyses.
As indicated in Table 1, the majority of the respondents were Whites (62%) followed by Africans (24%) and Coloureds/Indians/Asians (13,5%). Most of the respondents were male (80,5%) and a smaller group (19,5%) female. The majority of the respondents belong to an union (70,5%).
TABLE1
BACKGROUND INFORMATION OF THE RESPONDENTS
Background Information Respondents Percentage (%)
Race
Africans 154 24,2
Coloureds/Indians/Asians 86 13,5
Whites 397 62,3
TOTAL 637 100%
Gender
Males 513 80,5
Females 124 19,5
TOTAL 637 100%
Age
30 years and younger 104 16,3
31-35 92 14,4
36-40 82 12,9
41-45 141 22,1
46-50 115 18,1
Older than 50 103 16,2
TOTAL 637 100%
Tenure
10 years or less 15824,7
11-20 years 130 20,4
21-25 years 124 19,5
26-30 years 100 15,7
More than 30 years 125 19,7
TOTAL 637 100%
Marital Status
Single, divorced or widowed 171 26,8 Married or living together 466 73,2
TOTAL 637 100%
Educational Level
Standard 9 or lower 131 20,6
Standard 10 179 28,1
Post-matric diploma/certificate 21834,2
Degree or higher 109 17,1
TOTAL 637 100%
Home Language
Afrikaans 320 50,2
English 162 25,4
African 155 24,4
TOTAL 637 100%
Job level
Junior employees 173 73
Management 464 27
TOTAL 637 100%
Union Membership
Do not belong to a union 188 29,5
Belong to a union 449 70,5
TOTAL 637 100%
Type of Mentor
Hierarchical mentor in a higher grade 119 18,7 Hierarchical mentor in a lower grade 11 1,7
Supervisor as mentor 88 13,8
Peer mentor (same grade) 30 4,7
Executive mentor 13 2,1
No mentor 376 59
TOTAL 637 100%
Mentor Type
Same race 9815%
Different race 63 10%
Same sex 61 10%
Opposite sex 39 6%
No mentor 376 59%
TOTAL 637 100%
Mentor Phase
Initial 61 10%
Learning 72 11%
Independency 64 10%
Redefinition 64 10%
No mentor 376 59%
TOTAL 637 100%
Mentor Age
<25 6 1%
25-30 17 3%
31-35 41 6%
36-40 31 5%
41-45 61 10%
46-50 45 7%
51-55 45 7%
56-63 15 2%
No mentor 376 59%
Measuring instrument
A comprehensive measuring instrument, the Employee Commitment Questionnaire, was designed for the purpose of the study. The Employee Commitment Questionnaire consisted of 127 items measured on a five-point intensity scale (excluding the biographical questions). Examples of the items can be seen in Figure 2.
The union commitment questionnaire examples
Question D2: To what extent are you willing to stay on with your union, regardless the type of work you are doing?
To no extent 1 2 3 4 5 To a very large extent
Question D10: To what extent are you personally involved in your union?
To no extent 1 2 3 4 5 To a very large extent
The perceptions of employment equity questionnaire examples
Question E5: To what extent do all employees at the organisation have the same opportunities for promotion?
To no extent 1 2 3 4 5 To a very large extent
Question E3: To what extent does your supervisor know what your training needs are?
To no extent 1 2 3 4 5 To a very large extent
The perceptions of black economic empowerment questionnaire examples
Question F5: In your opinion how much does the organisation benefit from applying black economic empowerment stratgeies?
No benefit 1 2 3 4 5 Benefit largely
Question F15: How much do you think black women will benefit from applying black economic empowerment?
Little benefit 1 2 3 4 5 Large benefit
The perceptions of the mentor’s role questionnaire examples
Question G18: To what extent should a mentor encourage one to communicate openly about anxiety and fears that distract one from work?
To no extent 1 2 3 4 5 To a very large extent
Question G23: To what extent should a mentor serve as a role model for protégés?
To no extent 1 2 3 4 5 To a very large extent
Figure 2: Item examples of the Employee Commitment Questionnaire
The questionnaire consisted of seven sections: Section A and B – the background information of the respondent; Section C – 18 item Organisation-related Commitment Questionnaire (Roodt, 1997) (not discussed for the purposes of this article); Section D – the 16 item Union Commitment questionnaire (Roodt, 1997); Section E – the 25 item Perceptions of Employment Equity Scale [a radically adapted version from Martins (1999) Employment Equit y Questionnaire]; Section F – an 18 item Perceptions of Black Economic Empowerment scale; and Section G – The Perceptions on the Mentorship Role Scale – a 26 item questionnaire. The perceptions on EE, BEE and the role of the mentor scales were designed by the authors.
The questionnaires will be discussed in more detail next focussing on the rationale for inclusion in the study, the composition of the questionnaire as well as the reliability and validity of the instruments.
Union Commitment Questionnaire (Roodt, 1997)
The Union Commitment Questionnaire of Roodt (1997) was used and adapted. The instrument was used to measure the degree of commitment to the union. This particular union commitment scale was applied successfully in a South African setting before. A common theoretical base will enable the comparison of organisation and union commitment scores. There were 16 items, which were put into a question format. Roodt’s questionnaire has an acceptable Cronbach Alpha coefficient of 0,909 (Roodt, 1997). Factorial validity (a sub-dimension of construct validity) can be inferred from the single factor structure. Content and face validity can be inferred from the item wording.
The Perceptions of Employment Equity Questionnaire (adapted from Martins, 1999)
A radically, adapted version of the Employment Equity Questionnaire based on Martins’ (1999) theorisation was used for this st udy. Statements were converted into questions and most of the limitations in item-construction as identified by Smith and Roodt (2003); Van Zyl and Roodt (2003) and Walbrugh and Roodt (2003) were addressed. The 41 statements that were used in the initial instrument were adapted into 25 items in question format. Martins’ (1999) questionnaire has a Cronbach Alpha of 0,959 and it can be concluded that this questionnaire measures employment equit y practices consistently and reliably. Construct validity is defined as the extent to which the instrument measures the theoretical contract that is designed to measure (Allen & Yen, 1979; Schepers, 1992). According to Smith and Roodt (2003), the Employment Equit y Questionnaire meets this requirement. According to Smith and Roodt (2003), the Employment Equity Questionnaire has face validity, because it seems that the instrument covers the practices as indicated in the Employment Equity Act. Walbrugh and Roodt (2003) also support the face validity of the instrument. There is also evidence of limited discriminant validit y (Smith & Roodt, 2003), but the discriminant validity is questioned by Van Zyl and Roodt (2003) and Walbrugh and Roodt (2003).
The Perceptions of Black Economic Empowerment Questionnaire
The questionnaire developed by the authors consists of 18 items and was based on existing literature on black economic empowerment. No information regarding the reliability and validity (except face and content validity) of the questionnaire is available yet, but findings of this study will be reported under the results section.
The Perceptions of the Mentor’s Role Questionnaire (adapted from Dreher & Ash, 1990)
questionnaire based on the same theory. Twenty-nine items in question format were included in this questionnaire. No information on the reliability is available on this instrument, but findings of this study will be reported under the results section. This instrument seems to have content and face validity based on the item content.
Research procedure
The measuring instrument was distributed via the organisation’s intranet to all individuals in the division, excluding those on the lowest levels who were not able to read or write. A hard copy was also sent to employees via Human Resources Practitioners. All the ethical codes, e.g. control procedures, were adhered to. A letter of reminder was sent at a later stage to urge individuals to participate in the study. Individuals could respond anonymously and all the returned responses were treated with the utmost confidentiality. The identity of all the individuals was thus protected to ensure reliable responses.
RESULTS
The analysis of the data was conducted in two stages. The objective of the first stage was to establish whether all the variables were robust and reliable. In order to achieve this objective, all the measuring instruments were factor analysed separately on two levels. This procedure suggested by Schepers (1992) was followed to avoid the creation of artificial factors, resulting from differential item skewness.
In the first level factor analyses, all the items of each instrument were intercorrelated and anti-image correlations were executed to test the suitability of the matrices for factor analyses by referring to the Kaiser-Meyer-Olkin Measure of Sampling Adequacy and the Bartlett’s Test of Sphericity. Eigenvalues were calculated on the unreduced item inter-correlation matrices and a number of factors were postulated according to the Kaiser’s (1970) criterion of eigenvalues larger than unity.
In the second level factor analyses, sub-scores for each postulated factor were calculated and the same procedure as explained above was conducted on the sub-score intercorrelation matrices. Items of the obtained second level factors (scales) were subjected to an iterative item analysis to establish the internal consistency of each scale. Based on this procedure, the following reliabilities were obtained for each scale:
The Union Commitment (UC) Scale of Roodt (1997) yielded a Cronbach Alpha of 0,96. The Perceptions of Employment Equity Questionnaire yielded a Cronbach Alpha of 0,92 and the Perceptions of Black Economic Empowerment yielded a Cronbach Alpha of 0,91. The Perceptions of the Mentor’s Role Scale yielded a high Cronbach Alpha of 0,97. All the scales thus have acceptable reliabilities and can therefore be included for further analyses.
The second stage of the analyses was focused on the coefficients of association (Cramer’s V) between background variables and the intercorrelations of the different scales’ total scores (respectively displayed in Table 2 and 3). From Table 2 it can be seen that race and home language are significantly associated as well as job level and level of education. Tenure and race and tenure and age are also significantly associated. It is highly unlikely that significantly related variables will display any interactive effects. The intercorrelation matrix of scale scores (Table 3) indicates that UC is significantly correlated with the perceptions of EE
(0,364), BEE (0,409) and the mentor’s role (0,210). EE and BEE are positively correlated (0,509). All the correlations are significant on the 0,01 level.
TABLE2
COEFFICIENTS OF ASSOCIATION(CRAMERV) BETWEEN BIOGRAPHICAL VARIABLES
Race Gender Age Tenure Marital Level Home Job Mentor Status of Edu- lang- level Y/N
cation uage
Race
-Gender 0,160
-Age 0,447 0,273
-Tenure 0,509 0,324 0,590
-Marital 0,324 0,194 0,466 0,455 -Status
Level of 0,130 0,1580,185 0,167 0,125 -education
Home 0,681 0,051 0,304 0,351 0,285 0,132 -language
Job level 0,0980,160 0,159 0,072 0,131 0,653 0,111
-Mentor Y/N 0,193 0,090 0,214 0,185 0,057 0,053 0,116 0,049
-Key for interpreting effect sizes: < 0,1 – no effect
0,1 to 0,3 – small effect 0,3 to 0,5 – moderate effect > 0,5 – large effect
TABLE3
INTERCORRELATIONS OF SCALE TOTAL SCORES ON THE EMPLOYEE COMMITMENT QUESTIONNAIRE
Union Employ- Black Mentor
Commit- ment Economic Role
ment Equity
Empower-Ment
UnionCommitment Pearson 1 Correlation
Employment Equity Pearson 0,364 1 Correlation
Black Economic Pearson 0,409 0,509 1 Empowerment Correlation
Mentor Role Pearson 0,210 0,237 0,220 1 Correlation
All Correlations are significant at the 0,01 level (2-tailed).
For the next stage in the analyses, a multi-factor analysis of variance (ANOVA) was applied to predict a particular criterion variable. A model modification process was followed whereby the most parsimonious model was extracted. Residuals were systematically investigated to establish any possible interaction effects with the predictor variables.
Figure 3: Biographical variable: Gender as predictor of the perception of employment equity
Figure 4: Biographical variable: Race as predictor of the perception of employment equity
As can be seen from Figure 3, females are more positive in terms of their perceptions of employment equity than males.
As can be seen from Figure 4, Coloured/Indian/Asian employees are the most positive in terms of their perceptions of employment equity, than African employees, and White employees are the least positive in terms of their perceptions of employment equity.
Figure 5: Biographical variable: Having a mentor or not as predictor of the perception of employment equity
As can be seen from Figure 5, employees who have a mentor are more positive in terms of their perceptions of employment equity than those without a mentor.
The following biographical variables were included in the final summary model of the multi-factor analysis of variances (ANOVA) for predicting the perceptions of BEE, namely race, home language, gender x race, age x race and age x home language. These variables explain 40% of BEE’s variance. See Figures 6-10 for the significant predictors.
Figure 6: Biographical variable: Race as predictor of the perceptions of black economic empowerment
As can be seen from Figure 6, Coloured/Indian/Asian employees are more positive in terms of their perceptions of black economic empowerment than African employees, and White employees are the least positive in terms of their perceptions of black economic empowerment.
Figure 7: Biographical variable: Home language as predictor of the perceptions of black economic empowerment
Figure 8: Biographical variables: Gender x Race as predictors of the perceptions of black economic empowerment
As can be seen from Figure 8, White female employees are more positive in terms of their perceptions of black economic empowerment than white males. Coloured/ Indian/Asian and African male and female employees are equally positive in terms of their perceptions of black economic empowerment, but more than White male/ female employees.
As can be seen from Figure 9, African employees in the age group 31-35 years of age are the most positive in terms of their perceptions of black economic empowerment and 36-40 years of age are the least positive in terms of their perceptions of black economic empowerment. Coloured/Indian/Asian employees are the most positive in terms of their perceptions of black economic empowerment in the age group 30 years of age and younger and the Coloured/Indian/Asian employees in the age group 31-35 years of age are the least positive in terms of their perceptions of black economic empowerment. White employees 31-35 years of age are the most positive in terms of their perceptions of black economic empowerment and White employees in the age group 30 years of age and younger are the least positive in terms of their perceptions of black economic empowerment. African and Coloured/ Indian/Asian employees are also more positive in terms of their perceptions of black economic empowerment than the White employees.
Figure 9: Biographical variables: Age x Race as predictors of the perceptions of black economic empowerment
Figure 10: Biographical variables: Age x Home language as predictors of the perceptions of black economic
empowerment
As can be seen from Figure 10, Afrikaans-speaking employees in the age group 31-35 years of age are the most positive in terms of their perceptions of black economic empowerment and Afrikaans-speaking employees 36-40 years of age are the least positive in terms of their perceptions of black economic empowerment. English-speaking employees in the age group 41-45 years of age are the most positive in terms of their perceptions of black economic empowerment and English-speaking employees 31-35 years of age are the least positive in terms of their perceptions of black economic empowerment. Employees speaking African languages between 30 years of age and younger are the most positive in terms of their perceptions of black economic empowerment and employees 31-35 years of age speaking African languages are the least positive in terms of their perceptions of black economic empowerment.
employment equit y (EE) and the perceptions of black economic empowerment (BEE) as well as the perceptions of the mentor’s role (MR) as predictors of union commitment (UC), the following emerged from the model modification process: 30% of the variance was primarily explained by the perceptions of employment equity (EE), while secondary predictors were educational level, race, having a mentor or not and perceptions of employment equity (EE) in an interactive relationship with the perceptions of black economic empowerment (BEE). Educational level also has a direct relationship with union commitment.
The results of the final summary model are depicted in Table 4.
The statistical parameters of the final summary model are depicted in Table 5.
TABLE4
RESULTS OF THE FINAL SUMMARY MODEL FOR THE PREDICTION OF UNION COMMITMENT
Model R R Square Adjusted R Std. Error of Square The Estimate
1 0,444a 0,1980,1980,89227
2 0,513b 0,263 0,260 0,85609
3 0,531c 0,282 0,277 0,84581
4 0,542d 0,293 0,287 0,84007
5 0,549e 0,301 0,293 0,83652
6 0,555f 0,308 0,298 0,83334
f. Predictors: (Constant), EF (EExBEE)
g. Predictors: (Constant), EF (EExBEE), Post-matric
h. Predictors: (Constant), EF (EExBEE), Post-matric, Mentor Y/N i. Predictors: (Constant), EF (EExBEE), Post-matric, Mentor Y/N, STD9 j. Predictors: (Constant), EF (EExBEE), Post-matric, Mentor Y/N, STD9, Whites k. Predictors: (Constant), EF (EExBEE), Post-matric, Mentor Y/N, STD9, Whites, Degree l.Dependent Variable: (Factor 1) D: Union
TABLE5
STATISTICAL PARAMETERS FOR THE PREDICTION OF UNION COMMITMENT
Coefficientsa
Unstandardised Coefficients Standardised Coefficients
Model B Std. Error Beta t Sig.
(Constant) 2,002 0,115 17,380,000
EF (EExBEE) 0,08429 0,012 0,345 5 0,000
Post-matric 0,121 0,033 -0,175 7,0480,000
Mentor Y/N - 0,015 -0,173 -3,620 0,000
STD9 -0,05459 0,103 0,119 -3,617 0,009
Whites 0,2680,029 -0,099 2,606 0,015
Degree - 0,148-0,089 -2,449 0,036
0,07058-2,098
-0,311
Dependent variable: (Factor 1) D: Union
As can be inferred from Table 5, the statistical parameters for the prediction of union commitment (UC) are as follows:
UC = 2,002 + 0,269 [std. 9] – 0,311 [degree] + 0,08429 [EF (EExBEE)] – 0,121 [post matric] – 0,05459 [mentor Y/N] – 0,07058 [whites]).
The results of the above model can be graphically illustrated in Figure 11.
Figure 11: A graphical representation of the predictors of Union Commitment
It should be noted that educational level acts as definite differentiator for union commitment levels. Within the three cohorts there are also differences with regard to racial groups and those who have a mentor or not.
DISCUSSION
The first and second level factor analyses of the different measuring instruments, followed by iterative item analyses, yielded scales with acceptable coefficient Alphas (ranging from 0,91 to 0,97), indicating that the variables were suitable for inclusion in the second phase of the data analysis.
The second phase of the data analyses yielded the following associations or effect sizes between background variables (displayed in Table 2):
Race and home language – The Africans speak African languages, the Coloureds/Indians/Asians speak English and the majority Whites speak Afrikaans, which were expected from the culture of this organisation.
Job level and education – The majority of managers have a higher level of education, which is expected.
Tenure and race – The African employees have less years of service compared to the White employees with longer years of service.
Tenure and age – The younger employees have less years of service, which is self-explanatory.
As a result of these strong associations, one would expect that there would be no interaction effects between these mentioned variables.
From the intercorrelations of the scales’ total scores, the mentioned variables were all significantly correlated, ranging from 0,210 to 0,509 (displayed in Table 3). BEE and EE were positively correlated.
Figure 12: Biographical variables as predictors of the perceptions of employment equity
If BEE was predicted with all biographical variables by using a multi-factor analysis of variance (ANOVA), the following background variables emerged as predictors in the final summary model, namely race, home language, gender x race, age x race and age x home language where 40% of the variance is explained.
Figure 13: Biographical variables as predictors of the perceptions of black economic empowerment
The findings of the above two multi-factor ANOVA’s indicated the biographical variables which are predictors of EE and BEE. Hereby, the second secondary objective of the study is achieved.
If union commitment (UC) was predicted by using a univariate GLM (ANCOVA), the following variables emerged as predictors in the summary model, namely educational level (direct relationship with union commitment) and also educational level, race, having a mentor or not and perceptions of employment equity (EE) in an interactive relationship with perceptions of black economic empowerment (BEE) that explain 30% of the variance. No other research could shed light on this finding. It is also clear that the perceptions of the mentor’s role do not mediate the relationship between EE, BEE and UC. This result does not correspond with the findings of Storm and Roodt (2002) To illustrate the above, see Figure 14.
Figure 14: Results of a predictive model for union commitment
The findings on the prediction of union commitment suggest that the perceptions of EE and BEE are significant predictors of
the criterion variable and that perceptions of the mentor’s role do not mediate this relationship. These findings support the primary objective of the study as well as the first secondary objective.
This situation creates a unique challenge for the top management of unions to create a context that will address this dichotomy between lower and higher education levels, those who have a mentor or not in the organisation as well as the polarising perceptions of EE and BEE.
If the different models as displayed in Figures 12-14 are combined, the following empirical model as displayed in Figure 15 emerges from the data:
Figure 15: An Integrated predictive model of union commitment
The study has little nomothetic value, as it was limited to a single organisation. Further research needs to be conducted across different organisations in similar contexts to establish the external validity of the findings. The findings have some theoretical value as the perceptions of employment equity and the perceptions of black economic empowerment were for the first time included as predictors of union commitment. Furthermore, a more sophisticated, multi-variate General Linear Model (GLM) was used for the prediction of union commitment. Besides providing a parsimonious prediction model by isolating only predictors that were significantly explaining variance in the criterion, this model also illustrates possible significant interaction effects between the different predictor variables. In doing so the model serves as a good point of departure for understanding and explaining union commitment in a diverse workforce setting, where the perceptions of employment equity (EE) and the perceptions of black economic empowerment (BEE) are applied.
REFERENCES
Allen, M.J. & Yen, W.M. (1979). Introduction to measurement theory. Monterey, CA: Brooks/Cole Publishing Company. Barling, J. (1988). Industrial relations: A “blind spot” in the
teaching, research and practice of Industrial/Organizational Psychology. Canadian Psychology, 29, 103-108.
Barling, J., Fullagar, C. & Kelloway, E.K. (1992). The union and its members: A psychological approach. New York: Oxford University Press.
Barling, J., Wade, B. & Fullagar, C. (1990). Predicting employee commitment to company and union: Divergent models.
Journal of Occupational Psychology, 63, 49-61.
Clutterbuck, D. (1997). Everyone needs a mentor: Fostering talent at work (2nd edition). London: Institute of Personnel and
Clutterbuck, D. & Abbott, P. (2003). Mentoring as an empowerment tool. People Dynamics, 21(4), April, 24-25. Dreher, G.F. & Ash, R.A. (1990). A comparative study of mentoring
among men and women in managerial, professional and technical positions. Journal of Applied Psychology, 75(5), 539-546. Easton-Leadly, S. (1994). Managing polarisation: A dose of
reality. People Dynamics, 12(10), 44-48.
Fukami, C.V. & Larson, E.W. (1984). Commitment to company and union: Parallel models. Journal of Applied Psychology, 69
(3), 367-371.
Fullagar, C. (1984). Psychology and labor: A relationship of neglect. South African Journal of Psychology, 14, 95-100. Fullagar, C. (1986). A factor analytic study on the validity of a
union commitment scale. Journal of Applied Psychology, 71
(1), 129-136.
Gordon, M.E. & Nurick, A.J. (1981). Psychological approaches to the study of unions and union-management relations.
Psychological Bulletin, 90, 293-306.
Gordon, M.E., Philpot, J.W., Burt, R.E., Thompson, C.A. & Spiller, W.E. (1980). Commitment to the union: Development of a measure and an examination of its correlates. Journal of Applied Psychology Monograph, 65(4), 479-499.
Guest, D. (1995). Employee commitment and control. In J.F. Hartley & G.M. Stephenson (Eds), Employment Relations(pp. 111-135). Oxford: Blackwell Publishers.
Human, L. (2000). Equity and efficacy: The business case for employment equity. Talk delivered at the IPM Eastern Cape regional conference, Port Elizabeth.
Innes, D. (2001). Tracking progress on employment equity. Innes Labour Brief, 13(2), October, 10-21.
Innes, D. (2002). Black economic empowerment. Innes Labour Brief, 13(7), July, 10-12.
Iverson, R.D. (1996). Employee acceptance of organizational change: The role of organizational commitment. The International Journal of Human Resource Management, 7(1), 122-149. Jordaan, J. (2002). Employment equity can mean money in the
bank. HR Future, April 28, 28-31.
Kaiser, H.F. (1970). A second-generation Little Jiff y.
Psychometrika, 35, 401-415.
Kram, K.E. (1988). Mentoring at work: Developmental relationships in organizational life. Lanham: University Press of America. Lau, C. & Woodman, R.C. (1995). Understanding organizational
change: A schematic perspective. Academy of Management Journal, 38(2), 537-554.
Mahanyele, M. (1993). Black Economic Empowerment underpinning post apartheid era. Human Resource Management, October, 8-13.
Martins, N. (1999). Questionnaire on employment equity in association with Ernest and Young. Unpublished document. Johannesburg: Organisational Diagnostics.
Matuna, J.M. (1996). Excessive job mobility among black managers. Unpublished masters thesis. Johannesburg: University of the Witwatersrand.
Mowday, R.T., Steers, R.M. & Porter, L.W. (1979). The measurement of organizational commitment. Journal of Vocational Behavior, 14, 224-247.
Muchinsky, P.M. (1990). Psychology applied to work – an introduction to Industrial and Organizational Psychology(3rd
edition). Chicago: The Dorsey Press.
Müller, S.M. & Roodt, G. (1998). Die verband tussen werk-nemers se houding jeens regstellende aksie en hul werksbetrokkenheid: ’n Eksploratiewe studie (The relationship between employees’ attitudes against affirmative action and their work involvement: An explorative study). SA Journal of Industrial Psychology, 24(1), 26-32.
Noe, R.A. (1988). An investigation of the determinants of successful assigned mentoring relationships. Personnel Psychology, 41, 457-479.
Primos, L. (1994). Searching for gold: The challenge for affirmative action recruitment. People Dynamics, 32-35. Republic of South Africa. (1998). Employment Equity Act No. 55
of 1998. Government Gazette, 450(22209).
Roberts, A. (1997). Affirmative action. Hell for blacks too?
Financial Mail, 144, February 21, 18-22.
Roodt, G. (1997). Theoretical and empirical linkages between work-related commitment foci. SA Journal of Industrial Psychology, 23(2), 6-13.
Roodt, G. (2004). Concept redundancy and contamination in employee commitment research: Current problems and future directions. SA Journal of Industrial Psychology, 30(1), 82-90.
Schepers, J.M. (1992). Toetskonstruksie: Teorie en praktyk (Test construction: Theory and practice). Johannesburg: Randse Afrikaanse Universiteit.
Sibanda, M. (1995). Taking a tilt at pinball wizards. Weekly Mail & Guardian, March 31- April 6, 13.
Singh, V., Bains, D. & Vinnicombe, S. (2002). Informal mentoring as an organisational resource. Long Range Planning, 35, 389-405.
Smith, H. & Roodt, G. (2003). Are industries’ responding differently to the employment equity challenge? SA Journal of Human Resource Management, 1(1), 32-41.
Storm, L. & Roodt, G. (2002). Die verband tussen organisasie-sosialisering en organisasieverbondenheid (The relationship between organisation socialisation and organisation commitment). SA Journal of Industrial Psychology, 28(1), 14-21. Vallabh, M. & Donald, F. (2001). A comparison of black and white managers on intent to leave and job mobility. SA Journal of Industrial Psychology, 27(2), 37-42.
Van Zyl, B. & Roodt, G. (2003). Female perceptions on employment equity: Is the glass ceiling cracking? SA Journal of Human Resource Management, 1(2), 13-20.
Walbrugh, A. & Roodt, G. (2003). Different age groups’ response to employment equity practices. SA Journal of Human Resource Management, 1(2), 28-39.
Walker, J.M. & Lawler, J.J. (1979). Dual unions and political processes in organizations. Industrial Relations, 18, 32-43. Webster, E.C. (1979). A profile of unregistered union members in
Durban. South African Labor Bulletin, 4, 43-74.
Webster, E.C. (1983). The labour process and forms of workplace organization in South African Foundries. Doctoral Dissertation. Johannesburg: University of the Witwatersrand. Wingrove, T. (2002). Mentoring challenges to sweeten the
medicine. HR Future, 2(11), November/December, 10-12. Yousef, D.A. (2000). Organizational commitment and job