R E S E A R C H
Open Access
The
Objective Ear
: assessing the progress of
a music task
Joel Burrows
*and Vivekanandan Kumar
* Correspondence: [email protected] Athabasca University, Athabasca, Canada
Abstract
Music educators must assess the progress made by their students between lessons. This assessment process is error prone, relying on memory and listening skills. The Objective Earis a tool that takes as input a pair of performances of a piece of music and returns an accurate and reliable assessment of the progress between the performances. The tool evaluates performances using domain knowledge to generate a vector of metrics. The vectors for a pair of performances are subtracted from each other and the differences are used as input to a machine-learning classifier which maps the differences to an assessment. The implementation demonstrates that theObjective Eartool is a feasible and practical solution to the problem of assessment. The assessments provided by this tool are valuable to students and teachers, but also to music education researchers who can use progress data to better model music education.
Keywords:Music education, Assessment, Learning analytics, Machine learning
Introduction
We define theObjective Earas an agent that takes as input a pair of performances of a piece of music and returns an accurate and reliable classification of the progress made between the two performances. For example, a student at a music lesson may perform a piece that he or she is working on and the agent will compare that performance to the performance from the previous lesson to determine what, if any, progress has been made between lessons. Teachers and students can use such a tool as feedback during a music lesson, but the tool could also be used as part of a learning environment to provide valuable information to educators on the conditions under which a student makes progress. This paper describes the successful implementation of theObjective Ear.
Background
A music teacher’s ability to assess students has been well researched. The type of train-ing a music teacher receives affects the kinds of errors a teacher detects. For example, band teachers are more attuned to rhythm errors whereas choir teachers are more attuned to pitch errors (Stambaugh 2016). Several factors affect a teacher’s ability to detect a pitch error, such as the size of the interval between a pitch and the previous pitch (Groulx2013). Discrepancies in assessment arise when assessing the performance of an entire piece of music compared to splitting it into pieces and evaluating each section individually (Darrow2006). Assessment becomes even more difficult when the
teacher must compare a performance to the memory of another performance from a previous lesson.
TheObjective Earmust be matched to a genre of music. A universalObjective Earis im-possible because the fundamental rules of music have changed over time, and vary across the music traditions of various cultures. For example, the Objective Ear would never be appropriate for aleatoric music, a contemporary genre in which music is composed randomly, abandoning the rules anObjective Ear needs to find patterns (Grout2001.) For this implementation of the Objective Ear, we limit the scope to Western music from the Classical era. This era covers the rise of Haydn and continues through to the death of Beethoven, roughly a period between the late 1700s and the early 1800s (Grout2001).
Learning analytics“includes techniques such as predictive modeling, building learner profiles, personalized and adaptive learning, optimizing learner success, early interven-tions, social network analysis, concept analysis, and sentiment analysis”(Siemens2012). For anyone hoping to use learning analytics in music performance assessment, having an accurate and objective measurement of progress provides valuable information that can be used in various learning analytics activities.
Method
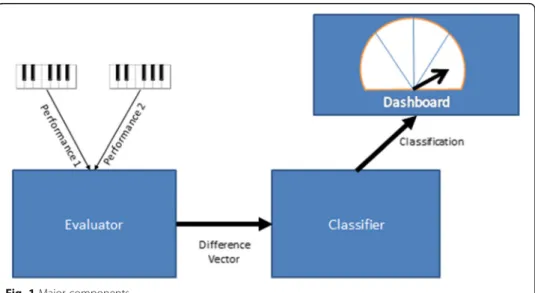
TheObjective Earhas two main components: An evaluator and a classifier (Fig.1)
Two performances of a piece of music in the MIDI data format (Guerin2008) are input to the evaluator component. The MIDI data format has been used with a wide variety of instruments, but its greatest success has been found with keyboard instruments. Thus, the Objective Ear’s performance is skewed in favor of keyboards over other musical instruments. The evaluator performs several analyses of these performances. Each analysis results in a metric, and thus the evaluator produces a vector of metrics for each performance. These two vectors from the two performances are subtracted from each other, resulting in a difference vector. This difference vector is the input to a classifier that maps the difference vector to a classification from the set {worse, same, better}. Although this implementation limits the classification to these categories, other
implementations could increase the number of categories for a finer-grained classi-fication, or could instead use a regression algorithm instead of a classification algo-rithm to give a numeric assessment rather than a classification. Adding more categories requires more effort in creating an appropriate training dataset for the classifier or regression (Fig. 2).
The evaluator applies a variety of techniques derived from the field of automated music analysis to create the metrics. From these analyses, we obtain the features used as input to the classifier. The evaluator does not rely on a score, but in the same way that a human familiar with a music tradition can detect errors in a piece that he or she has never heard before, the evaluator component identifies likely errors (Table1).
A tempo analysis determines the tempo of the piece of music. Often, as a student masters a task, the tempo of the student’s performance increases. This is especially true when learning keyboard music. Thus, the tempo can be a valuable metric for progress. To find the tempo, the inter-offset-interval (IOI) of every note is calculated. This is the duration between a note and its predecessor. Notes played simultaneously have an IOI time of zero. These zero IOIs are ignored, and the rest are clustered to find the largest cluster of IOIs using a hierarchical agglomerative clustering algorithm (Dixon 2001). This method of finding the tempo does not reliably find the tempo as per the written score of a piece of music but rather a multiple of the written tempo; but the tempo remains accurate relative to other performances of the same piece of music, making it suitable as a metric. For example, if a piece of music contains predominantly quarter notes, then the tempo algorithm will use quarter notes as the basis of the tempo. A second performance of the piece may be significantly faster, but the tempo metric will reflect this change because, since quarter notes are still predominant, it will continue to use them as the basis for the tempo.
For polyphonic performances, voice separation is an important first step before evalu-ating several of the following metrics. By separevalu-ating voices, we take a performance in which several notes sound simultaneously, and separate them such that in each separated voice, only one note is played at a time. This reduces a polyphonic perform-ance into a set of monophonic performperform-ances (Fig.3).
We perform voice separation using a greedy search algorithm. For each note, we consider adding it to each of the existing voices, and, using a cost function, assign it to the voice with the cheapest cost. This cost function is a weighted function of the time between notes and the difference in pitch between notes. Thus, notes played one right after the other that are close in pitch tend to be placed in the same voice. If we have multiple notes played at the same time, we try all notes with all voices, and assign notes in order of cost. If we have more notes than voices, then we create a new voice with the leftover note.
A pitch analysis searches for likely pitch errors in separated voices. The evaluator identifies pitch errors by applying a hidden Markov model using an nGram technique on a transformed data set to find unlikely pitch intervals. It transforms the data into an appropriate alphabet by first categorizing notes as being long, medium, short or simul-taneous, based on the tempo of the piece. Rather than processing raw pitches, it extracts the interval between two pitches and scales it to an octave. For example, if a note with a long inter-offset-interval moves from C to E, in this alphabet it is represented as a long major third. Thus, the alphabet consists of duration and interval tuples.
The nGram approach to finding pitch errors requires a dataset for training. The training data comes from Classical piano music in MIDI format transformed into the pitch analyzer’s alphabet. This transformation was done by converting the notes’ pitches to intervals, and comparing their inter-onset-intervals to the tempo. The pitch Table 1Evaluator analyses
Analysis Description
Tempo The pace of the music.
Pitch The rate of likely pitch errors.
Rhythm The rate of likely rhythm errors.
Flex-Rhythm The rate of likely rhythm errors, allowing the tempo to slow at the end of sections.
Ornaments The rate of ornaments performed, weighted by their complexity.
Error Groups The rate of errors after combining errors close in time as a single error.
analyzer uses this data to calculate the probabilities of 3-g. After converting a perform-ance to our alphabet, the evaluator determines the likelihood of a note given its prede-cessors. The evaluator flags improbable notes – sequences of three notes for which their 3-g probability is below a configurable threshold–as being unlikely. This thresh-old was set by examining the 3-g probabilities, and choosing a threshthresh-old that allowed the majority of observed 3-g. By dividing the number of likely errors by the number of notes, the evaluator calculates a normalized error rate for pitch errors.
The rhythm analysis applies the tempo analysis to find likely rhythm errors. Rhythm in the Classical period is usually related to the tempo by a factor of two or three, and thus comes from the set X, where T is the tempo derived above:
X ¼x:2i3j;−5≤i≤5;−5≤j≤5
The evaluator first calculates all the values in set X to determine the set of expected IOIs. It then compares the actual IOI for each note to the closest value in the set of ex-pected IOIs and determines which notes deviate too much from any of the exex-pected values, the amount of deviation being a configurable parameter. As with the pitch er-rors, the evaluator divides the number of rhythm deviations by the total number of notes to give a normalized error rate for rhythm errors.
This approach is unnecessarily broad because a performer can slightly change the tempo of a piece of music during a performance. A piece of music can, structurally, be broken recursively into smaller sections. At the end of more significant sections, it is acceptable in much of Western music from the Classical period for the performer to slow the tempo (Rosenblum1988). In the Romantic period that followed the Classical period, tempo rubato became more prevalent. The evaluator analyzes the piece to find the various sections (Hamanaka et al. 2006) and based on how close a note is to the end of a major section, it allows the note to deviate more from the expected note value. Like the rhythm analysis, this gives us flex-rhythm errors which we turn into a normal-ized error rate.
Performers of music from the classical period frequently decorate their music with ornaments. Ornaments are musical figures that a performer typically plays very quickly, but identifying ornaments is difficult because they inherently ambiguous depending on how the composer notates the music. The evaluator considers all short passages of quick notes that do not deviate too much from a central pitch as an ornament, an approach similar to how we might identify ornaments when listening to a performance. This definition is sufficient to capture most ornaments. Using this rule-based approach, ornaments can be identified (Gingras and McAdams 2011). Once identified, we can categorize the number of ornaments and their complexity by counting the number of notes in an ornament. Thus, a long trill is considered significantly more complex than a mordent. Using the complexity as a weight we can give a weighted count of orna-ments in a piece and then normalize it to a rate. Unlike error rates, a higher value in the metric demonstrates greater mastery (Fig.4).
problematic than trying to analyze each individual error made during the sequence of errors. The evaluator groups errors in time. That is, all errors within a time threshold are combined as a single error. Using this approach, the evaluator counts the number of error groups, and normalizes this to an error rate per note. The error group does not replace the other analyses, but instead uses them to create a new feature for the classifier that may be meaningful during training. By using a clustering algorithm to find error groups, we are combining these other errors in a non-linear way, making it more likely that error groups could be a meaningful metric.
For each performance, the evaluator component creates a vector of metrics. It sub-tracts the vectors for a pair of performances creating a difference vector. The classifier maps the difference vector to an indication of progress. A machine learning classifier requires a dataset for training, and the creation of such a dataset is part of this research activity. The dataset was prepared by recording pairs of performances of music from the Classical era. All the music was keyboard music – mostly piano but with some pieces also appropriate for a harpsichord or clavichord -- performed on a digital piano. A set of eight human listeners listened to the pair of performances and classified the pro-gress. We applied several techniques to overcome flaws in human assessment. We used short excerpts instead of full pieces. We also played the second performance immediately after the first so that both performances were fresh in the listener’s memory. We had multiple participants listen to each pair of performances so that we could identify poor judgements by using a statistical analysis of all the results. In total, 227 pairs of performances were evaluated. An analysis of the data showed that data items had minimal variance between the judgements of listeners.
We chose a simple decision tree classifier that uses information gain to determine best split points because decision trees, as opposed to many other kinds of classifiers, can be analyzed to generate human-understandable rules. The items in the dataset are randomly split between the training set and the test set with two-thirds of the items put in the training set and one third in the test set. Because of the size of the dataset, this decision tree implementation did not include pruning to prevent overfitting (Bishop2006).
Results
To test the classifier, and the overall system, we ran the items in the test set through the classifier, and compared the decision tree’s classification to the expected classifica-tion from the human judgements. This conforms to standard test approaches to
machine learning applications (Bishop 2006). From the test runs, we created a confu-sion matrix for the classifier and in turn determined the classifier’s accuracy. We also calculated the standard error of the classifier, and thus gave a confidence interval for the classifier’s accuracy.
If we let T be the sum of the elements on the diagonal of the confusion matrix and n be the total number of data points, we calculate the accuracy as
accuracy¼Tn
the standard error as
SE¼
ffiffiffiffiffiffiffiffiffiffiffiffiffiffiffiffiffiffiffiffiffiffiffiffiffiffiffiffiffiffiffiffiffiffiffiffiffiffiffiffiffiffiffiffi
accuracyð1−accuracyÞ
n
r
and the 95% confidence interval as
accuracy−1:96SE;accuracyþ1:96SE
½
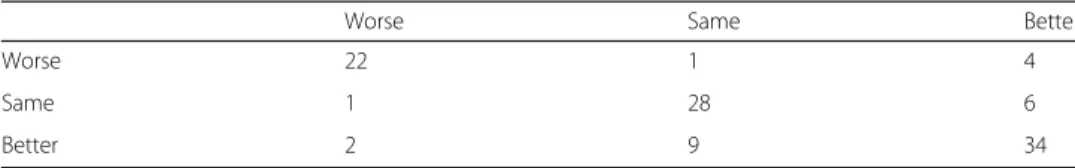
Running the test set against the classifier produces the following confusion matrix (Table2).
The accuracy is 0.785, the error rate is 0.215, and the standard error is 0.040. Apply-ing the standard error, we get a 95% confidence interval with the range [0.707, 0.863].
An intermediate dataset was created by the evaluator processing the dataset’s elements and pairing each resulting difference vector with its original element’s judgement. Using the Weka toolset (Eibe et al.2016) a variety of classifiers were trained using this dataset, producing the following results (Table3).
Discussion
The results show that the Objective Ear is feasible. The implementation provides a tool sufficiently powerful to add value to a music learning system and aid students and teachers in music education. The experimentation with the Weka toolkit does show that the decision tree used in the tool is less accurate than other types of machine learning classifiers, indicating that tool could be improved by further tuning the decision tree, implementing pruning, or by choosing a different Table 2Confusion matrix
Worse Same Better
Worse 22 1 4
Same 1 28 6
Better 2 9 34
Table 3Weka classifier accuracy
Algorithm Accuracy
J.48 Decision Tree 0.819
Random Forest 0.842
Multilayer Perceptron 0.853
classification algorithm; but it also shows that the features extracted by the evalu-ator are sufficient to determine progress.
Conclusion
The Objective Ear is a powerful tool for music educators. This research demonstrates the feasibility of automating assessment. Possible next steps include extending the tool to support music from other periods of Western music, such as the Baroque and Romantic periods, or to support non-Western music traditions. As well, we could dra-matically improve the tool’s usability by applying automated music transcription to convert raw audio signals into MIDI data or into an internal data structure better able to capture the properties of various instruments. This could make the Objective Ear more suitable for instruments other than keyboards. The field of automated music transcription is still progressing, and may soon be able to accurately perform the neces-sary transcription. This would make it possible to implement the Objective Ear as a smartphone app, making it significantly easier to use and expanding the tool to instru-ments that do not provide MIDI interfaces.
We see the Objective Ear being integrated with a learning management system targeted at music education. This would simplify organizing the performances by piece and recording new performances. The learning management system would also provide history on the progress the student makes week over week, and could provide the teacher with valuable information on the student’s learning profile, allowing the teacher to tune the curriculum to best suit the student.
This tool could be used to provide valuable data for learning analytics researchers. Assessing progress can be more useful to researchers than a final grade because the assessment measure is more fine-grained. It can also be correlated with other student activities to determine a learning model for music education, or to better personalize learning for a student.
The approach used by theObjective Earcould be applied to other performative skills such as dancing, figure skating, or boxing. In these cases, the evaluator’s metrics would need to be implemented using domain specific analyses. For many of these skills, a tool that accurately assesses progress would provide value.
Availability of data and materials
The datasets used during the current study are available from the corresponding author on reasonable request.
Authors’contributions
JB: authoring the document and research, VK: research. Both authors read and approved the final manuscript.
Competing interests
The authors declare that they have no competing interests.
Publisher’s Note
Springer Nature remains neutral with regard to jurisdictional claims in published maps and institutional affiliations.
Received: 13 June 2018 Accepted: 15 August 2018
References
C. Bishop,Pattern Recognition and Machine Learning(Springer-Verlag, New York, 2006)
A.-A. Darrow, Examining the validity of self-report: Middle-level singers’ability to predict and assess their sight-singing skills. Int J Music Educ24(1), 21–29 (2006)
F. Eibe, M.A. Hall, I.H. Witten, inOnline Appendix for Data Mining: Practical Machine Learning Tools and Techniques, Morgan
Kaufmann, Fourth edn.. The WEKA Workbench (2016)
B. Gingras, S. McAdams, Improved score-performance matching using both structure and temporal information from MIDI recordings. J New Music Res41(1), 43–57 (2011)
T. Groulx, The influence of tonal and atonal contexts on error detection accuracy. J Res Music Educ61(2), 233–243 (2013) D.J. Grout,A History of Western Music, 6th edn. (W. W. Norton & Company Inc., New York, 2001)
R. Guerin,MIDI Power!2nd edn. (Cengage Learning, Boston, 2008)
M. Hamanaka, K. Hirata, S. Tojo, Implementing‘a generative theory of tonal music’. J New Music Res35(4), 249–277 (2006) Rosenblum, Sandra. Performance Practices Is Classic Piano Music. (Indiana University Press, Bloomington, 1988)