[Geef de tekst op] [Geef de tekst op] [Geef de tekst op]
Master's Thesis, Research Master Clinical and Health Psychology, Universiteit Leiden Research conducted at: Department of psychological medicine, King’s College London December 2015
Student number: S1010727 Word Count: 7252
External supervisor: Dr. Kirsty Winkley, King’s College London Internal supervisor: Dr. Sasja Huisman, Universiteit Leiden
The association between
psychological distress and
insulin initiation in patients with
Type 2 diabetes
A prospective cohort study
1 Table of contents
Abstract 3
1. Introduction 4
1.1 Disease management 4
1.2 Psychological insulin resistance 5
1.3 Depression and diabetes-specific-distress 5
1.4 Current study 7
1.4.1 Insulin requiring status 8
1.4.2 Insulin initiation 8
2. Methods 10
2.1 Participants 10
2.2 Design 10
2.3 Materials 10
2.3.1 Baseline materials 10
2.3.1.1 Baseline demographics 10
2.3.1.2 Baseline diabetes and clinical factors 10
2.3.1.3 Patient Health Questionnaire (PHQ-9) 11
2.3.1.4 Problem Areas in Diabetes (PAID) Questionnaire. 11 2.3.1.5 Barriers to Insulin Treatment (BIT) Questionnaire 11
2.3.2 Follow-up materials 12
2.4 Procedure 12
2.5 Statistical analyses 13
2.5.1 Kaplan-Meier method 13
2.5.2 Cox regression method 14
2.5.3 Confounder analyses 15
2.5.4 Missing data 15
3. Results 16
3.1 Participants 16
3.3 Insulin requiring status 18
3.3.1 Kaplan-Meier 18
2
3.3 Insulin initiation status 20
3.2.1 Kaplan-Meier 20
3.2.2 Cox Regression 22
4. Discussion 24
4.1 Insulin requiring status 24
4.2 Insulin initiation delay 24
4.3 Limitations and suggestions for further research 25
4.4 Conclusions 26
3 Abstract
Background: Despite advances in Type 2 diabetes treatment most patients will require insulin as their diabetes progresses. However, many patients delay insulin initiation. We analyzed whether psychological distress is associated with delaying insulin initiation.
Methods:This was a 3- to 7-year follow-up of the South London Diabetes cohort study (N = 1335). Baseline data of questionnaires regarding depressive symptoms (Patient Health Questionnaire), diabetes-specific distress (Problem Areas in Diabetes), and psychological insulin resistance (PIR; Barriers to Insulin Treatment) were used. Current medication status and recent HbA1c-values were collected from medical records.
Results: There was a trend between depressive symptoms and time to becoming insulin requiring (HR = 1.03, 95% CI 1.00-1.06, p = .06). This trend disappeared after confounder adjustment. Depressive symptoms were not associated with insulin initiation delay (HR = 1,03, 95% CI .99-1.06, p = .11). Diabetes-specific distress was associated with a shorter time to becoming insulin requiring (HR = 1.02, 95% CI 1.01-1.02, p < 0.001), and a shorter insulin initiation delay after adjustment for demographic confounders (HR = 1.01, 95% CI 1.00-1.03,
p < 0.05). PIR was associated with a longer insulin initiation delay after confounder adjustment (HR = .99, 95% CI .98-1.00, p < .05).
Conclusions:PIR was related to longer insulin initiation delay. Depressive symptoms did not influence insulin status. Diabetes-specific distress seemed related to a shorter time to
4 1. Introduction
Due to the progressive nature of Type 2 diabetes mellitus (T2DM) many patients with the condition will eventually need insulin therapy in order to properly manage the disease (NICE, 2015; UKPDS, 1995). The number of patients who will require insulin initiation is rising due to improved life expectancy, stricter glycemic targets, and an increasing prevalence of T2DM (Sunaert et al., 2014). In 2014 the estimated worldwide prevalence of diabetes among adults was 387 million, and is expected to increase to 592 people by 2035 (International Diabetes Federation, 2014). According to a recent study almost one in three people will eventually develop T2DM (Ligthart et al., 2015).
Inadequate diabetes management may lead to complications such as retinopathy, nephropathy, and cardiovascular disease (Fowler, 2008; Stratton et al., 2006). However, many T2DM patients delay insulin initiation for up to five years (Nichols, Koo, & Shah, 2007; Rubino, McQuay, Gough, Kvasz, & Tennis, 2007; Ziemer et al., 2005). The aim of the current study was to examine whether psychological distress is related to insulin initiation delay in T2DM patients.
1.1 Disease management
5 Hyperglycemia increases the risk of developing diabetes complications (Fowler, 2008; Stratton et al., 2000). Diabetes complications are commonly classified as microvascular (i.e., diabetic nephropathy, neuropathy, or retinopathy) and macrovascular (i.e., coronary artery disease, peripheral arterial disease, or stroke) complications (Fowler, 2008). In a large prospective study of newly diagnosed T2DM patients hyperglycemia was strongly related to the risk of both types of complications (Stratton et al., 2000). Each reduction of one percent in HbA1c was associated with a risk reduction for complications of 21 percent. The aim of treatment in T2DM is therefore to prevent complications by trying to achieve normal
glycemia (Fowler, 2008). Starting insulin therapy early in the course of diabetes can improve glycemic control over time and reduce the risk of complications (Khunti, Vora, & Davies, 2014; Turner, 1998; Ziemer et al., 2005). However, according to the National Diabetes Audit 2012-2013 only 37.4 percent of T2DM patients in the United Kingdom achieved the targets that are recommended to reduce the risk of developing diabetes complications (HSCIC National Diabetes Audit, 2014).
1.2 Psychological insulin resistance
Despite the benefits of insulin therapy, initiation is often delayed for up to five years after failure of OADs (Nichols et al., 2007; Rubino et al., 2007; Ziemer et al., 2005). Cross-sectional research suggests that at least one in four insulin-naive patients is unwilling to start insulin therapy if prescribed (Larkin et al., 2008; Polonsky, Fisher, Guzman, Villa-Caballero, & Edelman, 2005). This reluctance to start with insulin therapy is termed psychological insulin resistance (Polonsky et al., 2005). Patients who are unwilling to start with insulin therapy have reported more negative beliefs about insulin treatment (Polonsky et al., 2005). Common negative attitudes toward insulin therapy include a fear of needles, expected discomfort or pain, perceived loss of control, poor self-efficacy in managing insulin therapy, fear of hypoglycemia, and a feeling of a lack of fairness (Larkin et al., 2008; Makine et al., 2009; Polonsky et al., 2005). It has been suggested that the negative appraisal of insulin is modifiable, as it has been demonstrated that barriers to insulin therapy increased in patients who remained on oral medication, whereas it decreased in patients who initiated insulin therapy (Hermanns, Mahr, Kulzer, Skovlund, & Haak, 2010).
1.3 Depression and diabetes-specific-distress
6 associated with the onset of diabetes (Nouwen et al., 2010), poor glycemic control (Lustman et al., 2000), diabetes complications (Pouwer, Nefs, & Nouwen, 2013), and mortality (Fisher et al., 2010; Ismail, Winkley, Stahl, Chalder, & Edmonds, 2007). Furthermore, patients with a medical chronic disease and comorbid depression are three times more likely to be non-adherent to treatment than non-depressed patients (DiMatteo, Lepper, & Croghan, 2000). Richardson and colleagues (2008) were the first to explore the relationship between
depressive symptoms and glycemic control longitudinally. They demonstrated that depression was associated with poor glycemic control in T2DM. However, all participants were
veterans, which limits the generalizability of the results as veterans tend to be older, are mostly men, and have more comorbidity than the general diabetes population (Miller,
Safford, & Pogach, 2004; Richardson, Egede, Mueller, Echols, & Gebregziabher, 2008). Nefs and colleagues (2013) recently analyzed the association between depressive symptoms and insulin initiation in Dutch T2DM patients. In this study the authors did not find an association between depressive symptoms and time to insulin initiation. However, this finding could be related to some of the limitations of the study. One of the limitations was that only two percent of their sample was from a non-western ethnicity, whereas research suggests that ethnicity and culture are relevant factors with regard to insulin initiation as patients from ethnic minorities may have culture specific barriers to insulin therapy (Lee, Lee, & Ng, 2012; Polonsky et al., 2005). Furthermore, the authors only assessed depressive symptoms and did not assess any other psychological factors (Nefs et al., 2013). Finally, they only reported when people received their first insulin prescription, which can either signify an unnecessary delay of insulin initiation or a longer period of optimal glucose control (Nefs et al., 2013).
Fisher and colleagues (2007) have stressed the importance of differentiating between depression and diabetes-specific distress. The diabetes-specific component of emotional distress and negative mood does not only reflect general dysphoria regarding the disease and the disease management, but also distress associated with regimen adherence, general health, comorbidities, and other diabetes-related health care, economical, social, and family
difficulties. According to their study approximately 70 percent of patients who had high diabetes-specific distress did not meet the criteria for clinical depression. An important implication is that diabetes patients who are significantly distressed but who are not clinically depressed may not benefit from interventions that are derived from studies focused on
7 specific aspects of their distress, rather than interventions specifically directed at depression (Fisher et al., 2007). A different study (Gonzalez, Delahanty, Safren, Meigs, & Grant, 2008) has provided further support for the differentiation between diabetes-specific distress and depressive symptoms. Even though symptoms of depression and diabetes-specific distress are related, the results of this study provide further support that they are indeed independent constructs (Gonzalez et al., 2008).
Diabetes-specific distress has been found to be associated with poor glycemic control (Hayashino, Okamura, Matsunaga, Tsujii, & Ishii, 2012), and poorer self-care severity (Mollema, Snoek, Ader, Heine, & van der Ploeg, 2001). Mixed results have been reported with regards to whether depressive symptoms or diabetes-specific distress is a better predictor of diabetes self-care. Fisher and colleagues (2007) found that diabetes-specific distress was a better predictor of diabetes self-care than depressive symptoms or a diagnosis of major depressive disorder. However, in the study by Gonzalez and colleagues (2008) depressive symptoms were more strongly related to diabetes-self care than diabetes-specific distress. Those mixed findings may be related to methodological differences (Gonzalez et al., 2008).
A cross-sectional study demonstrated that level of depressive symptoms was the strongest predictor of fear of self-injection severity (Mollema et al., 2001) The association between depressive symptoms and negative insulin appraisal was confirmed by a more recent study, in which the authors also found a positive association between diabetes-specific
distress and negative insulin appraisal that was stronger than the association with depressive symptoms (Makine et al., 2009). These findings suggest that in insulin-naïve T2DM patients diabetes-specific distress directly contributes to a more negative appraisal of insulin
initiation. However, this association was only found in a cross-sectional study and therefore no assumptions about causality can be made. The longitudinal association between diabetes-specific distress and insulin initiation has yet to be established.
1.4 Current study
8 1.4.1 Insulin requiring status
According to the guidelines of the national institute for health and care excellence (NICE) T2DM patients can be defined as insulin requiring when despite being on dual OAD therapy, a patient has suboptimal glycemic control (HbA1c ≥ 58 mmols/mol on two occasions; NICE, 2015). It is possible that psychological distress is associated with insulin requiring status, as it is known that depressive symptoms and diabetes-specific distress are associated with worse glycemic control in diabetes patients (Hayashino et al., 2012; Lustman et al., 2000), and poor glycemic control could indicate a need for insulin treatment (NICE, 2015). Furthermore, as previous research has shown that T2DM patients with depressive symptoms appear to visit their physicians more often (Dzida, Karnieli, Svendsen, Sølje, & Hermanns, 2015), those patients might get their HbA1c-values checked more frequently at their GP, which would increase the chance of early detection of a need for insulin therapy. The first aim of this study was to determine whether depressive symptoms and diabetes-specific distress were
prospectively associated with insulin requiring status in patients newly diagnosed with T2DM in South London. It was hypothesized that both depressive symptoms and diabetes-specific distress were independently related to a shorter time to becoming insulin requiring. This would indicate that psychological distress shortly after diagnosis could worsen longer-term diabetes outcomes.
1.4.2 Insulin initiation
The main aim of the study was to analyze whether psychological distress is also associated with a delay in insulin initiation in patients who require insulin therapy. First, we analyzed whether depressive symptoms were associated with insulin initiation delay. As depressive symptoms have been found to be associated with a negative attitude toward insulin initiation (Larkin et al., 2008; Makine et al., 2009; Mollema et al., 2001), as well as to patients being non-adherent to treatment (DiMatteo, Lepper, & Croghan, 2000), we hypothesized that depressive symptoms shortly after diagnosis would be associated with a longer insulin initiation delay in T2DM patients. The previously mentioned limitations of the study by Nefs and colleagues (2013) on the association between depressive symptoms and insulin initiation were addressed. Our sample has a diverse ethnic background as approximately 51 percent of the participants have a non-western ethnicity, which will increase the generalizability of the results. Furthermore, besides depressive symptoms we also examined other forms of
9 al., 2013), we determined for how long insulin had been delayed by calculating the time between the moment a patient became insulin requiring and the patient’s first insulin prescription.
10 2. Methods
2.1 Participants
Participants were part of an existing incident T2DM cohort (N = 1790). Eligible participants for this cohort were adults aged 18-75 who were recently (≤ 6 months) diagnosed with T2DM according to World Health Organization criteria. Patients were recruited from 90 general practitioner (GP) surgeries in three adjacent inner-city boroughs of South London (i.e., Lambeth, Southwark, and Lewisham). Participants were excluded if they met any of the following criteria: diagnosis of T2DM > 6 months ago, other types of diabetes, temporary residents, living outside of the area of the three clinical commission groups, not fluent in spoken English, severe mental illness (e.g., dementia, bipolar disorder, substance
dependence, or personality disorder), advanced or terminal disease, or severe advanced diabetes complications (i.e., blindness, requiring dialysis, or above-knee amputation).
2.2 Design
The study was a prospective cohort study with a 3- to 7-year follow-up, depending on when participants were recruited. Table 1 depicts the number of participants who were recruited each year.
Table 1. Number of SOUL-D Participants per Recruitment Year.
Year of recruitment 2008 2009 2010 2011 2012
N 94 501 509 386 294 Years in study at time of follow-up 7 6 5 4 3
2.3 Materials
2.3.1 Baseline materials
2.3.1.1 Baseline demographics
Sociodemographic background variables that have been recorded include age, gender, self-reported ethnicity, partnership status, employment status, and educational level.
2.3.1.2 Baseline diabetes and clinical factors
11 symptoms present or absent at diagnosis). Macrovascular complications were recorded
(history of myocardial infarction, coronary artery bypass graft, cerebrovascular accident, and carotid or limb re-vascularization) and presence of microvascular disease was recorded (neuropathy, retinopathy, and nephropathy; Winkley et al., 2013). Finally, type and dose of diabetes medications were reported.
2.3.1.3 Patient Health Questionnaire (PHQ-9)
The PHQ-9 was used to measure depressive symptoms (Kroenke, Spitzer, & Williams, 2001). Patients had to indicate how often they have been bother by nine different problems (e.g., ‘feeling tired or having little energy’) during the past two weeks. The items can be answered on a 4-point Likert scale (0 = ‘Not at all’ to 3 = ‘Nearly every day’). Scores can range from 0 to 27 with higher scores indicating more depressive symptoms. A score of 10 or higher indicates moderate to severe depressive symptoms (Kroenke & Spitzer, 2002).
2.3.1.4 Problem Areas in Diabetes (PAID) Questionnaire.
The PAID (Polonsky et al., 1995) questionnaire consists of 20 items that can be rated from 0 (‘Not a problem’) to 4 (‘Serious problem’). It is a measure of negative emotions and distress that diabetes patients may experience while coping with their disease. Patients are asked which of the 20 items are currently problems for them (e.g. ‘Feelings of guilt or anxiety when you get off track with your diabetes management?’). Scores on all items were summed and multiplied by 1.25 to achieve a finals score range between 0 and 100. Scores higher than 40 represent a high risk of emotional burnout.
2.3.1.5 Barriers to Insulin Treatment (BIT) Questionnaire
12 2.3.2 Follow-up materials
The medical records of participants were accessed to collect follow-up data. HbA1c-values of the last three GP visits, current OAD prescriptions (type, dose, and date of first prescription), current insulin prescriptions (type, dose, and date of first prescription), and diabetes
complications were reported. For patients who were on insulin therapy or who were insulin requiring additional HbA1c-values and data about past medication prescriptions were collected.
2.4 Procedure
The study has been granted ethics approval (King’s College Hospital Research Ethics Committee reference 08/H0808/1, and Lambeth, Southwark, and Lewisham Primary Care Trusts, reference RDLSLB 410). Participants had given informed consent for their medical data to be collected for up to 20 years after the baseline study. Participants who have
withdrawn from the study in the meantime were excluded from the study. An email was sent to the practice managers of all GP surgeries that were included in the baseline study. If no reply was received within ten days, a reminder email was sent. If the practice manager did not respond to this second email within at least one week, we tried to contact the surgery by phone once. In total 55 surgeries agreed to take part in the follow-up study (Figure 1).
Anonymized data of the medical records of all participants were collected at the GP surgeries by assessing their medical records in the clinical software (EMIS or Vision) used by the GP and collecting the follow-up data. Participants were defined as insulin requiring if by three- to seven-years follow-up (depending on their year of enrollment in the study, Table 1) they met the NICE guidelines for intensification of therapy with insulin (i.e., despite being on dual OAD therapy, the patient has suboptimal glycemic control: HbA1c ≥ 7.5%, or 58
13
Figure 1. Flowchart of GP Surgeries Included in Follow-up. 2.5 Statistical analyses
Survival analyses were used to analyze time to becoming insulin requiring and time to insulin initiation. The aim of survival analyses is to model and analyze time-to-event data (Jager, van Dijk, Zoccali, & Dekker, 2008). With survival analyses the time until the event (i.e.,
becoming insulin requiring, or initiation of insulin therapy) occurred was analyzed. At the end of the follow-up period the event will however not have happened for all patients. For these patients the survival time will be censored, as we only know that the event did not occur during the follow-up period (Altman & Bland, 1998). The data of patients who were deceased and did not experience the event were censored on their date of death, and for patients who switched GP the time to event was censored at the date of their last GP visit.
2.5.1 Kaplan-Meier method
The most frequently used type of survival analyses is called the Kaplan-Meier method (Jager et al., 2008). With this method one can compare the time to event of participants in different groups. This method was therefore used to compare the time to becoming insulin requiring or time to insulin initiation of patients with low and high levels of the different types of
14 participants with censored data is that they have not yet experienced the event, but we do not know if or when they will experience the event. However, as the median represent the time point where the cumulative survival drops below 50 percent, the median cannot be defined for analyses where the cumulative survival does not drop below this percentage (Jager et al., 2008). Therefore we included the median survival times when cumulative survival dropped below 50 percent, and mean survival times when this did not happen.
To compare the survival between different groups we used the logrank test. This test is the most popular method of comparing the survival of groups, and takes the whole follow-up time period into account (Bland & Altman, 2004). A disadvantage of the Kaplan-Meier method and logrank test is that it can only be used for categorical data. Furthermore, it is not possible to adjust for confounding variables with these techniques (Jager et al., 2008). Therefore we used Cox regression analyses to further analyze the data.
2.5.2 Cox regression method
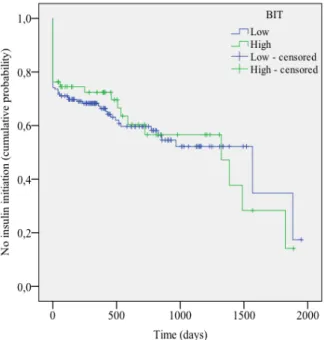
For the analyses using the Cox regression method we used the discrete ordinal data of the questionnaire scores rather than the categorized data to increase sensitivity. One of the assumptions of the Cox regression model is that the hazards of different groups should be proportional to each other, and that the hazard ratio (HR) should be the same during the follow-up period (Stel, Dekker, Tripepi, Zoccali, & Jager, 2011). Even though it is unlikely that this assumption is ever fully satisfied, it is important to check whether there are no major violations as this may lead to wrong and misleading estimates of the true effect (Stel et al., 2011). To check the assumption of proportional hazards, we first examined the Kaplan-Meier curves for insulin requiring status (PHQ-9 and PAID) and insulin initiation status (PHQ-9, PAID, and BIT). In some curves minor violations of the assumption of proportional hazards can be seen. For example, in Figure 6 it can be seen that that the lines of patients with low and high BIT scores cross. However, as we used discrete ordinal data in the Cox regression analyses rather than the categorized scores that are depicted in the Kaplan-Meier survival curves, we only used the Kaplan-Meier graphs as a first indication and the assumption of proportional hazards was further assessed with Schoenfeld residual plots (not depicted). The Schoenfeld residual tests were not significant and the plots did not reveal any major
15 2.5.3 Confounder analyses
A negative appraisal of insulin therapy has been found to be more common in people from an ethnic minority (35%) than people with a white ethnicity (22%), and more common in
women (31%) than in men (21%; Polonsky et al., 2005). Therefore we assessed whether ethnicity and gender were meaningful confounders in the examined associations. We also assessed whether age was a confounding variable, as age has previously been found to be a meaningful confounder in the association between depression and insulin initiation (Nefs et al., 2013). Variables that caused a change in the regression coefficient of at least ten percent were defined as meaningful confounders. We also assessed the unique association of each type of psychological distress on time to event by adjusting for the other types of
psychological distress (e.g., in the analyses of the association between depressive symptoms and insulin initiation delay, we adjusted for diabetes-specific distress and PIR). As
multicollinearity (high correlations among latent exogenous constructs; Grewal, Cote, & Baumgartner, 2004) can make it difficult to disentangle the influences of different variables and to obtain a good estimate of their separate effects, we first checked whether the
correlations between the three types of psychological distress were smaller than .80 before including them as potential confounders.
2.5.4 Missing data
16 3. Results
3.1 Participants
The present sample includes all SOUL-D participants of whom follow-up data were collected (N = 1335). No data were collected of the 455 SOUL-D participants who were registered with the 35 GP surgeries that did not take part in the follow-up. Participants in the follow-up did not differ significantly from participants who were not included in the follow-up on any of the background variables, except for medication status (Table 2). Participants who were not included in the follow-up were more likely to use diabetic medication at baseline (58.2%,
χ2 = 4.292, p < .05). Specifically, they were more likely to use OADs at baseline (58.2%, χ2 = 4.285, p < .05).
Table 2. Baseline Demographics.
N missing M SD % (valid) Demographics
Age 0 55.82 10.96
Female sex 0 45.4
Non-western ethnicity 12 50.7
Employed 1 47.5
Low education level Medical history
Diabetes duration (years) 3 .39 .17
HbA1C 92 53.25 16.17
Macrovascular disease 20 8.5
Microvascular disease 256 33.8
Diabetes medication
Taking diabetes medication 19 52.6*
OAD 21 52.6*
Insulin 8 3.5
Questionnaires
PHQ-9 39 4.40 5.23
PAID 135 10.86 15.03
BIT 141 64.61 20.59
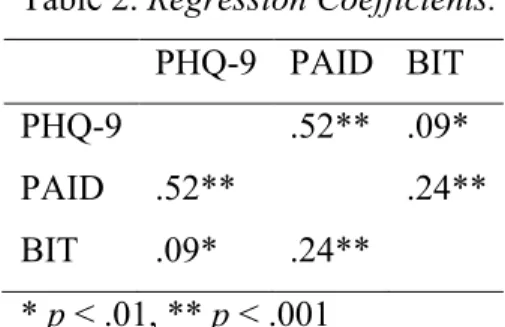
17 PHQ-9, PAID, and BIT scores were all significantly related to each other (Table 2). All regression coefficients had scores that were below .80, which indicates that there was no multicollinearity.
Table 2. Regression Coefficients.
PHQ-9 PAID BIT PHQ-9 .52** .09*
PAID .52** .24**
BIT .09* .24** * p < .01, ** p < .001
There were no follow-up data available for 21 patients. 237 patients switched GP and 42 patients deceased during the follow-up period (Table 2).
Table 2. Attrition.
Time in days
Cause N (%) M SD
Switched GP 237 (17.8) 879.41 536.68 Deceased 42 (3.1) 1149.24 608.95 Unknown 21 (1.6)
18 Table 3. Medication Status at Follow-up.
Type of medication n % (valid)
OAD 907 70.5
1 623 67.0
2 258 27.7
3 48 5.2
4 1 .1
Insulin 86 6.7
Combined with OAD 67 77.9 Previously on OAD 6 15.1
No OAD 13 7.0
3.3 Insulin requiring status
Data of all participants (N = 1335) were used to examine the association between psychological distress and time to becoming insulin requiring.
3.3.1 Kaplan-Meier
The mean time to becoming insulin requiring is depicted in Table 4. No difference was found in time to becoming insulin requiring between patients with low and high depressive
symptoms, χ2 (1) = .97, p = .33 (Figure 2). Diabetes-specific distress was related to time to becoming insulin requiring χ2 (1) = 4.98, p < .05. In Figure 3 it can be seen that patients with high diabetes-specific distress had a shorter time to becoming insulin requiring than patients with low distress. Table 4 depicts the mean scores of time to becoming insulin requiring.
Table 4. Time to Becoming Insulin Requiring in days.
M SD 95% CI
Lower Upper PHQ-9
Low (<10) 2282.43 20.10 2243.03 2321.82 High (≥10) 2190.45 51.03 2090.44 2290.47 PAID
19
Figure 2. Survival Curves PHQ-9 (Insulin Requiring Status).
Figure 3. Survival Curves PAID (Insulin Requiring Status).
3.3.2 Cox regression
The association between PHQ-9 score and time showed a non-significant positive trend (B = .028, HR = 1.03, 95% CI 1.00-1.06, p = .06). Sex and age were found to be meaningful confounders (Table 5). Adjusting for sex led to a significant association, but after further adjustment for age the effect remained non-significant.
Table 5. Change in Regression Coefficient for PHQ-9 after Adjustment for Potential Confounders (Insulin Requiring Status).
Potential confounder
PHQ-9
HR (95% CI) p B Change in B (%)
Age 1.02 (.99-1.05) .33 .015 -46.4
Sex 1.03 (1.00-1.06) .04 .031 10.7
Ethnicity 1.03 (1.00-1.06) .07 .026 7.1 Base model* 1.02 (.99-1.05) .23 .018 -35.7 Base model* + PAID 1.01 (.98-1.04) .60 .009 -50
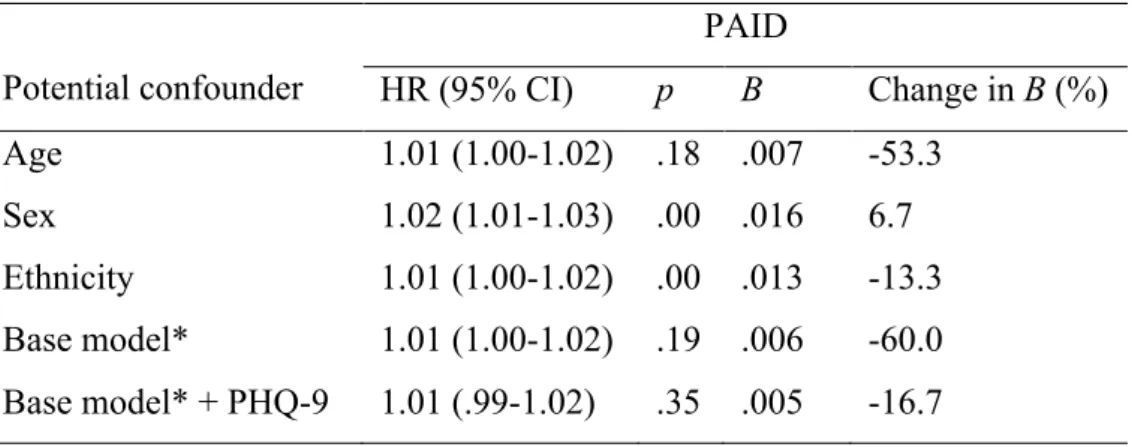
20 There was a significant positive association between PAID score and time to becoming insulin requiring (B = .015, HR = 1.02, 95% CI 1.01-1.02, p < .001), indicating that patients with higher diabetes-specific distress had a shorter time to becoming insulin requiring. Age and ethnicity were meaningful confounders (Table 6) and adjusting for these factors made the association non-significant. PHQ-9 was a meaningful confounder of the base model.
Table 6. Change in Regression Coefficient for PAID after Adjustment for Potential Confounders (Insulin Requiring Status).
Potential confounder
PAID
HR (95% CI) p B Change in B (%)
Age 1.01 (1.00-1.02) .18 .007 -53.3
Sex 1.02 (1.01-1.03) .00 .016 6.7
Ethnicity 1.01 (1.00-1.02) .00 .013 -13.3 Base model* 1.01 (1.00-1.02) .19 .006 -60.0 Base model* + PHQ-9 1.01 (.99-1.02) .35 .005 -16.7
* Adjusted for age and ethnicity.
3.3 Insulin initiation status
Data of patients who were either insulin requiring or on insulin therapy were used for the analyses (n = 219 after multiple imputation).
3.2.1 Kaplan-Meier
The median of the time to insulin initiation is depicted in Table 7. There was no significant difference in time to insulin initiation between patients with low and high depressive symptoms, χ2 (1) = .81, p = .37 (Figure 4), or patients with low and high diabetes-specific distress diabetes-specific distress, χ2 (1) = .05, p = .82 (Figure 5). There was also no
21 Table 7. Time to Insulin Initiation (in Days).
95% CI
Median SE Lower Upper PHQ-9
Low (<10) 1385.00 286.53 823.53 1946.60 High (≥10) 721.00 189.91 348.78 1093.22 PAID
Low (<41) 1385.00 319.09 759.59 2010.41 High (≥41) 1322.00 575.98 193.08 2450.9 BIT
Low (<78) 1567.00 500.42 586.18 2547.82 High (≥78) 1322.00 380.27 576.66 2067.34
Figure 4. Survival Curves PHQ-9 (Insulin Initiation Status).
22
Figure 6. Survival Curves BIT (Insulin Initiation Status).
3.2.2 Cox Regression
There was no association between PHQ-9 score and time to insulin initiation (B = .028, HR = 1.03, 95% CI .99-1.06, p = .11). Only PAID was a meaningful confounder (Table 8). The association remained non-significant after adjusting for this confounder.
Table 8. Change in Regression Coefficient for PHQ-9 after Adjustment for Potential Confounders (Insulin Initiation).
PHQ-9
HR (95% CI) p B Change in B (%) Age 1.03 (.99-1.06) .11 .027 -3.6
Sex 1.03 (.99-1.06) .11 .028 0 Ethnicity 1.03 (.99-1.06) .11 .027 -3.6 PAID 1.02 (.98-1.07) .29 -.022 -21.4 BIT 1.03 (1.00-1.06) .10 .028 0
23 adjusted for those variables. Both PHQ-9 and BIT scores were meaningful confounders, and correcting the base model for these confounders made the association non-significant.
Table 9. Change in Regression Coefficient for PAID after Adjustment for Potential Confounders (Insulin Initiation).
PAID
Potential confounder HR (95% CI) p B Change in B (%) Age 1.01 (1.00-1.02) .23 .007 -12.5
Sex 1.01 (1.01-1.02) .19 .008 0
Ethnicity 1.02 (1.01-1.03) .00 .019 50 Base model* 1.01 (1.00-1.03) .02 .013 62.5 Base model* + PHQ-9 1.01 (1.00-1.02) .18 .009 -30.7 Base model* + BIT 1.01 (1.00-1.02) .13 .010 -23.1
* Adjusted for age and ethnicity.
There was a non-signification trend between BIT score and time to insulin initiation (B = - .010, HR = .99, 95% CI .98-1.00, p = .07). Ethnicity was a meaningful confounder (Table 10). Correcting for this variable led to a negative trend that was almost significant. PAID score was a meaningful confounder of the base model, and adjusting for this led to a
significant association between BIT score and time to insulin initiation (Table 10), indicating that higher BIT scores were related to a longer time to insulin initiation.
Table 10. Change in Regression Coefficient for BIT after Adjustment for Potential Confounders (Insulin Initiation).
BIT
Potential confounder HR (95% CI) p B Change in B (%)
Age .99 (.98-1.00) .06 -.010 0
Sex .99 (.98-1.00) .07 -.010 0
24 4. Discussion
In the current study we assessed the association between psychological distress and insulin initiation in T2DM patients. Specifically, we looked at the association between psychological distress (depressive symptoms, and diabetes-specific distress) and insulin requiring status, and the association between psychological distress (depressive symptoms, diabetes-specific distress, and PIR) and insulin initiation delay in patients who were insulin requiring.
4.1 Insulin requiring status
A positive trend between depressive symptoms an insulin requiring status was found. This would indicate that patients who scored high on depressive symptoms shorty after diagnosis, would require insulin sooner than patients who scored lower. However, this trend was not significant and after adjusting for confounders the trend disappeared.
As previous research has shown that diabetes-specific distress is related to a worse glycemic control (Hayashino et al., 2012) we expected that diabetes-specific distress would be related to a shorter time to requiring insulin therapy. Our results provide support for this hypothesis, as the analyses revealed that diabetes-specific distress was associated with a shorter time to becoming insulin requiring. The finding that diabetes-specific distress, but not depressive symptoms, is related to a shorter time to becoming insulin requiring (indicating less good glycemic control) is in line with the findings by Fisher and colleagues (2007) who reported that diabetes-specific distress was a better predictor of diabetes self-care than depressive symptoms. However, adjusting for meaningful confounders made the association non-significant.
4.2 Insulin initiation delay
Depressive symptoms were not related to insulin initiation delay. Diabetes-specific distress was related to a shorter insulin initiation delay, but only when corrected for age and ethnicity. This is in contrast with our hypothesis, as we expected that diabetes-specific distress would be related to a longer delay. However, both depressive symptoms and PIR were found to be meaningful confounders and correcting for those confounders made the association non-significant.
25 shorter time to becoming insulin requiring as being insulin requiring can indicate worse control. Further research is needed to explore this association. If future studies would indeed confirm that diabetes-specific distress is related to a shorter time to becoming insulin
requiring, a possible explanation would be that patients with high psychological distress may visit their healthcare professionals more frequently, as previous research has indicated that T2DM patients with depressive symptoms appear to visit their physicians more often (Dzida, Karnieli, Svendsen, Sølje, & Hermanns, 2015). It is possible that this is also true for diabetes-specific distress. If patients get their HbA1c-values checked more frequently at their GP, it is likely that the topic of insulin initiation is mentioned more frequently by the GP, which could explain why those patients would start insulin therapy sooner.
Finally, we analyzed the association between PIR and insulin initiation delay. As predicted, PIR was associated with a longer delay in insulin initiation after adjusting for meaningful confounders. This indicates that patients with higher levels of PIR at baseline delayed insulin initiation for a longer time period. This shows that negative feelings regarding insulin treatment could predict a delay in insulin initiation. This result suggests that it might be beneficial to address negative insulin beliefs in patients with newly diagnosed T2DM. Further research should assess whether an intervention focused on decreasing negative insulin beliefs in these patients could indeed decrease insulin initiation delay.
4.3 Limitations and suggestions for further research
The current study has several limitations. First, the percentage of patients who were insulin requiring or on insulin was relatively low. As previous studies have found that insulin initiation is often delayed for up to five years (Nichols et al., 2007; Rubino et al., 2007; Ziemer et al., 2005) our follow-up period of three- to seven-years might have been too short. As the percentage of patients in our cohort who require insulin or who have initiated insulin therapy will increase with time, we suggest a second follow-up of this cohort after
approximately five years to get a more reliable indication of the association between psychological distress and insulin initiation.
26 helpful to apply for funding, so a monetary reward can be offered to the GP surgeries as an incentive to participate in the follow-up.
Third, the percentage of patients who switched from GP was high (17.8%). For these patients only the data were collected until their last visit at their initial GP surgery. For future follow-up studies it is suggested to try to contact these patients using the contact details that were provided at baseline, and collect their follow-up data at their new GP surgery.
Fourth, we only used patients’ baseline data as a measure of psychological distress. However, it is likely that patients’ levels of psychological distress have changed over time (e.g., some patients may have developed more depressive symptoms or diabetes specific-distress during the course of their diabetes). For most patients the questionnaires were repeated one and two years after the baseline study. By including those data in a future follow-up the mean scores of psychological distress in the first two years after diagnosis could be determined.
Fifth, collecting data from patients’ medical records gives a reliable indication of the status of their diabetes control, but it does not indicate if or when the GP has mentioned insulin therapy. According to the NICE (2015) guidelines a GP should do this after the HbA1c-value has been too high on two occasions, even though the patient is already on at least two types of OAD. However, we are not certain whether all GPs have actually followed these guidelines and suggested insulin therapy as soon as a patient became insulin requiring. Finally, we only analyzed the total scores on the questionnaires. With regard to depressive symptoms, the heterogeneity of subtypes and severity of depression (APA, 2000) could mean that there is an association between depressive symptoms and insulin initiation, but only when certain characteristics of depression are present (e.g., low self-esteem, Nefs et al., 2013). With regards to PIR, the BIT questionnaire consists of five subscales which represent different aspects of negative beliefs about insulin therapy (Petrak et al., 2007). Further analyses of the different subscales could result in a better understanding of association between the different aspects of PIR and insulin initiation.
4.4 Conclusions
28 References
Altman, D. G., & Bland, J. M. Time to event (survival) data. BMJ, 317, 468-469.
Anderson, R. J., Freedland, K. E., Clouse, R. E., & Lustman, P. J. (2001). The prevalence of comorbid depression in adults with diabetes: A meta-analysis. Diabetes Care, 24, 1069-1078.
APA. (2000). Diagnostic and Statistical Manual of Mental Disorders. (Fourth Edition, Text Revision ed.). Washington, DC: American Psychiatric Association.
Bland, J. M., & Altman, D. G. (2004). The logrank test. BMJ, 328, 1073.
Boughdady, M., Winkley, K., Amiel, S. & Ismail., K. (2014). Beliefs about insulin in people with newly diagnosed Type 2 diabetes: findings from the South London Diabetes Cohort (SOUL-D) study. Diabetic Medicine, 31(Suppl. 1), 152.
DiMatteo, M. R., Lepper, H. S., & Croghan, T. W. (2000). Depression is a risk factor for noncompliance with medical treatment: A meta-analysis of the effects of anxiety and depression on patient adherence. Archives of Internal Medicine, 160, 2101-2107. Dzida, G., Karnieli, E., Svendsen, A. L., Sølje, K. S., & Hermanns, N. (2015). Depressive
symptoms prior to and following insulin initiation in patients with type 2 diabetes mellitus: Prevalence, risk factors and effect on physician resource utilisation. Primary Care Diabetes, 9, 346-353.
Fisher, L., Skaff, M. M., Mullan, J. T., Arean, P., Mohr, D., Masharani, U., Glasgow, R., & Laurencin, G. (2007). Clinical depression versus distress among patients with type 2 diabetes: Not just a question of semantics. Diabetes Care, 30, 542-548.
Fisher, L., Mullan, J. T., Arean, P., Glasgow, R. E., Hessler, D., & Masharani, U. (2010). Diabetes distress but not clinical depression or depressive symptoms is associated with glycemic control in both cross-sectional and longitudinal analyses. Diabetes Care, 33, 23-28.
Fowler, G. C., & Vasudeva, D. A. (2010). Type 2 diabetes mellitus: managing hemoglobin A(1c) and beyond. Southern Medical Journal, 103, 911-916.
Fowler, M. J. (2008). Microvascular and macrovascular complications of diabetes. Clinical Diabetes, 26, 77-82.
Grewal, R., Cote, J. A., & Baumgartner, H. (2004). Multicollinearity and measurement error in structural equation models: Implications for theory testing. Marketing Science, 23,
519-529.
29 Differentiating symptoms of depression from diabetes-specific distress: relationships
with self-care in type 2 diabetes. Diabetologia, 51, 1822-1825.
Jager, K. J., van Dijk, P. C., Zoccali, C., & Dekker, F. W. (2008) The analysis of survival data: the Kaplan-Meier method. Kidney Inernetional, 74, 560-565.
Hayashino, Y., Okamura, S., Matsunaga, S., Tsujii, S., & Ishii, H. (2012). The association between Problem Areas in Diabetes Scale scores and glycemic control is modified by types of diabetes therapy: Diabetes Distress and Care Registry in Tenri (DDCRT 2).
Diabetes Research and Clinical Practice, 97, 405-410.
Hermanns, N., Mahr, M., Kulzer, B., Skovlund, S. E., & Haak, T. (2010). Barriers towards insulin therapy in type 2 diabetic patients: Results of an observational longitudinal study. Health and Quality of Life Outcomes, 8, 113.
HSCIC: National Diabetes Audit 2012/13: Report 1: Care Processes and Treatment Targets. Retrieved on 9 November 2015, from
http://www.hscic.gov.uk/searchcatalogue?productid=15512&q=%22National+diabete s+audit%22&sort=Relevance&size=10&page=2#top.
International Diabetes Federation. (2014). IDF diabetes atlas update poster (6th ed.). Brussels, Belgium: International Diabetes Federation.
Ismail, K., Winkley, K., Stahl, D., Chalder, T., & Edmonds, M. (2007). A cohort study of people with diabetes and their first foot ulcer: The role of depression on mortality.
Diabetes Care, 30, 1473-1479.
Khunti, K., Vora, J., & Davies, M. (2014). Results from the UK cohort of SOLVE: Providing insights into the timing of insulin initiation in people with poorly controlled type 2 diabetes in routine clinical practice. Primary Care Diabetes, 8, 57-63.
Kroenke, K., & Spitzer, R. L. (2002). The PHQ-9: A new depression diagnostic and severity measure. Psychiatric Annals, 32, 509-515.
Kroenke, K., Spitzer, R. L., & Williams, J. B. W. (2001). The PHQ-9: Validity of a brief depression severity measure. Journal of General Internal Medicine, 16, 606-613. Larkin, M. E., Capasso, V. A., Chen, C. L., Mahoney, E. K., Hazard, B., Cagliero, E., &
Nathan, D. M. (2008). Measuring psychological insulin resistance: Barriers to insulin use. Diabetes Educator, 34, 511-517.
30 Ligthart, S., van Herpt, T. T. W., Leening, M. J. G., Kavousi, M., Hofman, A., Stricker, B. H. C., … Dehghan, A. (2015) Lifetime risk of developing impaired glucose metabolism and eventual progression from prediabetes to type 2 diabetes: a prospective cohort study. The Lancet. Doi: 10.1016/S2213-8587(15)00362-9.
Lustman, P. J., Anderson, R. J., Freedland, K. E., de Groot, M., Carney, R. M., & Clouse, R. E. (2000). Depression and poor glycemic control: A meta-analytic review of the literature. Diabetes Care, 23, 934-942.
Makine, C., Karsidag, C., Kadioglu, P., Ilkova, H., Karsidag, K., Skovlund, S. E., . . . Pouwer, F. (2009). Symptoms of depression and diabetes-specific emotional distress are associated with a negative appraisal of insulin therapy in insulin-naive patients with Type 2 diabetes mellitus: A study from the European Depression in Diabetes [EDID] Research Consortium. Diabetic Medicine, 26, 28-33.
Miller, D. R., Safford, M. M., & Pogach, L. M. (2004). Who has diabetes? Best estimates of diabetes prevalence in the department of veterans affairs based on computerized patient data. Diabetes Care, 27, B10-B21.
Mollema, E. D., Snoek, F. J., Ader, H. J., Heine, R. J., & van der Ploeg, H. M. (2001). Insulin-treated diabetes patients with fear of self-injecting or fear of self-testing: Psychological comorbidity and general well-being. Journal of Psychosomatic Research, 51, 665-672.
Nathan, D. M., Buse, J. B., Davidson, M. B., Ferrannini, E., Holman, R. R., Sherwin, R., & Zinman, B. (2009). Medical management of hyperglycemia in type 2 diabetes: A consensus algorithm for the initiation and adjustment of therapy. A consensus
statement of the American Diabetes Association and the European Association for the Study of Diabetes. Diabetes Care, 32, 193-203.
NICE. (2015). Type 2 diabetes in adults: management of type 2 diabetes in adults. NICE guideline. Draft for consultation, January 2015. Retrieved April 21, 2015, from http://www.nice.org.uk/guidance/gid-cgwave0612/documents/type-2-diabetes-draft-nice-guideline2.
Nichols, G. A., Koo, Y. H., & Shah, S. N. (2007). Delay of insulin addition to oral
31 Nouwen, A., Winkley, K., Twisk, J., Lloyd, C. E., Peyrot, M., Ismail, K., . . . Consoritum, E.
R. (2010). Type 2 diabetes mellitus as a risk factor for the onset of depression: A systematic review and meta-analysis. Diabetologia, 53, 2480-2486.
Petrak, F., Stridde, E., Leverkus, F., Crispin, A. A., Forst, R., & Pfutzner, A. (2007).
Development and validation of a new measure to evaluate psychological resistance to insulin treatment. Diabetes Care, 30, 2199-2204.
Polonsky, W. H., Anderson, B. J., Lohrer, P. A., Welch, G., Jacobson, A. M., Aponte, J. E., & Schwartz, C. E. (1995). Assessment of diabetes-related distress. Diabetes Care, 18, 754-760.
Polonsky, W. H., Fisher, L., Guzman, S., Villa-Caballero, L., & Edelman, S. V. (2005). Psychological insulin resistance in patients with Type 2 diabetes: The scope of the problem. Diabetes Care, 28, 2543-2545.
Pouwer, F., Nefs, G., & Nouwen, A. (2013). Adverse effects of depression on glycemic control and health outcomes in people with diabetes: A review. Endocrinology and Metabolism Clinics of North America, 42, 529-544.
Richardson, L. K., Egede, L. E., Mueller, M., Echols, C. L., & Gebregziabher, M. (2008). Longitudinal effects of depression on glycemic control in veterans with type 2 diabetes. General Hospital Psychiatry, 30, 509-514.
Rubin, D. B. (1987). Multiple imputation for nonresponse in surveys. New York: Wiley. Rubino, A., McQuay, L. J., Gough, S. C., Kvasz, M., & Tennis, P. (2007). Delayed initiation
of subcutaneous insulin therapy after failure of oral glucose-lowering agents in patients with type 2 diabetes: A population-based analysis in the UK. Diabetic Medicine, 24, 1412-1418.
Stratton, I. M., Cull, C. A., Adler, A. I., Matthews, D. R., Neil, H. A., & Holman, R. R. (2006). Additive effects of glycaemia and blood pressure exposure on risk of complications in type 2 diabetes: A prospective observational study (UKPDS 75).
Diabetologia, 49, 1761-1769.
Sunaert, P., Willems, S., Feyen, L., Bastiaens, H., De Maeseneer, J., Jenkins, L., … De Sutter, A., (2014). Engaging GPs in insulin therapy initiation: A qualitative study evaluating a support program in the Belgian context. BMC Family Practice, 15, 144. Turner, R. (1998). Intensive blood-glucose control with sulphonylureas or insulin compared
32 UKPDS. (1995). U.K. prospective diabetes study 16: Overview of 6 years' therapy of type II
diabetes: A progressive disease. Diabetes, 44, 1249-1258.
Van Ginkel, J. R., & Kroonenberg, P. M. (2014). Analysis of variance of multiply imputed data. Multivariate Behavioral Research, 49, 78-91.
Winkley, K., Thomas, S. M., Sivaprasad, S., Chamley, M., Stahl, D., Ismail, K., & Amiel, S. A. (2013). The clinical characteristics at diagnosis of type 2 diabetes in a multi-ethnic population: The South London Diabetes cohort (SOUL-D). Diabetologia, 56, 1272-1281.