The Total Contribution of The Crown Estate 2011/12
Report on methodologies
Contents
Contents ... 2 Introduction ... 4 Background ... 4 Baseline data ... 5 Working principles ... 5 Credit ... 5 Confidence ... 6 Net contribution ... 6 Summary... 7 Data period ... 7General methodologies for Direct, Indirect and Enabled indicators 7 Direct ... 7
Indirect ... 8
Enabled ... 8
Economic Contribution ... 9
Best practice ... 9
Gross Value Added (GVA) ... 9
Direct GVA ... 9 Indirect GVA ... 10 Enabled GVA ... 11 Employment ... 11 Direct Employment ... 12 Indirect Employment ... 12 Enabled Employment ... 13
GVA per full-time employee (FTE) ... 14
Investment ... 14
Contribution to HM Treasury ... 16
Direct contribution to HM Treasury ... 16
Indirect contribution to HM Treasury... 17
Case Study: Regent Street and Quadrant 3 ... 20
Sustainability outcomes ... 20
Community Benefits ... 20
Individual ... 20
The State ... 21
Environmental Contribution ... 23
General methodologies for Direct, Indirect and Enabled environmental indicators ... 23
Direct Environmental Contribution ... 23
Indirect Environmental Contribution... 24
Enabled Environmental Contribution ... 24
Electricity Generation ... 24
Direct Electricity Generation ... 24
Indirect Electricity Generation... 25
Enabled Electricity Generation ... 25
Net Greenhouse Gas (GHG) Emissions ... 25
Direct Net Greenhouse Gas (GHG) Emissions ... 26
Indirect Net Greenhouse Gas (GHG) Emissions ... 27
Enabled Net Greenhouse Gas (GHG) Emissions ... 27
Greenhouse Gas Emissions (GHG) Produced ... 28
Direct Greenhouse Gas Emissions Produced ... 29
Enabled Greenhouse Gas Emissions Produced ... 30
Greenhouse Gas Emissions Sequestered ... 31
Direct CO2 Emissions Sequestered ... 31
Indirect CO2 Emissions Sequestered ... 32
Enabled CO2 Emissions Sequestered ... 32
Greenhouse Gas Emissions Avoided ... 32
Direct GHG Emissions Avoided ... 32
Indirect GHG Emissions Averted ... 33
Enabled GHG Emissions Avoided ... 33
Water Consumption ... 34
Direct Water Consumption ... 34
Indirect Water Consumption ... 35
Enabled Water Consumption... 35
Direct Waste ... 36
Indirect Waste ... 37
Enabled Waste ... 37
What this means ... 37
Case Study: Ormonde Wind Farm ... 39
Contributing to socio-economic prosperity ... 39
Promoting environmental sustainability ... 40
Protecting the health of British society ... 41
Minimizing social and environmental disruptions ... 42
Building resilient communities ... 42
Case Study: Glenlivet ... 43
Contributing to wealth and job creation in Scotland ... 43
Generating income and employment in remote communities ... 45
Enhancing the well-being of Scottish and British populations through recreational services ... 45
Pushing for climate change mitigation through sustainable forest management ... 45
Case Study: Windsor ... 47
Social Contribution ... 47
Impacts on recreational well-being (a “contingent valuation” perspective) ... 47
Appendix 1: ... 48
Enabled Economic Indicators – detailed methodologies ... 48
Urban ... 48
Rural and Coastal ... 49
Energy and Infrastructure ... 51
Windsor ... 53
Summary of estimated Enabled economic contribution ... 54
Appendix 2: ... 55
Comment on Section 106 contributions ... 55
Summary... 55
Background ... 55
Precedent in corporate reporting ... 56
Appendix 3: ... 58
Comment on social indicators ... 58
Regent Street and Quadrant 3 Case Study ... 58
Social outcomes for the individual ... 58
Other beneficiaries ... 59
Introduction
nef consulting is pleased to submit this report disclosing the methodologies behind Our Contribution - a report on The Crown
Estate’s Total Contribution to the UK.
The Crown Estate set itself an ambitious goal for the Total
Contribution report. This was first to express what it contributes to the UK overall – not just in terms of the net revenue it brings in, but in terms of its total ‘triple bottom line’ (economic, environmental and social).
In assessing its triple bottom line contribution, The Crown Estate wished to go further than simply tallying up its own direct impacts. It also wanted to identify the impacts brought about through its supply chain and by the different activities taking place on its portfolio. Although many of these activities are outside its immediate control, The Crown Estate often has an indirect or enabling influence over them and therefore could claim varying degrees of responsibility for them.
Background
nef consulting – the consultancy arm of nef (the new economics foundation) – draws on nef’s history over twenty-five years as an innovator in social, economic and environmental analysis and measurement. We put new economics into action: measuring and calculating impact; putting social value at the core of decision making; and helping public, private and third sector organisations to
understand the real value of what they do.
The Crown Estate commissioned nef consulting and partners, Landman Economics and Route2Sustainability, because our
approach to value and measurement aligned closely with what it was aiming to achieve with this report.
At the start of the research project The Crown Estate set up a steering group to guide the project as a whole and separate working groups for each of the three indicator sets – economic, social and environmental. nef consulting worked closely with each of these working groups to determine which key indicators would be included in the report; to establish appropriate processes and procedures for gathering internal data from a variety of sources within The Crown Estate; and to check the data and the collection approaches being used on a regular basis.
As part of this, nef consulting created a set of templates for collecting the required data for each indicator set and across The
The Crown Estate’s
vision is “to be the
UK's most
respected property
business because of
the way in which we
manage this
portfolio of assets
on behalf of the
nation.”
Crown Estate’s main business areas (Urban, Rural and Coastal, Energy and Infrastructure, and Windsor).
Once the data had been collected we used the following methodologies to calculate the required metrics.
Baseline data
The 2011/12 Our Contribution report is just the start of what will be an on-going project to identify and measure the broader contribution of The Crown Estate and ultimately integrate it into its annual reporting. One of the main goals of this year’s report was to review present data collection systems and introduce new systems where relevant. This has meant that the reporting in some areas has relied upon what might be termed ‘best available’ data. It has also meant that the data reported is intended to be the baseline for comparisons in future years. Significantly, this also means that we do not have historical data against which to compare this year’s results.
Working principles
To support the aim of being transparent about the impacts of the full range of activities across The Crown Estate and its supply chain, nef consulting has been working with the following core principles in mind:
Credit
To illustrate the spectrum of responsibility and credit desired in the Total Contribution report, we have calculated each indicator according to the following three levels of influence:
Direct contributions: activities carried out by The Crown Estate
Indirect contributions: activities commissioned by The Crown Estate but carried out within its supply chain
Enabled contributions: activities carried out on The Crown Estate’s portfolio by its customers
Beyond the calculation of Direct, Indirect and Enabled metrics across the economic, environmental and social indicators, there is a further, more subtle, distinction between influence and attribution that we may wish to examine more closely going forward. We have chosen, for the current report at least, not to try and determine the extent to which the impacts (both positive and negative) of customers and suppliers can be attributed to The Crown Estate’s actions. Looking ahead, however, when we will be able to compare any changes in impacts to this year’s baseline data, we might want to look in more detail at how far The Crown Estate has influenced these changes.
Confidence
It is not practical, or even possible in some cases, to capture first hand (primary) data for every indicator. We have therefore used recognised methodologies, models and academic research to estimate results where necessary. Throughout this document, we have indicated the source of each indicator and whether it is:
1) Primary data
2) An estimate based on direct measurement, subject to certain assumptions or models
3) An assessment based on estimated data, subject to certain assumptions or models
Since we did not consider it appropriate to imply a false accuracy to the measures that incorporated estimates, models and assumptions, we have used appropriate forms of rounding to express these
numbers and any others based on them. Net contribution
Although we aim to capture both positive and negative outcomes from the activities across The Crown Estate portfolio, and to report the resulting net contribution, in this first baseline report it has not always been possible. In this baseline report for 2011/12, as a general rule, we have focused primarily on positive economic and social impacts. It is standard practice to report on negative environmental impacts, such as greenhouse gas emissions, waste and resource (eg water) consumption and in this report we have also looked at positive environmental impacts such as CO2 sequestration.
We acknowledge that we have not been able to assemble robust evidence to document what we call the “counterfactual” (what would have happened anyway) or potential negative outcomes, such as what we term “displacement” (the impact one activity may have on another).
We have touched on the principle of ‘displacement’ in our case study of the Ormonde Wind Farm, where we consider the possible impact of the wind farm on other potential marine activities like fishing or tourism. In most cases, however, accounting for the counterfactual was not feasible. We could not, for instance, estimate how much offshore wind energy would have been produced on The Crown Estate’s portfolio ‘anyway’ (i.e. without The Crown Estate’s influence). This also links to the issues of credit, influence and attribution above. As we develop better systems to capture data we intend to explore more potential negative outcomes and provide a more balanced report on performance.
Summary
According to these principles, there is still a long way to go for before we are able to say we have covered all aspects of The Crown
Estate’s Total Contribution. However, we are confident that The Crown Estate is committed to this set of principles and that over the next few years our combined efforts will produce a robust
methodology for capturing it.
Data period
The data in this report relates to The Crown Estate’s 2011/12
financial year as shown in the table below. However, in some places, estimates and calculations have been made using data that falls outside this period. For example, the Glenlivet case study uses data from the 2010 visitor survey for some calculations, on the assumption that visitor behaviour does not change dramatically from year to year and because historically such surveys have not been conducted annually.
Main economic, environmental and social indicators
Data relates to the financial year 2011/12. It covers those indicators selected as material to the business of The Crown Estate and for which the data is available within this timescale. Case studies Windsor/Glenlivet – data runs from the
beginning of 2011/12 and runs into, and may be include the whole of, 2012/13 as necessary, to capture as much of the picture as possible.
Regent Street and Quadrant 3 – data relates to the time period covered by the construction project and the first months of operation.
Ormonde Wind Farm – data relates to the time period covered by the project.
General methodologies for Direct, Indirect and
Enabled indicators
Direct
Activities carried out by The Crown Estate itself
The Direct metrics relate to the impact of activities carried out in-house by The Crown Estate. Data is mostly available from The Crown Estate sources, such as the annual accounts, and calculations can be performed with a high degree of precision.
Indirect
Activities commissioned by The Crown Estate and carried out within its supply chain
The Indirect metrics relate to the impact of The Crown Estate’s supply chain expenditure. They are calculated by breaking down this
expenditure by sector/type and using this to estimate the impacts of The Crown Estate’s suppliers using appropriate ratios, from, for example, the Office of National Statistics (ONS) or Defra. We can generally say that there is a high degree of confidence in the supply chain expenditure data but some loss of precision occurs in the breakdown by sector.
The next step is to translate this expenditure into estimates of the impacts of the suppliers. The ratios used for this are widely accepted and from credible sources (the ONS / Defra) but rely on inbuilt assumptions that impacts of The Crown Estate’s suppliers are at the average level for their industry or sector. We therefore consider these values as estimates in which we can have a reasonable level of confidence.
Enabled
Activities carried out on The Crown Estate portfolio by customers The Enabled economic metrics relate to the impact of The Crown Estate’s customers. The initial basis for the calculation of these metrics is a breakdown of The Crown Estate’s customers by activity (eg agriculture, retail, offices). This means that the starting point for the calculations incorporates a degree of uncertainty, as we do not have perfect knowledge of customers’ activities. For example, in the calculation of enabled environmental impacts we may know that certain customers are involved in arable farming but not whether this is farming wheat, barley or sugar beet.
Based on the customer data we are then able to turn this into estimates of the impacts using similar ratios to those used for the indirect indicators (e.g. from the ONS or Defra). We therefore consider these values as estimates in which we can have a lower level of confidence.
Note
The calculation of The Crown Estate’s contribution does not include induced activities – i.e. activities in other areas of the economy arising as a consequence of ‘multiplier’ effects due to The Crown Estate’s economic activity – because of the difficulties of estimating induced effects with any precision.
Economic Contribution
Four different dimensions of The Crown Estate’s economic contribution were analysed:
Gross Value Added (Direct, Indirect and Enabled)
Employment (Direct, Indirect and Enabled)
Investment (Direct only)
Contribution to HM Treasury (Direct and Indirect)
In this section we present our detailed methodologies for calculating each of these measures.
Best practice
Where possible we have used methodologies to calculate the economic impact of The Crown Estate that may be considered to be “best practice” - based on two recent papers from the Office for National Statistics (ONS):
Measuring the economic impact of an intervention or investment – Paper One: Context & Rationale (referred to hereafter in this document as “ONS paper 1”
Measuring the economic impact of an intervention or investment – Paper Two: Existing Sources & Methods (referred to as “ONS paper 2”).
Both of these are available from: http://www.ons.gov.uk/ons/rel/regional-
analysis/measuring-the-economic-impact-of-an-intervention-or- investment/measuring-the-economic-impact-of-an-intervention-or-investment/index.html
Gross Value Added (GVA)
Direct GVAWhat this means
Direct GVA is defined as The Crown Estate’s turnover/income minus the cost of goods and services it buys in.
The value for 2011/12
Direct GVA = £311million
The data source(s) and calculation(s) we have used
The data required for this calculation is available from The Crown Estate’s accounts. First the value of turnover was calculated as
follows: revenue (£340.7m) + interest (£11.6m) plus joint venture income (£7.6m) = turnover (£359.9m), rounded up to £360m.
Total turnover minus supply chain costs or intermediate consumption (£49m) equals GVA: £311m
Data confidence
Direct GVA was calculated exactly using primary data.
Assumptions we have made
None
Indirect GVA
What this means
Indirect GVA is a measure of the impact of The Crown Estate’s supply chain expenditure. It is calculated by breaking down this expenditure by sector/type, and turning this into employment and productivity of suppliers using appropriate ratios from the ONS.
The value for 2011/12
Indirect GVA = £118m
The data source(s) and calculation(s) we have used
ONS paper 1 (Sections 4.3.2 and 4.4) suggests that methods for imputation of GVA vary according to the data available for the imputation. In this case, the best source of data available was The Crown Estate’s supplier database. For each supply transaction the supplier database has data on:
the size of the transaction;
the industrial classification (four digit SIC2007 code) of the supplier.
Calculation of indirect GVA proceeds in two stages:
The supplier database was used to sum the total value of transactions for each SIC2007 code, giving total value of supply chain activity by industry.
This total value data was then converted into Gross Value Added data. This was done by using data from the ONS’s Annual Business Survey (ABS) on output and GVA by 4-digit SIC2007code for 20111.
1 ONS’s Annual Business Survey data provides GVA by four-digit SIC and is based on a large-scale survey of businesses (The ONS “Blue Book”) gives a
Data confidence
We have estimated The Crown Estate’s indirect contribution based on the contributions of all the companies in The Crown Estate’s supply chain. This meant that it was not possible or practicable to gain primary data as this would have been extremely time consuming. We have therefore used the standard approach of estimatingGVA based on data on the industrial classification of each company in The Crown Estate’s supply chain, combined with industry-level data on GVA from the Office for National Statistics, as the next best option.
Assumptions we have made
The implicit assumption when using this methodology is that the SIC2007 codes in the supplied database adequately describe the activities undertaken by each business in The Crown Estate’s supply chain, and that the average value added by each business in the supply chain is equal to the average of all businesses classified under that particular SIC2007 code. These assumptions will not necessarily hold in practice, but they are likely to be a good first-order
approximation to reality and use the best available data. Enabled GVA
What this means
Enabled GVA is a measure of the economic value added by The Crown Estate’s customers.
The value for 2011/12
Enabled GVA for The Crown Estate is estimated at £4,804m.
The data source(s) and calculation(s) we have used
The GVA Enabled by The Crown Estate was calculated using
different methodologies for each of the component parts of the estate – Urban, Rural and Coastal, Energy and Infrastructure and Windsor. In some cases the estimation of Enabled GVA involves imputation procedures similar to those used for the calculation of Indirect GVA. In other cases, existing statistics from other sources (for example the British Marine Federation) were used.
Further details are provided in the appendices.
Employment
Employment is expressed as the number of full-time-equivalent (FTE) employees involved in The Crown Estate’s Direct, Indirect and
Enabled activities. Many employees and contractors, including those on The Crown Estate’s payroll and those working for suppliers, may
more accurate estimate of total UK GVA but only for one digit SIC, and so is not detailed enough to use here.
not be employed full-time in economic activity generated directly or indirectly by The Crown Estate or in activities enabled by The Crown Estate. This means that the actual number of people involved in The Crown Estate’s total activities is likely to be much larger than the FTE number.
Direct Employment
What this means
Direct employment is the number of people on The Crown Estate’s payroll, expressed as the number of full-time-equivalent (FTE) employees.
The value for 2011/12
Total average employment for 2011/12 was 428 FTE employees (to the nearest whole person).
The data source(s) and calculation(s) we have used
The Crown Estate’s Direct employment contribution consists of the number of FTE employees on The Crown Estate’s own payroll and was calculated straightforwardly from information held in The Crown Estate’s accounting systems.
Data confidence
Direct employment was calculated based on primary data and rounded up to the nearest number of full-time-equivalent (FTE) employees.
Assumptions we have made
None.
Indirect Employment
What this means
Indirect employment is the number of people in The Crown Estate’s supply chain (expressed as the number of FTE employees) who produce the goods and services that The Crown Estate uses,
In the case of Indirect activity in particular, it is likely that only a part of each person’s employment should be counted as part of The Crown Estate’s economic contribution. For example, a typical firm in The Crown Estate’s supply chain may supply hundreds of customers of which only one is The Crown Estate. Hence the FTE number of employees is a much more representative measure of employment activity than the “raw” number of employees involved in The Crown Estate’s economic “footprint”.
The value for 2011/12
The Crown Estate’s estimated Indirect employment contribution is 2,054 full-time equivalent employees.
The data source(s) and calculation(s) we have used
As with GVA, the methodology for estimating The Crown Estate’s Indirect employment contribution relies on imputation rather than an exact headcount of employees in the supply chain (due to the
difficulty in obtaining precise data on employment in companies in the supply chain). The methodology used follows on from the GVA
methodology and is fully consistent with it. Information on the number of employees within each four-digit SIC2007 code from the ONS’s Annual Business Survey is used to derive a “GVA per employee” measure for each SIC code. This measure is then used to estimate the number of employees used to produce the GVA calculated for each SIC code in the GVA calculation above.
Data confidence
There is a high degree of confidence in the supply chain expenditure data but some loss of precision occurs in the breakdown by sector.
Assumptions we have made
Again as with GVA, the approach used assumes that purchases can be accurately allocated to a given SIC2007 four-digit industrial
classification and that the average productivity of the labour employed by each business in the supply chain is equal to the average
productivity of all businesses classified under that particular SIC2007 code. These assumptions will not necessarily hold in practice, but they are likely to be a good first-order approximation to reality and use the best available data.
Enabled Employment
What this means
Enabled employment is the number of people working for The Crown Estate’s customers on its property, expressed as the number of full-time-equivalent (FTE) employees.
The value for 2011/12
The estimated Enabled employment contribution of The Crown Estate is 92,318 FTE employees.
The data source(s) and calculation(s) we have used
As with the calculations of enabled GVA, the methodology used for estimating the employment enabled by The Crown Estate varies according to which part of the estate is being analysed.
GVA per full-time employee (FTE)
Table 1 below gives estimates of GVA per FTE employee based on the Direct, Indirect and Enabled economic contribution of The Crown Estate.
Table 1: Estimated GVA per Full-Time Equivalent employee
Level of contribution Estimated GVA (£m) Estimated employment Estimated GVA/employee (£) As % of UK GVA Direct 311 428 726,636 0.02% Indirect 118 2,054 57,449 0.01% Enabled 4,804 92,318 52,038 0.32%
Investment
As well as measuring the Gross Value Added by The Crown Estate in its economic activities during 2011/12 we are also interested in The Crown Estate’s performance in managing and enhancing the value of its properties, land and other assets. We refer to this as the
investment component of The Crown Estate’s Direct economic
contribution.
Because of the difficulties involved in estimating an equivalent investment figure for The Crown Estate’s supply chain or its customers, we do not attempt to estimate an investment figure for The Crown Estate’s indirect or enabled contribution.
What this means
“Investment” is a term which has multiple meanings in economic analysis. For this report we are excluding external market conditions and defining investment as the increase in the value of The Crown Estate’s properties, land and other assets which is attributable to its activities in maintaining and improving the portfolios.
The value for 2011/12
The overall increase in the value of our assets held between April 2011 and April 2012 was £812 million, after accounting for the value of purchases (+£283m), and disposals (-£578m). This is made up of general market movements, net investment in our assets, and tactical asset management that we undertake to enhance the value of our assets.
Our total return (being our capital growth, net capital receipts and net income as a percentage of capital employed) was 16.8% for the year ended 31 March 2012. This compared favourably to our industry wide bespoke benchmark2 of 9.5% as illustrated by Figure 2 below.
Figure 2: Return on Investment compared with industry benchmark
The data source(s) and calculation(s) we have used
Figure 2 shows how the investment component of The Crown Estate’s Direct economic contribution is calculated, using data from The Crown Estate’s accounts 2011/12, and also data on the
investment performance of properties under management by The Crown Estate compared with the Investment Property Databank (IPD) benchmark.
2
Data confidence
Direct investment was calculated exactly using primary data.
Contribution to HM Treasury
Direct contribution to HM Treasury
What this means
As a result of its unique constitution, governed by The Crown Estate Act 1961, The Crown Estate has a commercial mandate to enhance the value its portfolio and optimise the returns from its assets through good management. Any surplus made as a result of The Crown Estate’s operations is paid directly to HM Treasury.
However on top of this, like any other business The Crown Estate contributes to the Treasury through payments of employee income tax, employee and employer National Insurance Contributions (NICs), stamp duty land tax, Value Added Tax (VAT) and other taxes.
The value for 2011/12
Total gross Direct contribution to HM Treasury in 2011/12 was £377 million, broken down as shown in Figure 3 below.
Figure 3: Direct Treasury contribution (gross), £ million
The data source(s) and calculation(s) we have used
The Direct contribution of The Crown Estate to HM Treasury was calculated as a sum of the following for 2011/12: payment of The Crown Estate’s operating surplus to HM Treasury
taxes paid by employees of The Crown Estate:
income tax
employee National Insurance contributions
taxes paid by The Crown Estate:
employer National Insurance contributions
VAT
stamp duty land tax
other taxes (e.g. Landfill Tax, Climate Change Levy, etc.)
Data confidence
The Direct contribution to HM Treasury was calculated exactly using primary data.
Assumptions we have made
The Crown Estate’s Section 106 contributions have not been considered as a tax for the purposes of the calculation of the contribution to HM Treasury.
Further details of the approach taken to Section 106 contributions are provided in the appendices.
Indirect contribution to HM Treasury
What this means
The Crown Estate’s Indirect contribution to HM Treasury is the sum of the Value Added Tax (VAT), PAYE income tax and employee and employer National Insurance Contributions (NICs) of its supply chain.
The value for 2011/12
The total estimated Indirect contribution to HM Treasury as a result of The Crown Estate’s supply chain is as follows:
Table 2: Indirect contribution to HM Treasury
VAT payments £49.3 million
Income tax + NICs £16.3 million
The data source(s) and calculation(s) we have used
1) VAT
The Crown Estate’s supply chain pays VAT to HMRC as a result of its service to The Crown Estate. Because some VAT charged to The Crown Estate by its suppliers cannot be reclaimed as input tax from HMRC, the figure reclaimed by The Crown Estate on its VAT returns is likely to be the best estimate, rather than the exact value, of the net VAT generated by and paid to HMRC by The Crown Estate’s supply chain. This sum amounted to £49.3 million during the year to 31 March 2012.
2) PAYE income tax and national insurance
Such a direct method of calculation as that used for VAT is not possible in the case of the PAYE and national insurance (both employer’s and employee's) paid within The Crown Estate’s supply chain. Nor does The Crown Estate have any right to request this information from its suppliers. The result is that informed estimates of the likely tax sums paid by The Crown Estate’s supply chain have to be made.
To estimate the income tax and national insurance contribution (NICs) payments made by and on behalf of workers employed by businesses in TCE’s supply chain, we have used a two-stage process:
Estimate total labour costs (including gross wages plus employer NICs) as a share of indirect GVA using data from the ONS’s Annual Business Survey on labour costs and GVA for each four-digit SIC2007 code and combining this with the SIC2007 breakdown of the supplier database;
Use information from the 2012 Budget on total income tax (£155 billion) and National Insurance Contributions (£106 billion), and compare this with data from the ONS’s National Accounts (2012 Blue Book) on overall labour costs (£842 billion). This gives a figure of 31% for income tax plus NICs payments as a share of labour costs.
Data confidence
As with the Indirect GVA and employment calculations, an imputation methodology has been used for The Crown Estate’s Indirect
contribution to HM Treasury3.
3
To avoid terminological confusion here through the use of the adjective “indirect”, we should make clear that the “indirect Treasury contribution” of
Assumptions we have made
Again, we assume that purchases can be accurately allocated to a given SIC2007 four-digit industrial classification and that PAYE income tax and national insurance payments of The Crown Estate’s supply chain can be imputed from the ratios of labour costs to GVA in a given SIC code. These assumptions will not necessarily hold in practice, but they are likely to be a good first-order approximation to reality and use the best available data.
The Crown Estate is the contribution of taxes from companies that supply The Crown Estate (and their employees) rather than indirect taxes (such as VAT) paid by The Crown Estate – which are included in its direct Treasury contribution.
Case Study: Regent Street and
Quadrant 3
Sustainability outcomes
Data for the environmental outcomes was derived from the 2012 Quadrant 3 Fact Sheet, provided by Sir Robert McAlpine.
Community Benefits
Note that the figures calculated for the benefits to the individual and to the State from employment gained via the Workplace Co-ordinator through the Recruit West End programme are not included in the calculation of the Total Contribution elsewhere in this report as they result as part of the planning process for Quadrant 3.
Individual
What this means
The economic value of changes in financial situation of those who gained employment via the Workplace Co-ordinator has been calculated as the difference between typical salary and estimated benefits and tax credits received by the unemployed individual.
The value for 2011/12
In total, for all 118 individuals that have gained employment the scheme is estimated to have created a net financial benefit of
£539,000.
The data source(s) and calculation(s) we have used
Each individual is estimated to be £4,564 better off annually as a consequence of gaining employment through the programme. This is calculated, based on the assumptions below, by deducting the average benefits received per individual of £4,300 per year from the average net salary of £8,865 per annum. £4,565 x 118 = £538,670, rounded to £539,000.
Data confidence
These figures are an assessment based on the following assumptions:
Assumptions we have made
In the absence of demographic profiling of those that gained employment through the programme, the typical individual is assumed to be:
Living alone and renting privately at a cost of £400/month
Paying £608.46/year in Council Tax
Using these assumptions to calculate benefits using GOV.UK’s online Benefits Calculator, it can be seen that the individual would be eligible for £71.00 per week Jobseekers Allowance and £11.71 of Council Tax Benefit per year. This gives a total benefits received of £4,300 per year.
In terms of employment gained, it is assumed that these 118 individuals will be entering full-time retail positions. The Office for National Statistics Annual Survey of Hours and Earnings 2012 calculates the median annual full-time salary of sales and retail assistants to be £9,313.
The taxes and National Insurance (NI) contributions liable for
payment by this individual are £242 and £207 respectively. This gives a net salary of £8,865 per annum.
The State
What this means
There is an additional economic value to the State that is derived from the changes in financial situation of those who gained employment via the Workplace Co-ordinator programme. For the programme’s contribution to central Government, the figure is calculated from the difference between benefits paid to an individual while they are unemployed, and the taxes gained once an individual has found employment.
The value for 2011/12
The Government benefits economically by a total of £4,778/year per individual, £563,804 for all 118 individuals gaining employment.
The data source(s) and calculation(s) we have used
As calculated above, the benefits and tax credits assumed to be paid to an individual on the Recruit West End programme is £4,300/year. The tax and National Insurance payments gained by central
Government by an individual in a typical retail position in London is £448/year (tax of £241.60 and NI contributions of £206.52), as outlined above.
Therefore, the Government benefits economically by a total of £4,748/year per individual, £560,264 for all 118 individuals gaining employment.
Data confidence
As above.
Assumptions we have made
Environmental Contribution
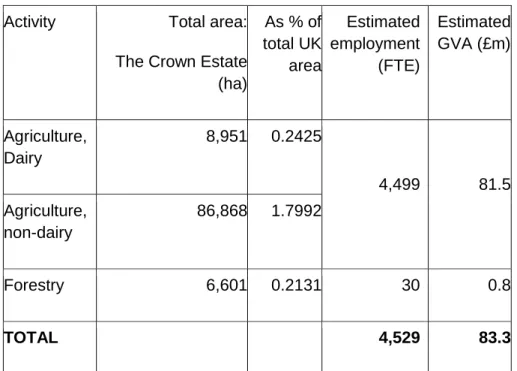
This section details The Crown Estate’s contribution to the UK’s environmental performance. Where available data has allowed, this contribution has been calculated for Direct, Indirect (supply chain) and Enabled activities – in total The Crown Estate’s ‘value chain’. The following seven Key Environmental Performance Indicators [KEPIs] were analysed:
1. Electricity Generation: MWh (Direct and Enabled)
2. Net Greenhouse Gas (GHG) Emissions: tonnes CO2e (Direct, Indirect and Enabled)
3. Greenhouse Gas Emissions Produced: tonnes CO2e (Direct, Indirect and Enabled)
4. Greenhouse Gas Emissions Avoided: tonnes CO2e (Direct and Enabled)
5. Greenhouse Gas Emissions Sequestered: tonnes CO2 (Direct and Enabled)
6. Water Consumption: m3 (Direct, Indirect and Enabled) 7. Waste: tonnes (Direct, Indirect and Enabled)
General methodologies for Direct, Indirect and
Enabled environmental indicators
Direct Environmental Contribution
Data for the Direct contribution for the following four KEPIs was gathered directly from The Crown Estate: electricity generation; total greenhouse gas emissions; water consumption; and solid waste. We estimated the total CO2 emissions avoided and sequestered and used these data to estimate net Direct CO2 emissions.
Indirect Environmental Contribution
Data for the Indirect contribution for the following three KEPIs was quantified through extended input-output analysis (EIOA): total greenhouse gas emissions; water consumption; and solid waste. EIOA requires extension of the UK published input-output tables (via UK ONS) to capture each industry sector’s environmental
performance. Expenditures provided by The Crown Estate are first reclassified and then relevant sector environmental intensities (via EIOA) applied.
Enabled Environmental Contribution
Data for the Enabled contribution to electricity generation was based on primary data provided by The Crown Estate. The Enabled
contributions to greenhouse gas emissions (released, avoided and sequestered), water consumption and waste generation were all based on broad ‘activity data.’
Electricity Generation
Electricity generation concerns generation from renewable sources / technologies.
Direct Electricity Generation
What this means
From a Direct point of view The Crown Estate generated electricity via solar PV array(s).
The value for 2011/12
In 2012/12, The Crown Estate directly generated 0.132 MWh of renewable electricity.
The data source(s) and calculation(s) we have used
Primary data was provided by The Crown Estate’s sustainability team.
Data confidence
Direct electricity generation was calculated exactly.
Assumptions we have made
Indirect Electricity Generation N/A
Enabled Electricity Generation
What this means
Enabled electricity generation is that generated on leased land (onshore wind plus solar PV arrays) and leased sea bed (offshore wind). Although The Crown Estate is active in all forms of renewable energy (ie. wind, solar, wave, tidal, hydro and biomass) only wind turbines (offshore and onshore) and solar PV were ‘active’ for the 2011/12 reporting year.
The value for 2011/12
In 2011/12, The Crown Estate Enabled 5,790,125 MWh of renewable electricity to be generated.
The data source(s) and calculation(s) we have used
The value reported was based on primary data disclosed by The Crown Estate.
Data confidence
Enabled electricity generation was calculated exactly.
Assumptions we have made
None
Net Greenhouse Gas (GHG) Emissions
“Net greenhouse gas emissions” refers to greenhouse emissions produced less those avoided via renewable electricity generation activities and those sequestered through forest cover.
Direct Net Greenhouse Gas (GHG) Emissions
What this means
The calculation of Direct net greenhouse gas emissions considers greenhouse gas emissions produced directly by The Crown Estate less emissions sequestered via forests managed by The Crown Estate and those avoided via the very small amount of renewable energy generated produced by solar PV on its urban portfolio.
The value for 2011/12
Direct net emissions were -33,783 tCO2e. This means that more emissions were sequestered or avoided through forestry and
renewable electricity generation than produced from Direct activities on The Crown Estate. Another way of saying this is that The Crown Estate can be considered “carbon positive” for its Direct net
emissions.
The data source(s) and calculation(s) we have used
The value reported was based on primary data disclosed by The Crown Estate.
Data confidence
Direct net greenhouse gas emissions were calculated exactly by subtracting emissions sequestered and avoided from emissions produced.
Assumptions we have made
The assumptions used in the calculations of emissions produced, sequestered and avoided also apply to the calculation of net greenhouse gas emissions.
Indirect Net Greenhouse Gas (GHG) Emissions
What this means
Indirect net greenhouse gas emissions is the same as Indirect
greenhouse gas emissions produced because we have not calculated emissions sequestered or averted through The Crown Estate’s supply chain activities. (Undoubtedly some of The Crown Estate’s suppliers were generating electricity via renewable technologies and managing forests. However, the quantities of greenhouse gases avoided and sequestered are beyond stable remote estimation methods and would require a detailed supplier survey which is beyond the scope of this baseline report.)
The value for 2011/12
Through Indirect activity of The Crown Estate’s supply chain in 2011/12, 63,457 tCO2 net emissions were produced.
The data source(s) and calculation(s) we have used
In the case of the supply chain, data was not available for
sequestered and averted emissions so the net Indirect emissions figures are the same as the total Indirect greenhouse gas emissions. Enabled Net Greenhouse Gas (GHG) Emissions
What this means
The Enabled net greenhouse gas emissions calculation refers to Enabled emissions produced less those sequestered CO2 via forestry managed by The Crown Estate’s tenants, less avoided greenhouse emissions via renewable electricity generation on leased land (onshore wind plus solar PV arrays) and leased sea bed (offshore wind).
The value for 2011/12
Enabled net emissions were -3,963,138 tCO2e. This means that more emissions were sequestered or avoided by The Crown Estate’s tenants through forestry and renewable energy than produced from Enabled activities on The Crown Estate.
The data source(s) and calculation(s) we have used
The value reported was based on primary data disclosed by The Crown Estate.
Data confidence
Enabled net greenhouse gas emissions were calculated exactly by subtracting emissions sequestered and avoided from emissions produced.
Assumptions we have made
The assumptions used in the calculations of emissions produced, sequestered and avoided also apply to the calculation of net greenhouse gas emissions.
Greenhouse Gas Emissions (GHG) Produced
The Greenhouse Gas Protocol sets out clearly defined standards for corporate reporting of GHG emissions produced. It is worth clarifying how the terminology used in the GHG Protocol compares with the terminology of the Direct, Indirect and Enabled contribution of The Crown Estate used in the total contribution report.The GHG Protocol 4 defines direct and indirect emissions as follows:
Direct GHG emissions are emissions from sources that are owned or controlled by the reporting entity.
Indirect GHG emissions are emissions that are a
consequence of the activities of the reporting entity, but occur at sources owned or controlled by another entity.
The GHG Protocol further categorizes these direct and indirect emissions into three broad scopes:
Scope 1: All direct GHG emissions.
Scope 2: Indirect GHG emissions from consumption of purchased electricity, heat or steam.
Scope 3: Other indirect emissions, such as those emanating ‘upstream’ from the extraction and production of purchased materials and fuels; transport-related activities in vehicles not owned or controlled by the reporting entity and those
emanating ‘downstream’ from transportation and distribution, end of life treatment of sold products and importantly, in the context of The Crown Estate, leased assets.
Ref: http://www.ghgprotocol.org/files/ghgp/public/scopes_diagram.pdf Therefore, although employing slightly different terminology (to clearly distinguish between upstream and downstream emissions), The Crown Estate’s reporting boundaries are entirely consistent with the GHG protocol.
Direct Greenhouse Gas Emissions Produced
What this means
The GHG Protocol defines Direct GHG emissions as emissions from sources that are owned or controlled by the reporting entity.
The value for 2011/12
Direct greenhouse gas emissions of The Crown Estate in 2011/12 were 3,727 tonnes CO2e.
The data source(s) and calculation(s) we have used
Primary data for Direct Greenhouse Gas emissions were provided by The Crown Estate’s sustainability team.
Data confidence
Direct greenhouse gas emissions were calculated exactly.
Assumptions we have made
We have assumed that The Crown Estate follows ‘best practice’ and that Direct emissions equates to Scope 1 of the Greenhouse Gas Reporting Protocol, as described above.
Indirect Greenhouse Gas Emissions Produced
What this means
Indirect GHG emissions are those that are a consequence of the activities of The Crown Estate’s supply chain in producing the goods and services purchased.
The value for 2011/12
Indirect greenhouse gas emissions of The Crown Estate in 2011/12 were 63,457 tonnes CO2e.
The data source(s) and calculation(s) we have used
Indirect greenhouse gas emissions were estimated using an
extended input-output (EIO) model. The Crown Estate’s expenditures were classified according to the EIO model sector classification and respective indirect environmental performance intensities applied.
Data confidence
Conventional input-output models are published by the UK Office of National Statistics (ONS). The conventional model is extended so that each constituent industry sector’s performance for a number of
environmental factors is quantified. The extended model is then subject to standard input-output calculations that result in each constituent industry sector’s supply chain environmental performance intensities.
Assumptions we have made
Extended input-output modelling and analysis is increasingly commonplace. The approach is outlined in The UK Government’s Department for Environment & Rural Affairs (Defra) 2012 Guidelines to Defra / DECC’s “GHG Conversion Factors for Company Reporting: Methodology Paper for Emission Factors.”
Enabled Greenhouse Gas Emissions Produced
What this means
Enabled greenhouse gas emissions refer to the greenhouse gas emissions of customers of The Crown Estate. In the terms of the GHG Protocol, Enabled emissions would be included within the “downstream” element of Scope 3 emissions.
The value for 2011/12
Enabled greenhouse gas emissions of The Crown Estate in 2011/12 were 1,034,409 tonnes CO2e.
The data source(s) and calculation(s) we have used
Enabled emissions were calculated for leased property (for office, retail and residential purposes) and leased land (for agricultural purposes). Emissions from leased property were calculated using emissions factors derived from actual performance data collected by the Chartered Institute of Building Services Engineers (CIBSE). Accordingly on average 0.08 tonnes of CO2e are emitted per m2 of property. Emissions from agricultural activities were calculated using emissions factors published by the Food Climate Research Network (FCRN). Accordingly, 6.1 tonnes of CO2e are emitted per hectare of arable land and 12.4 tonnes of CO2e are emitted per hectare of grazing land.
Data confidence
Our assessment of Enabled greenhouse gas emissions is based on estimated data concerning land use and subject to models using the emissions factors noted above.
Assumptions we have made
With regard to leased property emissions, due to the various energy types and use patterns of the leased property tenants being unknown, best practice emission factors (as provided by Defra) cannot be applied. That said, the method employed is in our opinion robust due to the large data set collected by CIBSE. With regard to leased land emissions, given the specific agricultural activities are unknown (eg. the types of crops produced) again best practice of crop specific emission factors cannot be applied.
Greenhouse Gas Emissions Sequestered
Direct CO2 Emissions SequesteredWhat this means
Direct sequestered CO2 emissions refer to the CO2 uptake (through photosynthesis) by the forests owned and managed by The Crown Estate.
The value for 2011/12
Direct CO2 emissions sequestered of The Crown Estate in 2011/12 were 37,509 tonnes CO2e.
The data source(s) and calculation(s) we have used
The sequestration factors applied to The Crown Estate’s forest cover were derived from The Crown Estate’s “Potential carbon
sequestration within the Crown Estate’s Forestry Portfolio” report, prepared by the Edinburgh Centre for Carbon Management.
Accordingly, the average annual CO2 uptake factor was estimated to be 4.67 tonnes CO2 / hectare.
Data confidence
Our assessment of Direct greenhouse gas emissions sequestered is based on estimated data concerning land use and subject to models using the sequestration factors noted above.
Assumptions we have made
We have based on our calculations on what we believe to be the best available data for the land use estimates and the sequestration factors.
Indirect CO2 Emissions Sequestered
N/A
Enabled CO2 Emissions Sequestered What this means
Direct sequestered CO2 emissions refer to the CO2 uptake (through photosynthesis) by the forests owned by The Crown Estate and leased to its customers.
The value for 2011/12
Enabled CO2 emissions sequestered of The Crown Estate in 2011/12 were 18,040 tonnes CO2e.
The data source(s) and calculation(s) we have used
The sequestration factors applied to The Crown Estate’s leased forest cover were exactly the same as those employed for Direct
sequestration.
Data confidence
As with the Direct values, our assessment of Enabled greenhouse gas emissions sequestered is based on estimated data concerning land use and subject to models using the sequestration factors noted above.
Assumptions we have made
We have based our calculations on what we believe to be the best available data for the land use estimates and the sequestration factors.
Greenhouse Gas Emissions Avoided
Direct GHG Emissions AvoidedWhat this means
Direct greenhouse gas emissions avoided refers to those prevented through the Direct generation of electricity from renewable sources (in this case through solar PV on the urban portfolio only).
The value for 2011/12
Direct greenhouse gas emissions avoided by The Crown Estate in 2011/12 were 0.114 tonnes CO2e.
The data source(s) and calculation(s) we have used
According to the British Wind Association 0.00086 tonnes of CO2e are avoided for every 1 kWh of renewable electricity generation. This factor was applied to the 0.132 MWh of Direct renewable electricity generated by The Crown Estate in 2011/12.
Data confidence
Direct greenhouse gas emissions avoided were estimated using a measure of renewable energy generated and a conversion factor from reliable sources.
Assumptions we have made
We have based on our calculations on what we believe to be the best available data for the land use estimates and the sequestration factors.
Indirect GHG Emissions Averted N/A
Enabled GHG Emissions Avoided
What this means
Enabled greenhouse gas emissions avoided refers to those prevented through the Enabled generation of electricity from renewable sources (e.g. wind turbines, solar PV arrays etc.).
The value for 2011/12
Enabled greenhouse gas emissions avoided by The Crown Estate in 2011/12 were 4,979,508 tonnes CO2e.
The data source(s) and calculation(s) we have used
According to the British Wind Association 0.00086 tonnes of CO2e are avoided for every 1 kWh of renewable electricity generation. This factor is applied to the 5,790,125 MWh of Enabled renewable electricity generated across The Crown Estate in 2011/12.
Data confidence
Enabled greenhouse gas emissions avoided were estimated using a measure of renewable energy generated and a conversion factor from reliable sources.
Assumptions we have made
We have based on our calculations on what we believe to be the best available data for the land use estimates and the sequestration factors.
Water Consumption
Direct Water ConsumptionWhat this means
Water consumption comprises Direct supplied water (via water utility companies) plus abstracted water (via ground water wells and surface water tributaries & pumps directly managed by The Crown Estate).
The value for 2011/12
Direct water consumption by The Crown Estate in 2011/12 was 403,261 m3.
The data source(s) and calculation(s) we have used
The Direct supplied and abstracted water data was provided by The Crown Estate’s sustainability team.
Data confidence
Direct water consumption was calculated exactly.
Assumptions we have made
Indirect Water Consumption
What this means
Indirect water consumption is water that is used as a consequence of the activities of The Crown Estate’s supply chain in producing the goods and services purchased.
The value for 2011/12
Indirect water consumption of The Crown Estate in 2011/12 was 827,217 m3.
The data source(s) and calculation(s) we have used
Conventional input-output models are published by the UK Office of National Statistics (ONS). The conventional model is extended so that each constituent industry sector’s performance for a number of
environmental factors is quantified. The extended model is then subject to standard input-output calculations that result in each constituent industry sector’s supply chain environmental performance intensities.
Data confidence
Indirect water consumption data were estimated using an extended input-output (EIO) model as with the Indirect greenhouse gas emissions.
Assumptions we have made
Extended input-output modelling and associated analysis is increasingly commonplace. The approach is deployed by Water Footprint Network (WFN) for their indirect calculations. WFN is the leading organisation for understanding industry water dependencies. Enabled Water Consumption
What this means
Enabled water consumption comprises water supplied (via water utility companies) plus abstracted water (via ground water wells and surface water tributaries & pumps) to customers of The Crown Estate.
The value for 2011/12
Enabled water consumption by The Crown Estate in 2011/12 was 6,729,367m3.
The data source(s) and calculation(s) we have used
Enabled water consumption data was calculated for leased property (office, retail, residential) and leased land (for agricultural purposes). Water consumption of leased properties was based on The Crown Estate’s disclosure concerning the water consumption of the properties they directly manage.
Knowing the percentage of the total property portfolio directly managed, the approximation for the non-managed portion is straightforward. Calculating water consumption of leased land required first estimating the agricultural yields via application of yield factors provided by Defra; for example, 7 tonnes of cereals / hectare. Subsequently water consumption factors published by the Water Footprint Network (WFN) were applied to yields. For example, according to the WFN, cereals require 1.65 m3 / tonne, horticultural products require 30.13 M3 / tonne, grazing (for meat) requires 84.39 m3 / tonne and grazing (for milk) requires 24.17 m3 / tonne.
Data confidence
Our assessment of Enabled water consumption is based on
estimated data concerning land use and subject to models using the consumption factors noted above.
Assumptions we have made
With regard to leased property, more information concerning the activities of the tenants is required before activity specific water factors can be researched and then applied. Similarly greater understanding of the agricultural activities on the leased land is required before crop specific water factors can be applied. That said, the using WFN water factors (whether general or specific) is
increasingly seen as best practice.
Waste
Direct Waste
What this means
Direct waste generation comprises non-hazardous waste plus hazardous waste plus mining waste (e.g. overburden).
The value for 2011/12
The Direct waste produced by The Crown Estate in 2011/12 was 341 tonnes.
The data source(s) and calculation(s) we have used
Primary data for Direct waste was provided by The Crown Estate’s sustainability team.
Data confidence
Direct waste produced was calculated exactly.
Assumptions we have made
Indirect Waste
What this means
Indirect waste is waste that is generated as a consequence of the activities of The Crown Estate’s supply chain in producing the goods and services purchased.
The value for 2011/12
The Indirect waste produced by The Crown Estate in 2011/12 was 94,314 tonnes.
The data source(s) and calculation(s) we have used
Indirect waste data was estimated using an extended input-output [EIO] model as with the net greenhouse gas emissions and water consumption.
Data confidence
Indirect waste data were estimated, as with the Indirect greenhouse gas emissions and Indirect water consumption.
Assumptions we have made
Extended input-output modelling and associated analysis is
increasingly commonplace and is, in our opinion, best practice for this type of measurement.
Enabled Waste
What this means
Enabled waste generation consumption data was calculated for leased property (office, retail, residential) and leased land and seabed (for mining purposes).
The value for 2011/12
The Enabled waste produced by The Crown Estate in 2011/12 was 522,589 tonnes.
The data source(s) and calculation(s) we have used
Waste generation of leased properties was based on The Crown Estate’s disclosure concerning the waste generation of the properties they directly manage. Knowing the percentage of the total property portfolio directly managed approximation for the non-managed portion is straightforward. Calculating waste generation of extractive activities (mining, quarrying and dredging) required first estimating the
resource yields via disclosure from The Crown Estate. Subsequently resource specific extractive waste factors published by the British Geological Survey [BGS] and US Geological Survey’s [USGS] Material Flows Analysis [MFA] were applied to the yields. For example, according to the BGS, the average extractive waste ratios for Sandstone, Limestone, Igneous Rock and Sand & Gravel are 11%, 11.1%, 11.2% and 11.2% respectively.
Data confidence
Enabled waste data were estimated as with the Enabled greenhouse gas emissions and Enabled water consumption.
Assumptions we have made
With regard to leased property more information concerning the activities of the tenants is required before activity specific waste factors can be researched and then applied. Similarly, greater
understanding of the mining activities on the leased land and sea bed is required before more refined factors can be applied. That said, extractive waste factors are frequently employed to estimate the hidden flows of extractive activities.
Case Study: Ormonde Wind Farm
The Crown Estate not only seeks to contribute to the United Kingdom’s socio-economic prosperity; it also aspires to be a key driver of environmental sustainability and energy security in the UK. To this end it is a leading advocate of renewable energy investments. The Ormonde Offshore Wind farm (OWF) for instance, an investment of £500 million, is not only contributing to British Gross Value Added GVA and employment. It is also (a) enhancing environmentalsustainability by avoiding the emissions of pollutants to the atmosphere, (b) preventing adverse health impacts produced by conventional energy generation and (c) contributing to energy
security of the UK. With a capacity of 150MW the Ormonde OWF will generate clean energy equivalent to the annual electricity
consumption of roughly 105,000 homes – thus reducing UK dependence on costly energy imports5.
Contributing to socio-economic prosperity
During its construction phase, we estimate that the Ormonde project contributed to a direct creation of 835 jobs6. Using multipliers from a Scottish Enterprise study, "Scottish Offshore Wind - Creating an Industry," we calculate that an additional 651 jobs were created via indirect and induced impacts7. The total number of jobs attributed to the construction phase of the project is therefore estimated to be 1,486 spread across a three year period. £500 million was invested for building the wind farm, with 32% of capital expenditures flowing directly to UK businesses.
Table 3: Total contribution during construction phase
GVA (£ million) Employment
Direct n/a 835
5This figure assumes a capacity factor of 38% as estimated in the
Environmental Impact Assessment of the Ormonde Wind Farm, based upon the British Wind Energy Association methodology.
6
Ref:
http://www.vattenfall.co.uk/en/ormonde-inauguration/file/120919_ormonde_press_pack.pdf_22363140.pdf
7 We have taken the average of an upper bound estimate of 1.93 and a lower bound
estimate of 1.63 for the multiplier and taken the midpoint of the two as the central estimate, giving a total multiplier effect of 1.78 for direct + indirect + induced. This leads to total induced + indirect employment of (0.78 x 835) = 651.3.
Indirect and induced
n/a 651
Total n/a 1,486
Throughout its operational phase, the Ormonde OWF will directly support 40 jobs, of which 28 are locally contracted. The indirect and induced employment impact is estimated to be 33.7 full time
equivalent jobs. In total, the Ormonde OWF will contribute to a total creation of 73.7 FTE jobs.
Table 4: Total expected contribution during operational phase (per annum)
GVA (£ million) Employment
Direct 12.73 40
Indirect and induced 10.28 33.7
Total per annum 23.56 73.7
Promoting environmental sustainability
When evaluating the impacts of energy investments it is critical not only to analyse the emissions attributable to this investment and operation, but also the emissions which would have been emitted in an alternative scenario: i.e. if the same amount of energy was
produced through another energy source. In this case, the alternative scenario would have been energy generation from conventional energy sources, for instance a UK coal power plant.
We estimated that if the same amount of energy was to be produced by a coal power station, then an additional 429,415 tonnes of CO2 per year would have been released in the
atmosphere. This saving is directly attributable to the operation of OWF and is based on the methodology used by the British Wind Energy association and Environmental Impact Assessment (EIA). Typical emissions from a coal power plant are assumed to be of 860 grammes of CO2 per kWh. In order to derive savings in emissions throughout the operational phase we calculated the capacity in kWh
or MWh of the Ormonde wind-farm by multiplying: 1) the rated capacity (150 MW) of the OWF; 2) the capacity factor (38%) of time during which the OWF operated at full capacity thus reflecting the intermittent nature of wind power; and 3) the number of hours (8,760) in a year. We thus obtained total (average) MWh capacity then multiplied by CO2 emissions which would have been emitted to produce the same amount of energy through a coal power-plant.
Protecting the health of British society
Both Sulphur Dioxide (SO2) and Nitrogen Oxide (NOx) emissions are prominent sources of air pollution and have numerous adverse impacts on societal health conditions. Beyond direct health costs, both chemical compounds also contribute to the formation of Particulate Matter (notably PM10 and PM25), thus exacerbating health risks. The UK authorities are aiming to significantly curb both SO2 and NOx emissions.
For producing the same amount of energy, it is estimated that a typical coal power station would emit an additional 4,993 tonnes of sulphur dioxide (SO2) and 1498.5 tonnes of Nitrogen Oxides (NOx) emissions per year. Put differently, these avoided emissions
constitute a positive impact of this project in reducing air pollution and health risks to the UK population.
DEFRA has provided estimates of the costs borne by the British economy and society as a consequence of these pollutants. Each ton of SO2 emissions is estimated to generate a health cost of £1,633 while each ton of NOx emissions generates a health cost of £955. In total, we thus estimate that the health benefits (“avoided health costs”) generated by the Ormonde project are equivalent to £9.5 million per year.
Table 5: Total expected SO2 and NOx emissions saved per annum Emissions saved (tons) Estimated unit social cost of emissions (£/ton) Total value created (£million) Emissions valuation sources Sulphur Dioxide (SO2) 4,993 1,633 8.1 DEFRA (2010)
Nitrogen oxides
(NOx) 1,499 955 1.4 DEFRA (2010)
Minimizing social and environmental disruptions
Despite substantial benefits, offshore wind farms can also induce costs on local communities and ecosystems (particularly marine life). These need to be contrasted with the listed benefits. Most common adverse impacts include: (a) negative socio-economic impacts on local communities through tourism revenue reduction; (b) reduction in aesthetic quality (measured through aesthetic values ofcommunities); (c) impacts on birds; (d) impacts on fishes and marine mammals (and thus on local fish catch revenue). There are two instruments of mitigation of these potential impacts: (1) either through careful site selection or (2) through technology.
Careful site selection: The site selected is of relatively low ecological value. For example, the bird population of the area has been assessed to be low. It is also situated within 10km offshore which minimizes potential visual disturbance and
aesthetics values, particularly relative to other nearby offshore wind farms – situated much closer to the shoreline (eg. 4km).
Technology and planning: In order to reduce potential loss of fishing income, for instance, wind turbines have been designed to be evenly spaced in row, thus ensuring that it will be possible to trawl within the wind farm area.
Overall, the impact assessment did not point to a significant adverse impact on either tourism or marine mammals. On the one hand, numerous studies provide evidence that offshore wind farms can both repel and attract visitors; one the other hand, impacts on marine mammals are still scientifically contentious: depending on the academic study, the impacts can range from totally insignificant to changes of behavioural patterns of both fishes and mammals.
Building resilient communities
Although a precise quantification of local impacts is impossible to this date (due to lack of available data), a substantial amount of
operations and maintenance budget will be spent within local
communities, if and when possible. In particular, the Ormonde project will employ 28 locally contracted technicians for maintenance and