WESTMORELAND COUNTY,
VIRGINIA
AND INCORPORATED AREAS
COMMUNITY COMMUNITY NAME NUMBER
COLONIAL BEACH, TOWN OF 510172 *MONTROSS, TOWN OF 510116 WESTMORELAND COUNTY
(UNINCORPORATED AREAS) 510250 *No Special Flood Hazard Areas Identified
Westmoreland County
FLOOD INSURANCE STUDY NUMBER 51193CV000B
Federal Emergency Management Agency
FLOOD
INSURANCE
STUDY
REVISED: PRELIMINARY SEPTEMBER 12, 2013NOTICE TO
FLOOD INSURANCE STUDY USERS
Communities participating in the National Flood Insurance Program have established repositories of flood hazard data for floodplain management and flood insurance purposes. This Flood Insurance Study (FIS) may not contain all data available within the repository. It is advisable to contact the community repository for any additional data.
Part or all of this FIS may be revised and republished at any time. In addition, part of this FIS may be revised by the Letter of Map Revision process, which does not involve republication or redistribution of the FIS. It is, therefore, the responsibility of the user to consult with community officials and to check the community repository to obtain the most current FIS components.
Initial Countywide FIS Effective Date: August 18, 2009
Revised Countywide FIS Effective Dates: TBD - to incorporate new detailed coastal flood hazard analyses and to reflect updated topographic information
i
TABLE OF CONTENTS
Page
1.0 INTRODUCTION 1
1.1 Purpose of Study 1
1.2 Authority and Acknowledgments 1
1.3 Coordination 3
2.0 AREA STUDIED 4
2.1 Scope of Study 4
2.2 Community Description 5
2.3 Principal Flood Problems 7
2.4 Flood Protection Measures 10
3.0 ENGINEERING METHODS 10
3.1 Hydrologic Analyses 10
3.2 Hydraulic Analyses 12
3.3 Coastal Analyses 13
3.4 Vertical Datum 22
4.0 FLOODPLAIN MANAGEMENT APPLICATIONS 23
4.1 Floodplain Boundaries 23
5.0 INSURANCE APPLICATIONS 24
6.0 FLOOD INSURANCE RATE MAP 25
7.0 OTHER STUDIES 25
8.0 LOCATION OF DATA 26
ii
TABLE OF CONTENTS – continued
Page
FIGURES
Figure 1 – Transect Location Map 18
Figure 2 – Transect Schematic 22
TABLES
Table 1 – Initial and Final CCO Meetings 4
Table 2 – Summary of Coastal Stillwater Elevations 15
Table 3 – Transect Data 19-21
Table 4 – Community Map History 27
EXHIBITS
Exhibit 1 - Flood Insurance Rate Map Index Flood Insurance Rate Map
1
FLOOD INSURANCE STUDY
WESTMORELAND COUNTY, VIRGINIA AND INCORPORATED AREAS
1.0 INTRODUCTION
1.1 Purpose of Study
This countywide Flood Insurance Study (FIS) revises and updates previous FIS’s / Flood Insurance Rate Maps (FIRMs) in the geographic area of Westmoreland County, Virginia, including the Town of Colonial Beach, the Town of Montross and the unincorporated areas of Westmoreland County (referred to collectively herein as Westmoreland County).
This FIS aids in the administration of the National Flood Insurance Act of 1968 and the Flood Disaster Protection Act of 1973. This FIS has developed flood-risk data for various areas of the community that will be used to establish actuarial flood insurance rates. This information will also be used by Westmoreland County to update existing floodplain regulations as part of the Regular Phase of the National Flood Insurance Program (NFIP), and will also be used by local and regional planners to further promote sound land use and floodplain development. Minimum floodplain management requirements for participation in the NFIP are set forth in the Code of Federal Regulations at 44 CFR, 60.3.
Please note that on the effective date of this study, the Town of Montross has no mapped Special Flood Hazard Areas (SFHAs). This does not preclude future determinations of SFHAs that could be necessitated by changed conditions affecting the community (i.e. annexation of new lands) or the availability of new scientific or technical data about flood hazards. In some states or communities, floodplain management criteria or regulations may exist that are more restrictive or comprehensive than the minimum Federal requirements. In such cases, the more restrictive criteria take precedence, and the State (or other jurisdictional agency) shall be able to explain them.
1.2 Authority and Acknowledgments
The sources of authority for this FIS are the National Flood Insurance Act of 1968 and the Flood Disaster Protection Act of 1973.
This FIS was prepared to include the unincorporated areas of, and incorporated communities within, Westmoreland County in a countywide format FIS. Information on the authority and acknowledgments for each jurisdiction included in this countywide FIS, as compiled from their previously printed FIS reports, is shown below.
2 Colonial Beach, Town
of:
The hydrologic and hydraulic analyses for this study were prepared by the Norfolk District of the U. S. Army Corps of Engineers (USACE) for the Federal Emergency Management Agency (FEMA), under Inter-Agency Agreement
EMW-84-E-1506, Project Order No. 1, Amendment No. 22. This work was
completed in January 1986.
Westmoreland County (Unincorporated Areas):
The hydrologic and hydraulic analyses for this study were prepared by the Norfolk District of the U. S. Army Corps of Engineers (COE) for the Federal Emergency Management Agency (FEMA), under Inter-Agency Agreement
EMW-84-E-1 506, Project Order No. 1, Amendment No. 22. This work was completed in March 1986.
For the August 18, 2009 countywide FIS, no revised hydrologic and hydraulic analyses were prepared.
The Digital Flood Insurance Rate Map (DFIRM) conversion for the August 18, 2009 study was performed by AMEC, Earth & Environmental, Inc. for FEMA, under Contract No. HSFE03-07-D-0030, Task Order HSFE03-07-J-0002.
For this revision, coastal wave height analysis along Potomac River and Rappahannock River were prepared by Risk Assessment Mapping and Planning Partners (RAMPP) for FEMA under contract No.HSFEHQ-09-D-0369, task order HSFE03-11-J-0007. This work was completed in August 2013.
For the August 18, 2009 countywide study, planimetric base map information is provided in digital format for all FIRM panels. These files were compiled at scales of 6000 and 12000 from aerial photography dated 2003. Additional information was derived from transportation and hydrographic line features provided by the Westmoreland County. Users of this FIRM should be aware that minor adjustments may have been made to specific base map features.
For this revision, base map files were obtained in digital spatial data format from the Commonwealth of Virginia and Westmoreland County. Road centerlines were provided by Westmoreland County. Political boundary was downloaded from the U.S. Census Bureau Boundary and Annexation Survey from 2012. Digital orthophotographs were provided
3
by the Virginia Geographic Network Division of its Department of Technology Planning (VGIN). Adjustments were made to specific base map features to align them to 1”=200’ and 1”=400’ scale VGIN orthophotos.
For the August 18, 2009 countywide study, the coordinate system used for the production of this FIRM is Universal Transverse Mercator (UTM), Zone 18 North, North American Datum of 1983 (NAD 83), GRS 80 spheroid. Corner coordinates shown on the FIRM are in latitude and longitude referenced to the UTM projection, NAD 83.
For this revision, the projection used in the preparation of this map was State Plane Virginia North FIPS 4501. The horizontal datum was North America Datum 1983 (NAD 83), Geodetic Reference System 1980 (GRS 80) spheroid. Differences in datum, spheroid, projection, or UTM zones used in the production of FIRMs for adjacent jurisdictions may result in slight positional differences in map features across jurisdictional boundaries. These differences do not affect the accuracy of this FIRM.
1.3 Coordination
An initial Consultation and Coordination Officer’s (CCO) meeting is held typically with representatives of Federal Emergency Management Agency (FEMA), the community, and the study contractor to explain the nature and purpose of a FIS and to identify the streams to be studied by detailed methods. A final CCO meeting is held typically with representatives of FEMA, the community, and the study contractor to review the results of the study.
On February 1, 1984, an initial CCO meeting was held with representatives of FEMA, the county, the Virginia State Water Control Board, and the USACE (the study contractor). At this meeting, the nature and purpose of the study and the scope and limits of work were explained, and flood information currently available concerning the county was obtained.
Contacts with various State and Federal agencies were made during the study in order to minimize possible hydrologic and hydraulic conflicts. A search for basic data was made at all levels of government.
On November 6, 1986, the results of the study were reviewed at a final CCO meeting attended by representatives of FEMA, the county, the Virginia State Water Control Board, and the study contractor.
For the Town of Colonial Beach, an initial CCO meeting was held on February 1, 1984, with representatives of FEMA, the town, the Virginia State Water Control Board, and the USACE (the study contractor). At this meeting, the nature and purpose of the study and the scope and limits of
4
work were explained, and flood information currently available concerning the community was obtained.
Contacts with various State and Federal agencies were made during the study in order to minimize possible hydrologic and hydraulic conflicts. A search for basic data was made at all levels of government.
On November 5, 1986, the results of the study were reviewed at a final CCO meeting attended by representatives of FEMA, the town, the Virginia State Water Control Board, and the study contractor.
The dates of the initial and final CCO meetings held for the incorporated communities within the boundaries of Westmoreland County are shown in the following tabulation:
TABLE 1 – INITIAL AND FINAL CCO MEETINGS
Community Name Initial CCO Date Final CCO Date
Colonial Beach, Town of February 1, 1984 November 5, 1986
Montross, Town of None None
Westmoreland County (Unincorporated Areas)
February 1, 1984 November 6, 1986
For the August 18, 2009 countywide study, Westmoreland County and the Towns of Colonial Beach and Montross were notified by letter dated November 30, 2007 that the FIS would be updated and converted to countywide format.
For this revision, the initial CCO meeting was held on February 2, 2012, and attended by representatives of FEMA, USACE, Westmoreland County, Virginia Department of Conservation and Recreation (DCR), and RAMPP. On July 29, 2013, the Flood Risk Review meeting was held and attended by representatives of FEMA, Westmoreland County, and RAMPP. The final CCO meeting was held on _____________.
2.0 AREA STUDIED
2.1 Scope of Study
This FIS covers the geographic area of Westmoreland County, Virginia, including the Towns of Colonial Beach and Montross.
Tidal flooding including its wave action from the Potomac River, the Rappanhannock River, and their adjoining estuaries was studied by detailed methods. The areas studied by detailed methods were selected
5
with priority given to all known flood hazard areas and areas of projected development and proposed construction.
For the Town of Colonial Beach, tidal flooding including its wave action from the Potomac River, Monroe Bay, and their adjoining estuaries was studied by detailed methods. The areas studied by detailed methods were selected with priority given to all known flood hazard areas and areas of projected development and proposed construction.
The following flooding sources were studied by approximate methods: portions of Rosier Creek, Monroe Creek, Mattox Creek, Popes Creek, Currioman Creek, Mount Pleasant Branch, Jackson Creek, Owl Hollow, Troy Creek, Peedee Creek, Mill Swamp, Brockenbrough Creek, Pierce Creek, Nomini Creek, Bonum Creek, Kinsale Branch, Hampton Hall Branch, and Bridges Creek, Fox Hall Swamp, Bundys Swamp, Potomac Mills Pond, Gravel Run, Canal Swamp, Thomas Branch, Potter Branch, The Big Swamp, Marriner Run, Kenna Swamp, Black Swamp, Bryant Swamp, Nancy Sanford Swamp, Bumbers Creek, Old Mill Branch, Horners Pond, Smith Mount Branch, Waverly Branch, Smoots Mill Run, Omohundra Mill Pond, Pantico Run, Sisson Run, Ruin Branch, Chandlers Mill Run, Chandlers Mill Pond, Poorhouse Swamp, Weavers Mill Pond, Templeman Run, Marshall Creek, Antioch Branch, Beales Millpond, Buena Vista Branch, Newtons Mill Run, Tavern Run, Oldham Run, Thompson Millpond, Muddy Run, Webb Run, Marshy Swamp, Newtons Pond, Line Creek, Drakes Marsh, Bristol Mine Run, Flamstead Hill Swamp, and Hogans Millpond. Approximate analyses were used to study those areas having a low development potential or minimal flood hazards. The scope and methods of study were proposed to, and agreed upon by, FEMA and Westmoreland County.
This revision includes 63 miles of new coastal analyses for the Potomac River, Rappahannock River, and their estuaries in Westmoreland County. The scope of the study included establishing the frequency-peak elevation relationships for coastal flooding sources and preparing flood hazard mapping in Westmoreland County.
2.2 Community Description
Westmoreland County lies in the Northern Neck, which is the ancient name for the narrow peninsula between the Rappahannock River and the Potomac River. It is bordered by the unincorporated areas of Charles County and St. Mary's County, Maryland, and the Potomac River to the north and northeast; the unincorporated areas of Northumberland County to the southeast; the unincorporated areas of Richmond County and the Rappahannock River to the south; and the unincorporated areas of King George and Essex Counties to the west. The county has 236 square miles of land area. The population for Westmoreland County as determined by the 2010 Census is 17,454, an increase of 4.4% (Reference 1).
6
Westmoreland County was formed in 1653 from Northumberland County and named for the county of Westmoreland in England. People began moving into the area around 1640. The first courthouse was built in 1653 on Nomini Creek but was moved to Montross in 1673, where the county seat is today. The present courthouse is the third at its location and was built in 1817 (Reference 2).
Westmoreland is a historic county and many of the county's founding families contributed leaders to our nation. "Wakefield," a reconstruction of the original home that was destroyed in 1779, is the birthplace of George Washington, the first President of the United States. Stratford Hall is the Lee's family home, who contributed such leaders as Richard Henry Lee, Francis Lightfoot Lee, and Confederate General Robert E. Lee. James Monroe, the fifth President of the United States, was born at "Monrovia," near Colonial Beach. There are many other places of historic significance in Westmoreland County. Yeocomico Church was built in 1706 to replace a frame building erected in 1655. Leedstown on the Rappahannock was a busy colonial port where the "Leedstown Resolves" were drawn up in 1766 by Richard Henry Lee. This protest against the Stamp Act was the first formal declaration of principles that were incorporated into the Declaration of Independence ten years later (Reference 2).
Farming is the most important industry in the county, with the largest part of farm income drawn from field crops such as soybeans, wheat, and corn. Poultry, livestock, and vegetables provide other sources of farm income. There is some manufacturing within the county, producing a variety of products that include canned tomatoes, canned and frozen seafood, lumber, millwork, boats, concrete products, and soft drinks. There are also several seafood packing houses. The abundance of fish, oysters, and crabs in Westmoreland waters provides opportunities for both commercial and sport fishing (Reference 2). The floodplains of Westmoreland County consist of scattered residential structures, summer cottages, small businesses, croplands, and forests. With the county's many miles of shoreline, there will be pressure for future development in the floodplains. Westmoreland County enjoys a temperate climate with moderate seasonal changes characterized by warm summers and cool winters. Temperatures average approximately 78 degrees Fahrenheit (°F) during July, the warmest month, and 38°F in January, the coolest month. Annual precipitation over the area averages approximately 40 inches (Reference 2). There is some variation in the monthly averages; however, this rainfall is distributed uniformly throughout the year. Annual snowfall averages approximately 10 inches, generally occurring in light amounts and usually melting in a short period of time.
Westmoreland County is located in the Coastal Plain province and is underlain by sand, gravel, clay, and marl strata. Land elevations within this area range from sea level to approximately 190 feet.
7
The Town of Colonial Beach lies on the west bank of the Potomac River, approximately 69 miles downstream from Washington, D. C., and approximately 40 miles upstream from the Chesapeake Bay. It is bordered by the unincorporated areas of Westmoreland County, Virginia, to the east, south, and west; and the unincorporated areas of Charles County, Maryland, to the north. Monroe Bay lies on the western boundary, and the Potomac River lies on the eastern boundary. The Potomac River is approximately 4 miles wide opposite the town, and the waterfront is exposed to a 25 mile fetch to the southeast. The town has 1.6 square miles of land area with approximately 7 miles of shoreline. The 1980 population of the town was 2,474 (Reference 2). The population of the Town of Colonial Beach has increased to 3,542 according to the 2010 Census (Reference 1).
Development in the floodplains of Colonial Beach consists of residences, business, and marinas. The town is primarily waterfront resort offering a sandy beach, a boardwalk, an amusement park, a fishing pier, and motels. The economy is based primarily on servicing the recreational trade. The town's harbor has accommodations for recreational boating, both for transient and permanent berthing.
Colonial Beach is located in the Coastal Plain province and is underlain by sand, gravel, clay, and marl strata. The terrain of the area is generally flat with no unusual features. The southern half of the community is situated on a peninsula between the Potomac River and Monroe Bay. The peninsula extends approximately 1.6 miles above Gum Bar Point, located at the southern tip of the town. Land elevations within this area range from 0 to approximately 25 feet.
2.3 Principal Flood Problems
The coastal areas of Westmoreland County are vulnerable to tidal flooding from major storms such as hurricanes and northeasters. Both types of storms produce winds that push large volumes of water against the shore. With their high winds and heavy rainfall, hurricanes are the most severe storms that can hit the study area. The term hurricane is applied to an intense cyclonic storm originating in tropical or subtropical latitudes in the Atlantic Ocean north of the equator. While hurricanes may affect the area from May through November, nearly 80 percent occur in the months of August, September, and October, with approximately 40 percent occurring in September. The most severe hurricane to strike the county occurred in August 1933.
Another type of storm that could cause severe damage to the county is the northeaster. This is also a cyclonic type of storm and originates with little or no warning along the middle and northern Atlantic coast. These storms occur most frequently in the winter months but can occur at any time.
8
Accompanying winds are not of hurricane force but are persistent, causing above-normal tides for long periods of time.
The amount and extent of damage caused by any tidal flood will depend on the topography of the area flooded, the rate of rise of floodwaters, the depth and duration of flooding, the exposure to wave action, and the extent to which structures have been placed in the floodplain. The depth of flooding during these storms depends on the velocity, direction, and duration of the wind; the size and depth of the body of water over which the wind is acting; and the astronomical tide. The duration of flooding depends on the duration of tide-producing forces. Floods caused by hurricanes are usually of much shorter duration than those caused by northeasters. Flooding from hurricanes rarely lasts more than one tidal cycle, while flooding from northeasters can last several days, during which the most severe flooding takes place at the time of the peak astronomical tide.
The timing or coincidence of the maximum storm surge with the normal high tide is an important factor in the consideration of flooding from tidal sources. The mean range of tide in the Potomac River varies from approximately 1.3 feet at Lynch Point (Yeocomico River) to 1.5 feet in Nomini Bay to 1.7 feet at Colonial Beach. The mean range of tide in the Rappahannock River in the vicinity of Leedstown is approximately 1.5 feet (Reference 3). Prolonged easterly or southeasterly winds tend to raise the water level in the rivers, while prolonged northwest winds tend to depress the water level.
All development in the floodplain is subject to water damage. Some areas, depending on exposure, are subject to high velocity wave action that can cause structural damage and severe erosion along beaches. Waves are generated by the action of wind on the surface of the water. The Potomac River shoreline of Westmoreland County is vulnerable to wave damage. The entire eastern shoreline of Colonial Beach is vulnerable to wave damage due to the vast exposure afforded by the Potomac River.
Westmoreland County has experienced major storms since the early settlement of the area. Historical accounts of severe storms in the area date back several hundred years. Numerous storms of tropical origin have passed over and near the lower reaches of the Potomac and Rappahannock Rivers causing widespread damage. Although the hurricanes are very destructive, the winds are generally reduced below hurricane velocity as they pass through the area. The following paragraphs discuss some of the larger known floods that have occurred in recent history.
The August 23, 1933, hurricane was the most destructive for this area as well as for the remainder of the Chesapeake Bay region. The track of this storm passed approximately 6 miles east of Colonial Beach. The storm tide from this hurricane coincided with the astronomical tide and caused a
9
total rise of 8.0 feet above mean low water in the Potomac River (Reference 4).
On October 15, 1954, Hurricane Hazel caused severe damage to Westmoreland County. The storm passed approximately 40 miles to the west of Colonial Beach, causing sustained winds from the southeast. These winds, passing over the 25 mile fetch of the Potomac River, caused tides of 6.2 feet above mean low water and 6 foot waves (Reference 4). During 1955, two hurricanes affected the Westmoreland County area. On August 12-13, 1955, Hurricane Connie followed a path similar to the August 1933 hurricane. The storm passed approximately 30 miles to the east of Colonial Beach and generated a fairly high storm surge. The surge occurred at the time of the astronomical low tide in this area, causing only minor damage. On August 17-18, 1955, Hurricane Diane passed inland 50 miles to the west of Colonial Beach and did not produce a damaging tide. In November 1985, high winds and tides combined to play havoc with the Potomac River shoreline in the worst storm in decades. The storm was a product of a low pressure system that swept up the Atlantic Seaboard. Northeast winds in excess of 65 miles per hour (mph) pushed tides 5 feet above normal and battered piers, bulkheads, boathouses, and other waterfront structures in Westmoreland County (Reference 5). In Colonial Beach, high water and waves battered through the floor at the Reno Pier. Irving Avenue was undermined and breached in several places. A few homes in low-lying areas were evacuated because of flooding. Some areas lost as much as 15 to 20 feet of river front property due to erosion. The town's public beach, which received more than 1 million dollars worth of erosion control work and extra sand several years ago, escaped with minor damage (Reference 5).
Hurricane Floyd tracked across the Commonwealth of Virginia on September 16, 1999. Significant rainfall from Hurricane Floyd exceeded 15 inches in some areas which caused major wide spread flooding to various jurisdictions along with wind damage (Reference 11).
Hurricane Isabel formed from a tropical wave on September 6, 2003 in the Atlantic Ocean and strengthened to reach peak winds on September 11, 2003. The storm surge caused the most impact in Westmoreland County, resulting in significant damage to homes along riverways.
Having earlier been downgraded to a tropical storm, Hurricane Irene made landfall on North Carolina on August 27, and re-emerged from the Atlantic from southeastern Virginia on August 28. During the period of August 26-28, 2011, Governor Robert McDonnell requested a major disaster declaration, with President Obama reaffirming the declaration for Virginia on September 3 (Reference 14). Rain totals reached over 16 inches in some parts of the state. During the storm, nearly 2 million customers lost power (Reference 16).
10
Hurricane Sandy came ashore as an immense tropical storm in Virginia on October 26, 2012. Sandy dropped up to 8 inches of rain and up to 1 foot of snow in some areas (Reference 17). Wind gusts in Virginia were recorded between 60-70 mph. Governor Robert McDonnell declared a state of emergency on October 26. Hundreds of thousands lost power (Reference 18).
2.4 Flood Protection Measures
There are no existing flood control structures that would provide protection during major floods in the county. There are a number of measures that have afforded some protection against flooding, including bulkheads and seawalls, jetties, sand dunes, and non-structural measures for floodplain management such as zoning codes. The "Uniform Statewide Building Code" that went into effect in September 1973 states, "where a structure is located in a 100-Year flood plain, the lowest floor of all future construction or substantial improvement to an existing structure..., must be built at or above that level, except for non-residential structures which may be floodproofed to that level" (Reference 6). These requirements will no doubt be beneficial in reducing future flood damage in the county.
3.0 ENGINEERING METHODS
For the flooding sources studied in detail in the county, standard hydrologic and hydraulic study methods were used to determine the flood hazard data required for this study. Flood events of a magnitude which are expected to be equaled or exceeded once on the average during any 10-, 50-, 100-, or 500-year period (recurrence interval) have been selected as having special significance for floodplain management and for flood insurance rates. These events, commonly termed the 10-, 2-, 1-, and 0.2-percent annual chance floods, have a 10-, 2-, 1-, and 0.2-percent chance, respectively, of being equaled or exceeded during any year. Although the recurrence interval represents the long term average period between floods of a specific magnitude, rare floods could occur at short intervals or even within the same year. The risk of experiencing a rare flood increases when periods greater than 1 year are considered. For example, the risk of having a flood which equals or exceeds the 1 percent annual chance flood in any 50-year period is approximately 40 percent (4 in 10), and, for any 90-year period, the risk increases to approximately 60 percent (6 in 10). The analyses reported herein reflect flooding potentials based on conditions existing in the community at the time of completion of this study. Maps and flood elevations will be amended periodically to reflect future changes.
3.1 Hydrologic Analyses
Hydrologic analyses were carried out to establish the peak discharge-frequency relationships for each flooding source studied in detail affecting
11 the county.
Pre-countywide Analyses
The procedure used to develop the frequencies for Westmoreland County is as follows:
a. A Norfolk Harbor statistical analysis was performed in accordance with the procedures outlined in Bulletin 17B (Reference 7). The Pearson Type III methodology without the logs was incorporated for the selected period of record from 1928 through 1978. The Pearson Type III distribution without the logs was selected as a result of the following:
(1) A number of different distributions were fitted to tidal elevation data. The Pearson Type III distribution without the logs provided the best fit of the data points.
(2) It was felt that a statistical analysis would produce a more reliable and reproducible result when compared to a graphical approach.
b. Consideration was given to separating hurricane and non-hurricane events. Although objective statistical approaches are available for incomplete samples (a hurricane related tide exists for less than 50 percent of the years on record), they do not always provide reasonable results. Therefore, all tropical and extratropical events were included together in the analysis of the annual maximum tides.
c. The analysis of the 51 years of systematic record indicated that the 1933 and 1936 floods could be high outliers. However, assuming that the true distribution is defined by the computed (non-adjusted) statistics, the value for the 1933 flood has an exceedance probability of 0.010. It was determined that, with 51 years of record, the probability of a flood this rare being exceeded is 40 percent. Since this risk is so high and it is known that several floods as large and possibly larger than the 1933 flood have historically occurred, the 1933 flood (and any smaller floods) was not considered to be a high outlier.
d. Historical accounts indicate that tides have occurred in Norfolk Harbor at approximately 8 feet in 1667 and 1785 and approximately 7.9 feet in 1846. There has been a gradual rise in sea level over the investigated period of record at Norfolk Harbor. There was some question as to the amount of adjustment that should be made to the historical floods. To avoid overestimating the impact of the rise in sea level, the historical floods were increased by only 0.50 feet (approximately the same adjustment for the 1924 to 1942 period). The analysis based on a historical period
12
of 312 years resulted in a slight move to the left of the upper portion of the frequency curve when compared to the systematic record. Since the adjustment was not very large and there is some question as to the reliability of the historical data, the COE adopted the computed statistics based on the 51 years of systematic record. e. The lower portion of the statistical curve was adjusted with a
partial duration analysis using plotting positions in accordance with Weibull (Reference 7). It included all elevations above 4.26 feet.
August 18, 2009 Countywide Study
No new hydrologic analysis was developed for the August 18, 2009 FIS.
This Revision
No new hydrologic analysis was developed for this FIS.
3.2 Hydraulic Analyses
Hydraulic analyses, considering storm characteristics and the shoreline and bathymetric characteristics of the flooding sources studied, were carried out to provide estimates of the elevations of floods of the selected recurrence intervals along each of the shorelines.
Precountywide Analysis
For some of the flooding sources studied by approximate methods, the boundary of the 1 percent annual chance flood was determined by the discharge/depth relationships computed by the slope/area method.
August 18, 2009 Countywide Study
No new hydraulic analyses were performed for the August 18, 2009 revision. However, this entire study was updated to the North American Vertical Datum of 1988 (NAVD 88).
This Revision
No new hydraulic analysis was developed for this FIS.
All qualifying benchmarks within a given jurisdiction that are catalogued by the National Geodetic Survey (NGS) and entered into the National Spatial Reference System (NSRS) as First or Second Order Vertical and have a vertical stability classification of A, B or C are shown and labeled on the FIRM with their 6-character NSRS Permanent Identifier.
13
Benchmarks catalogued by the NGS and entered into the NSRS vary widely in vertical stability classification. NSRS vertical stability classifications are as follows:
Stability A: Monuments of the most reliable nature, expected to hold position/elevation (e.g., mounted in bedrock)
Stability B: Monuments which generally hold their position/elevation (e.g., concrete bridge abutment)
Stability C: Monuments which may be affected by surface ground movements (e.g., concrete monument below frost line)
Stability D: Mark of questionable or unknown vertical stability (e.g., concrete monument above frost line, or steel witness post) In addition to NSRS benchmarks, the FIRM may also show vertical control monuments established by a local jurisdiction; these monuments will be shown on the FIRM with the appropriate designations. Local monuments will only be placed on the FIRM if the community has requested that they be included, and if the monuments meet the aforementioned NSRS inclusion criteria.
To obtain current elevation, description, and/or location information for benchmarks shown on the FIRM for this jurisdiction, please contact the Information Services Branch of the NGS at (301) 713-3242, or visit their Web site at www.ngs.noaa.gov.
It is important to note that temporary vertical monuments are often established during the preparation of a flood hazard analysis for the purpose of establishing local vertical control. Although these monuments are not shown on the FIRM, they may be found in the Technical Support Data Notebook associated with the FIS report and FIRM for this community. Interested individuals may contact FEMA to access these data.
3.3 Coastal Analyses
Coastal analysis for this revision, considering storm characteristics and the shoreline and bathymetric characteristics of the flooding sources studied, were carried out to provide estimates of the elevations of floods of the selected recurrence intervals along the shoreline. Users of the FIRM should be aware that coastal flood elevations are provided in Table 2, “Summary of Coastal Stillwater Elevations” table in this report. If the elevation on the FIRM is higher than the elevation shown in this table, a wave height, wave runup, and/or wave setup component likely exists, in
14
which case, the higher elevation should be used for construction and/or floodplain management purposes.
An analysis was performed to establish the frequency peak elevation relationships for coastal flooding in Westmoreland County. The FEMA, Region III office, initiated a study in 2008 to update the coastal storm surge elevations within the states of Virginia, Maryland, and Delaware, and the District of Columbia including the Atlantic Ocean, Chesapeake Bay, the Delaware Bay, and their tributaries. The study replaces outdated coastal analyses as well as previously published storm surge stillwater elevations for all FIS Reports in the study area, including Westmoreland County, VA, and serves as the basis for updated FIRMs. Study efforts were initiated in 2008 and concluded in 2012.
The Potomac River is the primary coastal flooding source in Westmoreland County. Coastal flooding along the Rappahannock River affects the northwestern section of the County. The Potomac River affects the Town of Colonial Beach, Westmoreland State Park, and the unincorporated areas of the County. Along the Potomac River, Westmoreland County is susceptible to bluff retreat. The bluffs along Potomac River coastline vary from 7 feet to 150 feet in elevation, North American Vertical Datum of 1988 (NAVD88). The northern Potomac River coastline in the Town of Colonial Beach is medium-density residential. The coastlines along Nomini Bay and Sandy Point are comprised of low-density residential and agricultural areas. South of Colonial beach, the Potomac River coastline is characterized by agricultural and densely vegetated shore. The Rappahannock River shoreline is characterized by agricultural fields, marsh, and vegetation. The storm surge study was conducted for FEMA by the USACE and its project partners under Project HSFE03-06-X-0023, “NFIP Coastal Storm Surge Model for Region III” and Project HSFE03-09-X-1108, “Phase II Coastal Storm Surge Model for FEMA Region III”. The work was performed by the Coastal Processes Branch (HF-C) of the Flood and Storm Protection Division (HF), U.S. Army Engineer Research and Development Center – Coastal & Hydraulics Laboratory (ERDC-CHL). The end-to-end storm surge modeling system includes the Advanced Circulation Model for Oceanic, Coastal and Estuarine Waters (ADCIRC) for simulation of 2-dimensional hydrodynamics. ADCIRC was dynamically coupled to the unstructured numerical wave model Simulating Waves Nearshore (unSWAN) to calculate the contribution of waves to total storm surge (Reference 15). The resulting model system is typically referred to as SWAN+ADCIRC. A seamless modeling grid was developed to support the storm surge modeling efforts. The modeling system validation consisted of a comprehensive tidal calibration followed by a validation using carefully reconstructed wind and pressure fields from three major flood events for the Region III domain: Hurricane Isabel, Hurricane Ernesto, and extratropical storm Ida. Model skill was accessed
15
by quantitative comparison of model output to wind, wave, water level and high water mark observations.
The surge in the Potomac River affects 50 miles of shoreline and in the Rappahannock River affects 13 miles of Westmoreland County coastline, and that entire length was modeled for overland wave propagation. The fetch length across the Potomac River varies from approximately 3 to 7 miles. The fetch length across the Rappahannock River varies from approximately 0.3 to 0.6 mile.
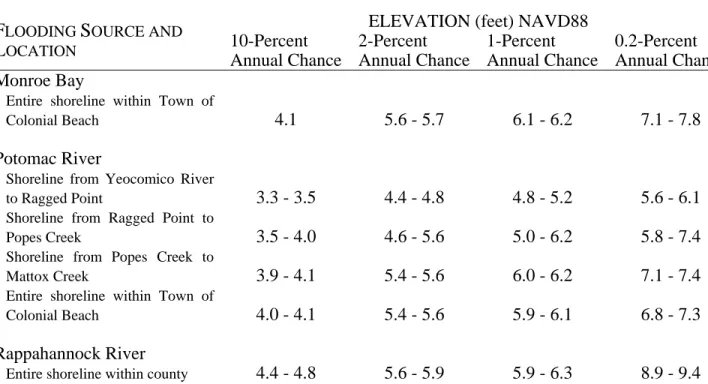
The storm-surge elevations for the 10-, 2-, 1-, and .2- percent annual chance floods were determined for the Potomac River and Rappahannock River and are shown in Table 2, “Summary of Coastal Stillwater Elevations.” The analyses reported herein reflect the stillwater elevations due to tidal and wind setup effects.
TABLE 2 – SUMMARY OF COASTAL STILLWATER ELEVATIONS FLOODING SOURCE AND
LOCATION
ELEVATION (feet) NAVD88 10-Percent Annual Chance 2-Percent Annual Chance 1-Percent Annual Chance 0.2-Percent Annual Chance Monroe Bay
Entire shoreline within Town of
Colonial Beach 4.1 5.6 - 5.7 6.1 - 6.2 7.1 - 7.8 Potomac River
Shoreline from Yeocomico River
to Ragged Point 3.3 - 3.5 4.4 - 4.8 4.8 - 5.2 5.6 - 6.1 Shoreline from Ragged Point to
Popes Creek 3.5 - 4.0 4.6 - 5.6 5.0 - 6.2 5.8 - 7.4
Shoreline from Popes Creek to
Mattox Creek 3.9 - 4.1 5.4 - 5.6 6.0 - 6.2 7.1 - 7.4
Entire shoreline within Town of
Colonial Beach 4.0 - 4.1 5.4 - 5.6 5.9 - 6.1 6.8 - 7.3
Rappahannock River
Entire shoreline within county 4.4 - 4.8 5.6 - 5.9 5.9 - 6.3 8.9 - 9.4 The methodology for analyzing the effects of wave heights associated with coastal storm surge flooding is described in a report prepared by the National Academy of Sciences (NAS) (Reference 8). This method is based on three major concepts. First, depth-limited waves in shallow water reach maximum breaking height that is equal to 0.78 times the stillwater depth. The wave crest is 70 percent of the total wave height above the stillwater level. The second major concept is that wave height may be diminished by dissipation of energy due to the presence of obstructions, such as sand dunes, dikes and seawalls, buildings and vegetation. The amount of energy dissipation is a function of the physical characteristics of the obstruction and is determined by procedures
16
prescribed in NAS Report. The third major concept is that wave height can be regenerated in open fetch areas due to the transfer of wind energy to the water. This added energy is related to fetch length and depth.
The coastal analysis for this revision involved transect layout, field reconnaissance, erosion analysis, and overland wave modeling including wave setup, wave height analysis and wave runup.
Wave heights were computed across transects that were located along coastal shores of Westmoreland County, as illustrated on the FIRMs. The transects were located with consideration given to existing transect locations and to the physical and cultural characteristics of the land so that they would closely represent conditions in the locality.
Each transect was taken perpendicular to the shoreline and extended inland to a point where coastal flooding ceased. Along each transect, wave heights and elevations were computed considering the combined effects of changes in ground elevation, vegetation, and physical features. The stillwater elevations for a 1% annual chance event were used as the starting elevations for these computations. Wave heights were calculated to the nearest 0.1 foot, and wave elevations were determined at whole-foot increments along the transects. The location of the 3-foot breaking wave for determining the terminus of the Zone VE (area with velocity wave action) was computed at each transect. In Westmoreland County there were no primary frontal dune systems.
Bluff retreat was taken into account along the Potomac River coastline. A review of the geology and shoreline type in Westmoreland County was made to determine the applicability of standard erosion methods. “Retreat” erosion method is employed along erodible bluffs with steep face slopes. Based on observation of historic coastal bluff erosion, eroded profiles generally retreat between 10-40 feet landward and an equivalent volume is deposited seaward of the bluff toe. Historic coastal bluff erosion data (from the Virginia Institute of Marine Sciences (VIMS)) and local wave environment were both considered in determining the erodibility of bluffs. Wave environment was evaluated using fetch length. If the fetch length was greater than 5 miles, and the VIMS shoreline data shows observed erosion, the bluff is considered erodible and bluff erosion is applied; if the fetch length is less than 5 miles, the area is considered sheltered and no bluff erosion is applied. The storm surge study provided the return period stillwater elevations required for erosion analyses. Each cross-shore transect was analyzed for erosion, when applicable.
Wave height calculations used in this flood study are based on the methodologies described in the FEMA guidance for coastal mapping (Reference 12). Wave setup results in an increased water level at the shoreline due to the breaking of waves and transfer of momentum to the water column during hurricanes and severe storms. For the Westmoreland County study, wave setup was determined directly from the coupled wave
17
and storm surge model. The total stillwater elevation (SWEL) with wave setup was then used for simulations of inland wave propagation conducted using FEMA’s Wave Height Analysis for Flood Insurance Studies (WHAFIS) model Version 4.0 (Reference 13). WHAFIS is a one-dimensional model that was applied to each transect in the study area. The model uses the specified SWEL, the computed wave setup, and the starting wave conditions as input. Simulations of wave transformations were then conducted with WHAFIS taking into account the storm-induced erosion and overland features of each transect. Output from the model includes the combined SWEL and wave height along each cross-shore transect allowing for the establishment of base flood elevations (BFEs) and flood zones from the shoreline to points inland within the study area. Wave runup is defined as the maximum vertical extent of wave uprush on a beach or structure. FEMA’s 2007 Guidelines and Specifications require the 2% wave runup level be computed for the coastal feature being evaluated (cliff, coastal bluff, dune, or structure) (Reference 12). The 2% runup level is the highest 2 percent of wave runup affecting the shoreline during the 1-percent-annual-chance flood event. Each transect defined within the Region III study area was evaluated for the applicability of wave runup, and if necessary, the appropriate runup methodology was selected and applied to each transect. Runup elevations were then compared to WHAFIS results to determine the dominant process affecting BFEs and associated flood hazard levels. Based on wave runup rates, wave overtopping was computed following the FEMA 2007 Guidelines and Specifications.
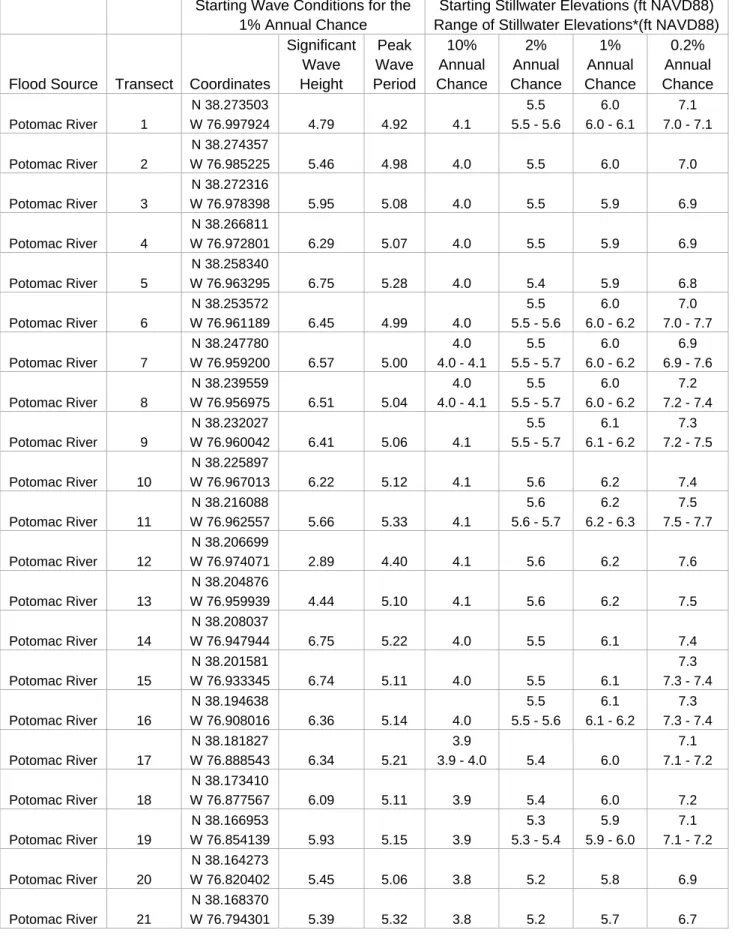
Figure 1, “Transect Location Map,” illustrates the location of each transect. Along each transect, wave envelopes were computed considering the combined effects of changes in ground elevation, vegetation and physical features. Between transects, elevations were interpolated using topographic maps, land-use and land-cover data, and engineering judgment to determine the aerial extent of flooding. The results of the calculations are accurate until local topography, vegetation, or cultural development within the community undergoes major changes. In Table 3, “Transect Data,” the flood hazard zone and base flood elevations (BFEs) for each transect flooding source is provided, along with the 10-, 2-, 1-, and 0.2-percent annual chance stillwater elevations for the respective flooding source. However, the coastal BFEs include storm surge, wave height, and runup, where it is applicable.
18 Figure 1. Transect Location Map
TABLE 3 – TRANSECT DATA
*For Transects with a constant Stillwater elevation, only one number is provided to represent both the starting value and the range
19
Starting Wave Conditions for the 1% Annual Chance
Starting Stillwater Elevations (ft NAVD88) Range of Stillwater Elevations*(ft NAVD88)
Flood Source Transect Coordinates
Significant Wave Height Peak Wave Period 10% Annual Chance 2% Annual Chance 1% Annual Chance 0.2% Annual Chance Potomac River 1 N 38.273503 W 76.997924 4.79 4.92 4.1 5.5 5.5 - 5.6 6.0 6.0 - 6.1 7.1 7.0 - 7.1 Potomac River 2 N 38.274357 W 76.985225 5.46 4.98 4.0 5.5 6.0 7.0 Potomac River 3 N 38.272316 W 76.978398 5.95 5.08 4.0 5.5 5.9 6.9 Potomac River 4 N 38.266811 W 76.972801 6.29 5.07 4.0 5.5 5.9 6.9 Potomac River 5 N 38.258340 W 76.963295 6.75 5.28 4.0 5.4 5.9 6.8 Potomac River 6 N 38.253572 W 76.961189 6.45 4.99 4.0 5.5 5.5 - 5.6 6.0 6.0 - 6.2 7.0 7.0 - 7.7 Potomac River 7 N 38.247780 W 76.959200 6.57 5.00 4.0 4.0 - 4.1 5.5 5.5 - 5.7 6.0 6.0 - 6.2 6.9 6.9 - 7.6 Potomac River 8 N 38.239559 W 76.956975 6.51 5.04 4.0 4.0 - 4.1 5.5 5.5 - 5.7 6.0 6.0 - 6.2 7.2 7.2 - 7.4 Potomac River 9 N 38.232027 W 76.960042 6.41 5.06 4.1 5.5 5.5 - 5.7 6.1 6.1 - 6.2 7.3 7.2 - 7.5 Potomac River 10 N 38.225897 W 76.967013 6.22 5.12 4.1 5.6 6.2 7.4 Potomac River 11 N 38.216088 W 76.962557 5.66 5.33 4.1 5.6 5.6 - 5.7 6.2 6.2 - 6.3 7.5 7.5 - 7.7 Potomac River 12 N 38.206699 W 76.974071 2.89 4.40 4.1 5.6 6.2 7.6 Potomac River 13 N 38.204876 W 76.959939 4.44 5.10 4.1 5.6 6.2 7.5 Potomac River 14 N 38.208037 W 76.947944 6.75 5.22 4.0 5.5 6.1 7.4 Potomac River 15 N 38.201581 W 76.933345 6.74 5.11 4.0 5.5 6.1 7.3 7.3 - 7.4 Potomac River 16 N 38.194638 W 76.908016 6.36 5.14 4.0 5.5 5.5 - 5.6 6.1 6.1 - 6.2 7.3 7.3 - 7.4 Potomac River 17 N 38.181827 W 76.888543 6.34 5.21 3.9 3.9 - 4.0 5.4 6.0 7.1 7.1 - 7.2 Potomac River 18 N 38.173410 W 76.877567 6.09 5.11 3.9 5.4 6.0 7.2 Potomac River 19 N 38.166953 W 76.854139 5.93 5.15 3.9 5.3 5.3 - 5.4 5.9 5.9 - 6.0 7.1 7.1 - 7.2 Potomac River 20 N 38.164273 W 76.820402 5.45 5.06 3.8 5.2 5.8 6.9 Potomac River 21 N 38.168370 W 76.794301 5.39 5.32 3.8 5.2 5.7 6.7
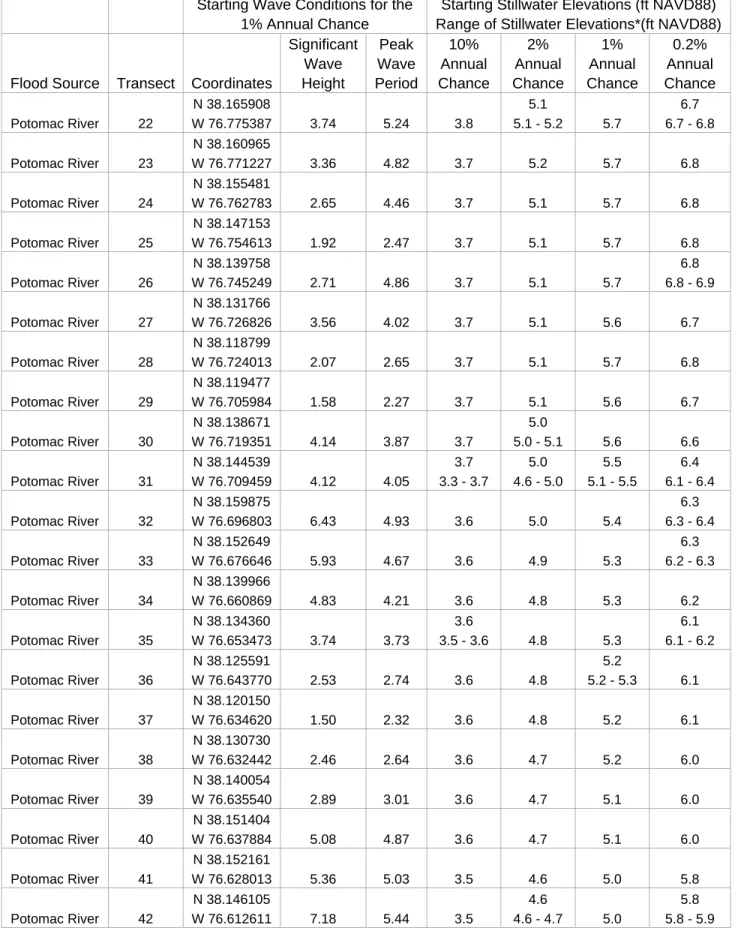
TABLE 3 – TRANSECT DATA (continued)
*For Transects with a constant Stillwater elevation, only one number is provided to represent both the starting value and the range
20
Starting Wave Conditions for the 1% Annual Chance
Starting Stillwater Elevations (ft NAVD88) Range of Stillwater Elevations*(ft NAVD88)
Flood Source Transect Coordinates
Significant Wave Height Peak Wave Period 10% Annual Chance 2% Annual Chance 1% Annual Chance 0.2% Annual Chance Potomac River 22 N 38.165908 W 76.775387 3.74 5.24 3.8 5.1 5.1 - 5.2 5.7 6.7 6.7 - 6.8 Potomac River 23 N 38.160965 W 76.771227 3.36 4.82 3.7 5.2 5.7 6.8 Potomac River 24 N 38.155481 W 76.762783 2.65 4.46 3.7 5.1 5.7 6.8 Potomac River 25 N 38.147153 W 76.754613 1.92 2.47 3.7 5.1 5.7 6.8 Potomac River 26 N 38.139758 W 76.745249 2.71 4.86 3.7 5.1 5.7 6.8 6.8 - 6.9 Potomac River 27 N 38.131766 W 76.726826 3.56 4.02 3.7 5.1 5.6 6.7 Potomac River 28 N 38.118799 W 76.724013 2.07 2.65 3.7 5.1 5.7 6.8 Potomac River 29 N 38.119477 W 76.705984 1.58 2.27 3.7 5.1 5.6 6.7 Potomac River 30 N 38.138671 W 76.719351 4.14 3.87 3.7 5.0 5.0 - 5.1 5.6 6.6 Potomac River 31 N 38.144539 W 76.709459 4.12 4.05 3.7 3.3 - 3.7 5.0 4.6 - 5.0 5.5 5.1 - 5.5 6.4 6.1 - 6.4 Potomac River 32 N 38.159875 W 76.696803 6.43 4.93 3.6 5.0 5.4 6.3 6.3 - 6.4 Potomac River 33 N 38.152649 W 76.676646 5.93 4.67 3.6 4.9 5.3 6.3 6.2 - 6.3 Potomac River 34 N 38.139966 W 76.660869 4.83 4.21 3.6 4.8 5.3 6.2 Potomac River 35 N 38.134360 W 76.653473 3.74 3.73 3.6 3.5 - 3.6 4.8 5.3 6.1 6.1 - 6.2 Potomac River 36 N 38.125591 W 76.643770 2.53 2.74 3.6 4.8 5.2 5.2 - 5.3 6.1 Potomac River 37 N 38.120150 W 76.634620 1.50 2.32 3.6 4.8 5.2 6.1 Potomac River 38 N 38.130730 W 76.632442 2.46 2.64 3.6 4.7 5.2 6.0 Potomac River 39 N 38.140054 W 76.635540 2.89 3.01 3.6 4.7 5.1 6.0 Potomac River 40 N 38.151404 W 76.637884 5.08 4.87 3.6 4.7 5.1 6.0 Potomac River 41 N 38.152161 W 76.628013 5.36 5.03 3.5 4.6 5.0 5.8 Potomac River 42 N 38.146105 W 76.612611 7.18 5.44 3.5 4.6 4.6 - 4.7 5.0 5.8 5.8 - 5.9
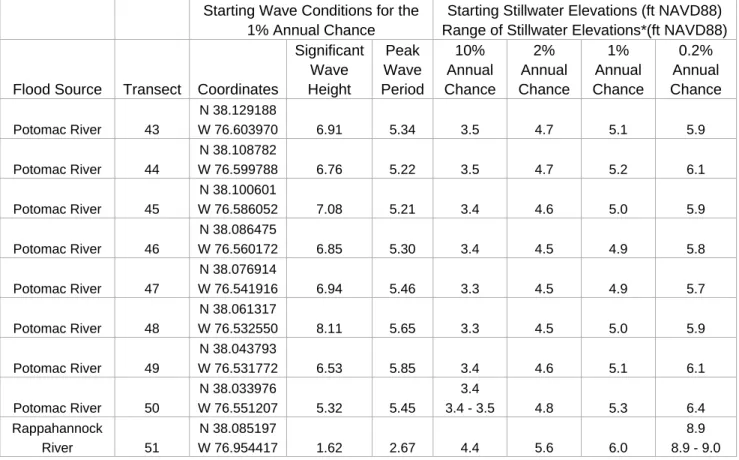
TABLE 3 – TRANSECT DATA (continued)
21
Starting Wave Conditions for the 1% Annual Chance
Starting Stillwater Elevations (ft NAVD88) Range of Stillwater Elevations*(ft NAVD88)
Flood Source Transect Coordinates
Significant Wave Height Peak Wave Period 10% Annual Chance 2% Annual Chance 1% Annual Chance 0.2% Annual Chance Potomac River 43 N 38.129188 W 76.603970 6.91 5.34 3.5 4.7 5.1 5.9 Potomac River 44 N 38.108782 W 76.599788 6.76 5.22 3.5 4.7 5.2 6.1 Potomac River 45 N 38.100601 W 76.586052 7.08 5.21 3.4 4.6 5.0 5.9 Potomac River 46 N 38.086475 W 76.560172 6.85 5.30 3.4 4.5 4.9 5.8 Potomac River 47 N 38.076914 W 76.541916 6.94 5.46 3.3 4.5 4.9 5.7 Potomac River 48 N 38.061317 W 76.532550 8.11 5.65 3.3 4.5 5.0 5.9 Potomac River 49 N 38.043793 W 76.531772 6.53 5.85 3.4 4.6 5.1 6.1 Potomac River 50 N 38.033976 W 76.551207 5.32 5.45 3.4 3.4 - 3.5 4.8 5.3 6.4 Rappahannock River 51 N 38.085197 W 76.954417 1.62 2.67 4.4 5.6 6.0 8.9 8.9 - 9.0 *For Transects with a constant Stillwater elevation, only one number is provided to represent both the starting value and the range
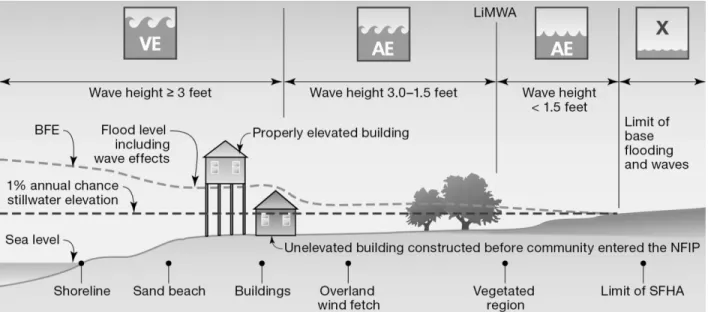
Areas of coastline subject to significant wave attack are referred to as coastal high hazard zones. The USACE has established the 3-foot breaking wave as the criterion for identifying the limit of coastal high hazard zones. The 3-foot wave has been determined to be the minimum size wave capable of causing major damage to conventional wood frame or brick veneer structures. The one exception to the 3-foot wave criteria is where a primary frontal dune exists. The limit of the coastal high hazard area then becomes the landward toe of the primary frontal dune or where a 3-foot or greater breaking wave exists, whichever is most landward. The coastal high hazard zone is depicted on the FIRMs as Zone VE, where the delineated flood hazard includes wave heights equal to or greater than three feet. Zone AE is depicted on the FIRMs where the delineated flood hazard includes wave heights less than three feet. A depiction of how the Zones VE and AE are mapped is shown in Figure 2, “Transect Schematic.”
22
Post-storm field visits and laboratory tests have confirmed that wave heights as small as 1.5 feet can cause significant damage to structures when constructed without consideration to the coastal hazards. Additional flood hazards associated with coastal waves include floating debris, high velocity flow, erosion, and scour which can cause damage to Zone AE-type construction in these coastal areas. To help community officials and property owners recognize this increased potential for damage due to wave action in the AE zone, FEMA issued guidance in December 2008 on identifying and mapping the 1.5-foot wave height line, referred to as the Limit of Moderate Wave Action (LiMWA). While FEMA does not impose floodplain management requirements based on the LiMWA, the LiMWA is provided to help communicate the higher risk that exists in that area (Reference 19). Consequently, it is important to be aware of the area between this inland limit and the Zone VE boundary as it still poses a high risk, though not as high of a risk as Zone VE, see Figure 2 "Transect Schematic.”
Figure 2. Transect Schematic 3.4 Vertical Datum
All FIS reports and FIRMs are referenced to a specific vertical datum. The vertical datum provides a starting point against which flood, ground, and structure elevations can be referenced and compared. Until recently, the standard vertical datum used for newly created or revised FIS reports and FIRMs was the National Geodetic Vertical Datum of 1929 (NGVD 29). With the completion of the North American Vertical Datum of 1988 (NAVD 88), many FIS reports and FIRMs are now prepared using NAVD 88 as the referenced vertical datum.
23
All flood elevations shown in this FIS report and on the FIRM are now referenced to NAVD 88. In order to perform this conversion, effective NGVD 29 elevation values were adjusted downward by 0.80 foot. Structure and ground elevations in the community must, therefore, be referenced to NAVD 88. It is important to note that adjacent communities may be referenced to NGVD 29. This may result in differences in base flood elevations across the corporate limits between the communities. For more information on NAVD 88, see Converting the National Flood Insurance Program to the North American Vertical Datum of 1988, FEMA Publication FIA-20/June 1992, or contact the National Geodetic Survey at the following address:
Spatial Reference System Division National Geodetic Survey, NOAA
Silver Spring Metro Center 3 1315 East-West Highway Silver Spring, Maryland 20910
(301) 713-3191
http://www.ngs.noaa.gov/ 4.0 FLOODPLAIN MANAGEMENT APPLICATIONS
The NFIP encourages State and local governments to adopt sound floodplain management programs. To assist in this endeavor, each FIS report provides 1 percent annual-chance floodplain data, which may include a combination of the following: 10-, 2-, 1-, and 0.2 percent annual chance flood elevations; delineations of the 1 percent and 0.2 percent annual chance floodplains; and a 1 percent annual-chance floodway. This information is presented on the FIRM and in many components of the FIS report, including Flood Profiles, and Floodway Data tables. Users should reference the data presented in the FIS report as well as additional information that may be available at the local community map repository before making flood elevation and/or floodplain boundary determinations.
4.1 Floodplain Boundaries
To provide a national standard without regional discrimination, the 1 percent annual chance flood has been adopted by FEMA as the base flood for floodplain management purposes. The 0.2 percent annual chance flood is employed to indicate additional areas of flood risk in the county.
For the flooding sources studied by approximate methods, the boundary of the 1 percent annual chance flood was delineated using topographic maps and the Flood Hazard Boundary Map for the unincorporated areas of Westmoreland County (References 9 and 10).
24
For this revision, the coastal boundaries were mapped using a Digital Elevation Model (DEM) derived from LiDAR data collected by Dewberry for the USGS in 2011 (Reference 20). The coastal flood boundaries were delineated using the elevations determined at each transect; between transects, the boundaries were interpolated using engineering judgment, land-cover data, and topographic data.
The 1 percent and 0.2 percent annual chance floodplain boundaries are shown on the FIRM. On this map, the 1 percent annual chance floodplain boundary corresponds to the boundary of the areas of special flood hazards (Zones A, AE, AO, and VE), and the 0.2 percent annual chance floodplain boundary corresponds to the boundary of areas of moderate flood hazards. In cases where the 1 percent and 0.2 percent annual chance floodplain boundaries are close together, only the 1 percent annual chance floodplain boundary has been shown. Small areas within the floodplain boundaries may lie above the flood elevations but cannot be shown due to limitations of the map scale and/or lack of detailed topographic data.
For the streams studied by approximate methods, only the 1 percent annual chance floodplain boundary is shown on the FIRM (Exhibit 2).
5.0 INSURANCE APPLICATIONS
For flood insurance rating purposes, flood insurance zone designations are assigned to a community based on the results of the engineering analyses. The zones are as follows:
Zone A
Zone A is the flood insurance rate zone that corresponds to the 1 percent annual chance floodplains that are determined in the FIS by approximate methods. Because detailed hydraulic analyses are not performed for such areas, no base flood elevations or depths are shown within this zone.
Zone AE
Zone AE is the flood insurance rate zone that corresponds to the 1 percent annual chance floodplains that are determined in the FIS by detailed methods. In most instances, whole-foot base flood elevations derived from the detailed hydraulic analyses are shown at selected intervals within this zone.
Zone AO
Zone AO is the flood insurance rate zone that corresponds to the areas of one percent annual chance shallow flooding (usually sheet flow on sloping terrain) where average depths are between 1 and 3 feet. Average whole-foot depths derived from the detailed hydraulic analyses are shown within this zone.
25 Zone VE
Zone VE is the flood insurance rate zone that corresponds to the 1 percent annual chance coastal floodplains that have additional hazards associated with storm waves. Whole-foot base flood elevations derived from the detailed hydraulic analyses are shown at selected intervals within this zone.
Zone X
Zone X is the flood insurance rate zone that corresponds to areas outside the 0.2 percent annual chance floodplain, areas within the 0.2 percent annual chance floodplain, and to areas of 1 percent annual chance flooding where average depths are less than 1 foot, areas of 1 percent annual chance flooding where the contributing drainage area is less than 1 square mile, and areas protected from the 1 percent annual chance flood by levees. No base flood elevations or depths are shown within this zone.
6.0 FLOOD INSURANCE RATE MAP
The FIRM is designed for flood insurance and floodplain management applications. For flood insurance applications, the map designates flood insurance rate zones as described in Section 5.0. In the 1 percent annual chance floodplains that were studied by detailed methods, shows selected whole-foot base flood elevations or average depths. Insurance agents use the zones and base flood elevations in conjunction with information on structures and their contents to assign premium rates for flood insurance policies.
For floodplain management applications, the map shows by tints, screens, and symbols, the 1 percent and 0.2 percent annual chance floodplains. Floodways and the locations of selected cross sections used in the hydraulic analyses and floodway computations are shown where applicable.
The current FIRM presents flooding information for the entire geographic area of Westmoreland County. Historical data relating to the maps prepared for each community are presented in Table 4, "Community Map History."
7.0 OTHER STUDIES
Information pertaining to revised and unrevised flood hazards for each jurisdiction within Westmoreland County has been compiled into this FIS. Therefore, this FIS supersedes all previously printed FIS reports, and FIRMs for all of the incorporated and unincorporated jurisdictions within Westmoreland County.
Flood Insurance Studies for the unincorporated areas of Charles and St. Mary's Counties, Maryland, and Northumberland and Essex Counties, Virginia are
26
underway by RAMPP. The results of this study will be in agreement with the results of those studies, as the same up-to-date analyses were used in Westmoreland County.
8.0 LOCATION OF DATA
Information concerning the pertinent data used in preparation of this study can be obtained by contacting Federal Insurance and Mitigation Division, Federal Emergency Management Agency, One Independence Mall, Sixth Floor, 615
27
COMMUNITY NAME INITIAL IDENTIFICATION
FLOOD HAZARD BOUNDARY MAP REVISIONS DATE
FIRM EFFECTIVE DATE FIRM REVISIONS DATE Colonial Beach, Town of August 9, 1974 October 3, 1975 September 18, 1987
Montross, Town of '
Westmoreland County, (Unincorporated Areas)
July 18, 1975 May 14, 1982 September 18, 1987 August 3, 1992
1
This community did not have a FIRM prior to the August 18, 2009 first countywide FIRM for Westmoreland County
TABL
E 4
FEDERAL EMERGENCY MANAGEMENT AGENCY
WESTMORELAND COUNTY, VA
28
9.0 BIBLIOGRAPHY AND REFERENCES
1. U.S. Department of Commerce, Census Bureau, State & County QuickFacts, http://quickfacts.census.gov/
2. Commonwealth of Virginia, Division of State Planning and Community Affairs, Data Summary - Westmoreland County, Richmond, Virginia, September 1971.
3. U. S. Department of Commerce, National Oceanic and Atmospheric Administration, National Ocean Service, Tide Tables 1986, High and Low Water Predictions, East Coast of North and South America Including Greenland, Washington, D. C., May 1985.
4. U. S. Army Corps of Engineers, House Document 456, 87th Congress, 2nd Session, An Interim Hurricane Survey of Colonial Beach,
Virginia, 1962.
5. Westmoreland News, Montross and Colonial Beach, Virginia, November 7, 1985, and November 14, 1985.
6. Commonwealth of Virginia, Virginia Uniform Statewide Building Code, Article 8, Part C, Section 872.6, September 1973.
7. U. S. Department of the Interior, Geological Survey, Office of Water Data Collection, Interagency Advisory Committee on Water Data, "Guidelines for Determining Flood Flow Frequency," Bulletin 17B, Reston, Virginia, Revised September 1981.
8. National Academy of Sciences, Methodology for Calculating Wave Action Effects Associated with Storm Surges, Washington, D. C., 1977.
9. U. S. Department of the Interior, Geological Survey, 7.5-Minute Series, Scale 1:24,000, Contour Intervals 5 and 10 Feet: Dahlgren, Virginia-Maryland, 1968; Colonial Beach North, Maryland-Virginia, 1968, Photoinspected 1973; Rollins Fork, Virginia, 1968; Colonial Beach South, Virginia-Maryland, 1968, Photorevised 1980; Stratford Hall, Virginia-Maryland, 1968, Photorevised 1973; St. Clements Island, Virginia-Maryland, 1968; Piney Point, Maryland-Virginia, 1968, Photorevised 1973; St. Loretto, Virginia, 1968, Photorevised 1978; Champlain, Virginia, 1968, Photorevised 1973; Montross, Virginia, 1968; Hachodoc, Virginia, 1968; Kinsale,
Virginia-Maryland, 1968, Photoinspected 1973; Tappahannock, Virginia, 1968, Photorevised 1979; Haynesville, Virginia, 1968, Photorevised 1979; Lottsburg, Virginia, 1968.
29
10. Federal Emergency Management Agency (FEMA), Flood Hazard Boundary Map, Unincorporated Areas of Westmoreland County, Virginia, May 14, 1982.
11. Virginia Department of Emergency Services, Hurricane Floyd VEOC Situation Report, As of 1400 hrs 09/24/99,
http://www.vdem.state.va.us/newsroom/sitreps/1999/floyd/dfo4.htm 12. FEMA, Guidelines and Specifications for Flood Hazard Mapping
Partners, Appendix D, Atlantic Ocean and Gulf of Mexico Coastal Guidelines Update, Washington, D.C., 2007a
13. FEMA, Supplementary WHAFIS Documentation, WHAFIS 4.0, Atlanta, GA, 2007b.
14. Federal Emergency Management Agency, Major Disaster Declarations, Disaster Declarations for Virginia,
https://www.fema.gov/ar/disasters/grid/state-tribal-government/22?field_disaster_type_term_tid_1=All, Accessed July 25, 2013.
15. USACE, FEMA Region III Storm Surge Study, Coastal Storm Surge Analysis: Storm Surge Results, Intermediate Data Submittal No. 3 in Draft Form, USACE ERDC/CHL, Vicksburg, MS, July, 2012.
16. Katrandjian, O. Hurricane Irene: 8 Known Dead, 2 Million Without
Power. ABC News. August 27, 2011.
http://abcnews.go.com/US/hurricanes/hurricane-irene-dead-million-power/story?id=14393026. Accessed August 12, 2013 17. Grieser, J. From the Devastating surge to crippling snow, Hurricane
Sandy by the numbers. The Washington Post. October 31, 2012.
http://www.washingtonpost.com/blogs/capital-weather- gang/post/hurricane-sandy-recap-historic-storm-from-storm-surge-
to-snow/2012/10/31/9a7c56d8-2362-11e2-ac85-e669876c6a24_blog.html. Accessed August 12, 2013.
18. Caldwell, J. Governor McDonnell Updates Virginia's Recovery from Hurricane Sandy. Virginia.gov. October 30, 2012. http://www.governor.virginia.gov/news/viewRelease.cfm?id=1481.
Accessed August 12, 2013
19. Federal Emergency Management Agency, Procedure Memorandum No. 50 – Policy and Procedures for Identifying and Mapping Areas Subject to Wave Heights Greater than 1.5 feet as an Informational Layer on Flood Insurance Rate Maps (FIRMs), Washington, D.C., 2008.
30
20. Dewberry, Virginia Counties North Acquisition and Classification for FEMA VA LiDAR, Fairfax, VA, February 10, 2012.