CPU Utilization while Scaling Resources in the Cloud
Marjan Gusev, Sasko Ristov, Monika Simjanoska, and Goran Velkoski Faculty of Information Sciences and Computer Engineering
Ss. Cyril and Methodius University Skopje, Macedonia
Email: [email protected], [email protected], [email protected], [email protected]
Abstract—CPU utilization in a virtual machine instance directly impacts the overall cost for the cloud service provider since it generates costs for power consumption and cooling. We are interested to determine the total CPU utilization behavior while scaling the number of CPU cores using the same server load. The experiments are based on two simple web services to utilize the virtual machine instance varying the number of concurrent messages and their size. The goal is to check if the total CPU utilization while scaling will be sublinear (smaller than the number of cores), and if it is greater than the CPU utilization when executed without scaling (using only one CPU core) due to task scheduling, coherence, etc. The experiments prove only that the total CPU utilization will be sublinear. We observe a region (workload with smaller number of concurrent messages) where the total CPU utilization decreases while scaling, compared to the case without scaling. We also determine the correlation between the CPU utilization with message size and the number of concurrent messages.
Keywords-Cloud Computing;Performance;Web Services;Web Server.
I. INTRODUCTION
Cloud computing is a recent technological trend in which resources, such as CPU and storage, are provided as general utilities that can be leased and released on-demand by users according to their requirements [1]. The cloud is a promising approach for delivering ICT services by improving the uti-lization of data centre resources [2]. Scalability and elasticity are quality features in the cloud, since the cloud adjusts itself to achieve better performance whenever it detects a change in the environment [3]. Scaling the performance for growing problem size is an imperative [4], [5]. However, the resulting performance is not always acceptable for all applications hosted in the cloud [6].
While the cloud customer cost depends on the resources leased time, the cloud service provider cost mostly de-pends on CPU utilization of the active (leased) resources. That is, greater CPU utilization will increase not only the cost for power electricity, but also for cooling. Activating and utilizing more computing resources will increase the monthly costs of cloud data-center (approx.40% of costs are generated by power electricity and cooling). Reallocation of virtual machines and switching off the idle servers will save substantial energy [7]. Optimal resource allocation can
improve the performance using the same resources in the cloud [8]. Saleh et al. [9] have demonstrated that using some CPU utilization threshold to autoscale the resources is not an accurate measure since it can provide high cost and poor resource utilization.
Scaling the resources will reduce the CPU utilization per core, but we are interested if total CPU utilization will be also reduced or increased. We have set two hypotheses which we would like to check:
H1 the total CPU utilization while scaling is sublinear (smaller than the number of cores); and
H2 the total CPU utilization while scaling is greater than the CPU utilization when executed without scaling due to task scheduling, coherence, etc. That is, we expect that the total CPU utilization will be in the range of(U1, U1·n), whereU1denotes the CPU utilization of virtual machine instance with one CPU allocated.
We realize several experiments to find the behavior of CPU utilization when scaling is applied, i.e., more powerful virtual machine instances (using more processor cores) are activated. The experiments are based on measurement of the CPU utilization while scaling from 1 to 2 and 4 CPU cores in a virtual machine instance. We use two simple web services to load the web server in virtual machine instances, i.e., ConcatandSort. The former concats two strings and the latter sorts the concatenation of two input strings. Both are memory demanding, and the second is also computationally intensive. We analyze the CPU utilization by varying the server load with different number of concurrent messages and input string size.
The rest of the paper is organized as follows. Related work is presented in Section II. In Section III, we describe the methodology used for testing. The experiments and the results are discussed in sections IV and V. In Section VI, we derive conclusion and we present future work.
II. RELATEDWORK
Several papers analyzed CPU utilization on-premise and in the cloud, while loaded the same web services with various number of concurrent messages and message size. Gusev et al. [10] determined that the number of concurrent messages impacts directly to the CPU utilization for memory
demanding web services (Concat), while both the number of messages and their size impact the CPU utilization for both memory demanding and computation intensive web services (Sort). They determined that CPU utilization is always greater while hosted in the cloud compared to on-premise, for the same load and maximum allocated resources (4 CPUs). In this paper, we confirmed the same correlation of CPU utilization and the input parameters, and not only when maximum resources are allocated in particular virtual machine instance, but also when allocated with 1 or 2 CPUs. Velkoski et al. [11] analyzed the CPU utilization for the same (maximum) total amount of cloud resources, but orchestrated in different number of virtual machine instances with different size. They determined that allocating all resources into one ”huge” virtual machine instance provides greater CPU utilization compared to the case where the same amount of resources are allocated to many ”small” virtual machine instances for huge (the same) server load (number of concurrent messages) regardless of their size. In this paper, we analyze the CPU utilization of virtual machine instances with different number of CPUs, i.e., scaling the resources from 1 CPU to 2 and 4 CPUs, using the same server load for each virtual machine instance.
The CPU utilization is important factor for overall system performance and cost. Greater CPU utilization produces higher response times for load dependent resources [12]. A CPU bottleneck appears if its utilization goes beyond 80% for a sustained period of time [13]. De Sousa et al. [14] evaluated the CPU utilization of different virtual machine instances on Eucalyptus [15] platform considering different workloads with LINPACK as benchmark which solves dense system of linear equations. In this paper, we load web services hosted in different virtual machine instances on OpenStack cloud.
Many factors impact the CPU utilization and different server loads do not utilize the CPU equally. Even more, not all virtualized CPUs share the whole physical CPU. The small virtual machine instances of Amazon EC2 always get 40-50% of the physical CPU, while the most of medium virtual machine instances get 100% CPU sharing [16]. Hov-estadt et al. [17] found that CPU utilization are not displayed accurately inside virtual machines instantiated with XEN, KVM, and in Amazon EC2.
Vilutis et al. [18] propose some of the project executions to be postponed in order to minimize the utilized resources and thus to reduce the overall cost. Balancing the load among more CPUs will also decrease their particular uti-lization. Jayasinghe et al. [19] analyzed the scalability of n-Tier applications while migrating in the cloud. They de-termined variations in CPU utilization in different tiers while scaling the resources. In this paper, we provide experimental research to find the behavior of total CPU utilization for the same load, but scaling the resources.
III. THEMETHODOLOGY
This section presents the testing methodology used to obtain reliable results in each test case.
A. Technical Details
Client-server web service architecture is used as a testing environment. The server is deployed in OpenStack cloud [20] using KVM (Kernel-based Virtual Machine) hypervisor to instantiate virtual machine instances. The cloud nodes are installed with Ubuntu Server 12.04 operating system. Hardware computing resources consist of Intel(R) Xeon(R) CPU X5647 @ 2.93GHz with 4 cores and 8GB RAM. Virtual machine instances platform is Ubuntu Server 12.04 with Apache Tomcat 6.
The client uses SoapUI [21] to generate different server load. The client and the virtual machine instances are placed in the same LAN segment to minimize network latency [22].
B. Test Cases Definition
The Concat web service is memory demanding only service. It accepts two input strings and returns their concate-nation. TheSortweb service accepts two strings and returns their concatenation, alphabetically sorted, which makes it computationally intensive besides the increased memory demands.
Three test cases are defined scaling the number of CPUs per virtual machine instance that hosts the web services, with the following configuration:
• Test Case 1 - virtual machine instance with 1 CPU (m1.small);
• Test Case 2 - virtual machine instance with 2 CPUs
(m1.medium); and
• Test Case 3 - virtual machine instance with 4 CPUs
(m1.large).
Each test case runs for 60 seconds. The test is repeated if the server replies with an error. Web server is loaded withN messages with parameters size ofM bytes each. The range of parameters M and N is selected such that web server in virtual machine instance works in normal mode without replying error messages. Parameter M is measured in KB with the following values0,1,· · ·,9forConcatweb service and0,1,· · ·,6forSortweb service. Both web services are loaded withN = 12,100,500,750,1000,1250,1500,1750 and2000 requests per second for each M. The values are selected to avoid CPU saturation.
C. Test Data
The CPU utilization is measured for each parameter size M, for different web service loads per second N, in each test case. While testing, we usetopUbuntu based utility to capture Tomcat process CPU utilization each 3 seconds, i.e. 20 values per test. An average utilization is calculated of all 20 values for eache test case for bothConcatandSortweb services distinctively.
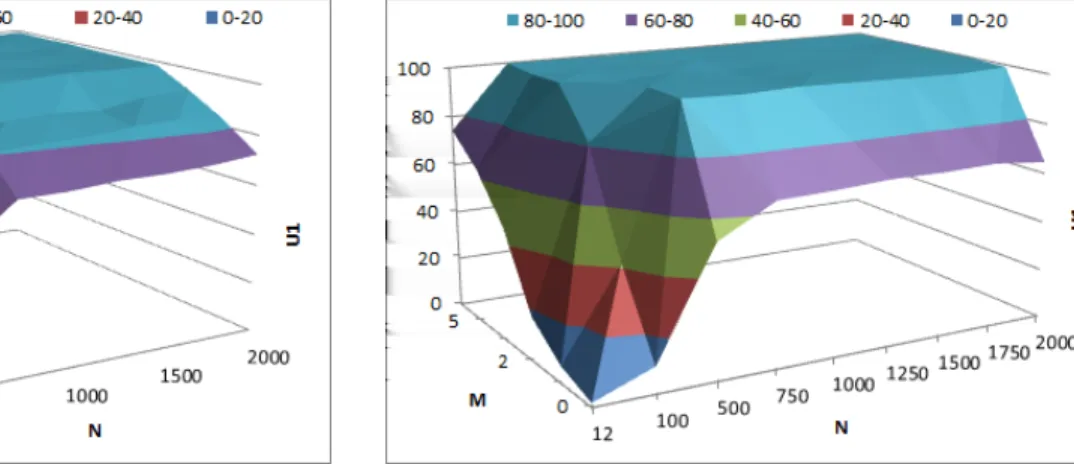
Figure 1. Normalized CPU utilizationU1forConcatweb service
D. Analysis of CPU Utilization
We use (1) to normalize CPU usage in range from 0% up to 100%. The nominator is the sum of CPU usageUi(n)of
allnCPU cores, and the denominatorndenotes the scaling factor, i.e., the number of CPUs used in particular test case (n∈ {1,2,4}).
Un= Pi=n
i=1Ui(n)
n (1)
Furthermore, we define Relative Scaled CPU utilization
S(n) in (2) and calculate it for each test case in order to test both hypotheses, i.e., if 1< S(n)< n.U1 denotes the CPU utilization without CPU scaling.
S(n) = Pi=n
i=1Ui(n)
U1 (2)
We also define Relative Multi-core Scaled CPU Uti-lization in (3) and calculate it using relative scaled CPU utilization of test cases with scaling factorsn= 2andn= 4.
Sm=S(4)/S(2) (3)
IV. EXPERIMENTS ANDRESULTS
In this section, we exhibit the CPU utilization results of testing the web services for each test case in order to determine the correlation of CPU utilization with both parametersM andNfor both web services hosted on virtual machine with particular number of CPU cores.
A. Test Case 1 - Without Scaling
Concat and Sort web services are hosted on 1 virtual machine instance with 1 CPU core in this test case.
Figure 2. Normalized CPU utilizationU1forSortweb service
1) ConcatWeb Service: Figure 1 depicts the normalized CPU utilizationU1 forConcatweb service.
The results show that the CPU utilization depends on the number of concurrent messagesN with huge increasing fac-tor, and it proportionally increases when the input parameter M increases, but with small increasing factor. The minimum CPU utilization of U1 = 1.735% occurs for N = 12 and M = 0, whereas maximum CPU utilizationU1 = 99.23% is measured forN = 2000andM = 9, as expected.
2) Sort Web Service: Figure 2 depicts the normalized CPU utilizationU1 forSortweb service.
The results show that the CPU utilization strongly depends on both input parameters N and M. The dependence is expressed with huge increasing factor when changing the parameter M from 0KB to 1KB, and also for M ≤ 2 andN ≤500. For the rest of the parameters, the increasing factor is small and continuously incremental. The minimum CPU utilization of U1 = 1.70% is measured at M = 0 and N = 12, whereas the maximum CPU utilization U1= 99.85% is measured forM = 6andN = 2000.
B. Test Case 2 - Scaling Factor 2
Both web services are hosted on a virtual machine in-stance with scaling factor 2, i.e., allocated with 2 CPU cores.
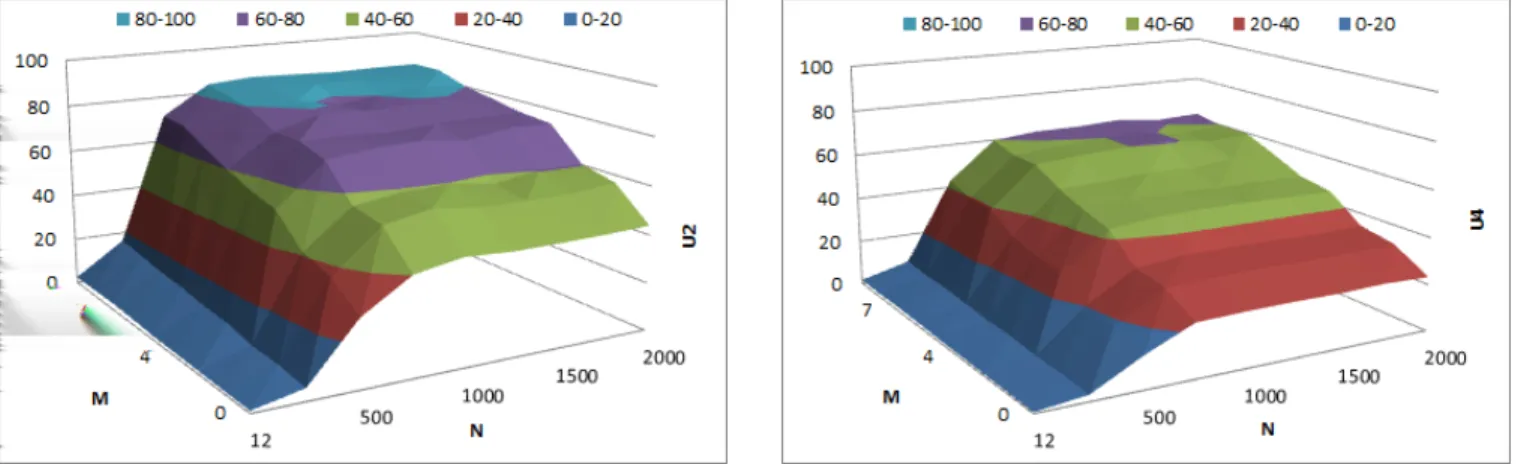
1) ConcatWeb Service: Figure 3 depicts the normalized CPU utilizationU2 forConcatweb service.
The results show a minimum CPU utilization U2 = 1% and maximum CPU utilizationU2= 85.43%for parameters N = 12 and M = 0, and N = 1000 and M = 9, respectively. The dependence is the same as forU1, except for a small message size where it performs with decreased CPU utilization.
2) Sort Web Service: Figure 4 depicts the normalized CPU utilizationU2 forSortweb service.
The normalized results show a minimum CPU utilization U2= 0.88% for M = 0and N = 12, and maximum CPU utilizationU2 = 86.40% for M = 1 and N = 2000. The dependence is also expressed as forU1.
Figure 3. Normalized CPU utilizationU2forConcatweb service
Figure 4. Normalized CPU utilizationU2 forSortweb service
C. Test Case 3 - Scaling Factor 4
Both web services are hosted on 1 virtual machine in-stance with scaling factor 4, i.e., allocated with 4 CPU cores.
1) ConcatWeb Service: Figure 5 depicts the normalized CPU utilizationU4 for Concatweb service.
Similar increasing factor is observed compared toU1and U2. The minimum CPU utilizationU4= 0.54%is measured for N = 12 and M = 0, and maximum U4 = 63.18% is measured forN = 1500andM = 9. For small message size it performs with decreased CPU utilization in comparison to the bothU1 andU2.
2) Sort Web Service: Figure 6 depicts the normalized CPU utilizationU4 for Sortweb service.
The results show a minimum CPU utilizationU4= 0.33% for M = 0 and N = 12, and maximum CPU utilization U4 = 72.46% for M = 2 andN = 1750. The dependence and the increasing factor are similar as forU1 andU2.
V. RELATIVESCALEDCPU UTILIZATION In this section, we analyze the relative scaled CPU uti-lization while scaling the resources in test cases for both
Figure 5. Normalized CPU utilizationU4 forConcatweb service
Figure 6. Normalized CPU utilizationU4forSortweb service
web services.
A. Relative Scaled CPU Utilization forConcatWeb Service
This section presents the relative scaled CPU utilization and relative multi-core CPU utilization for Concat web service for scaling factorsn= 2 andn= 4.
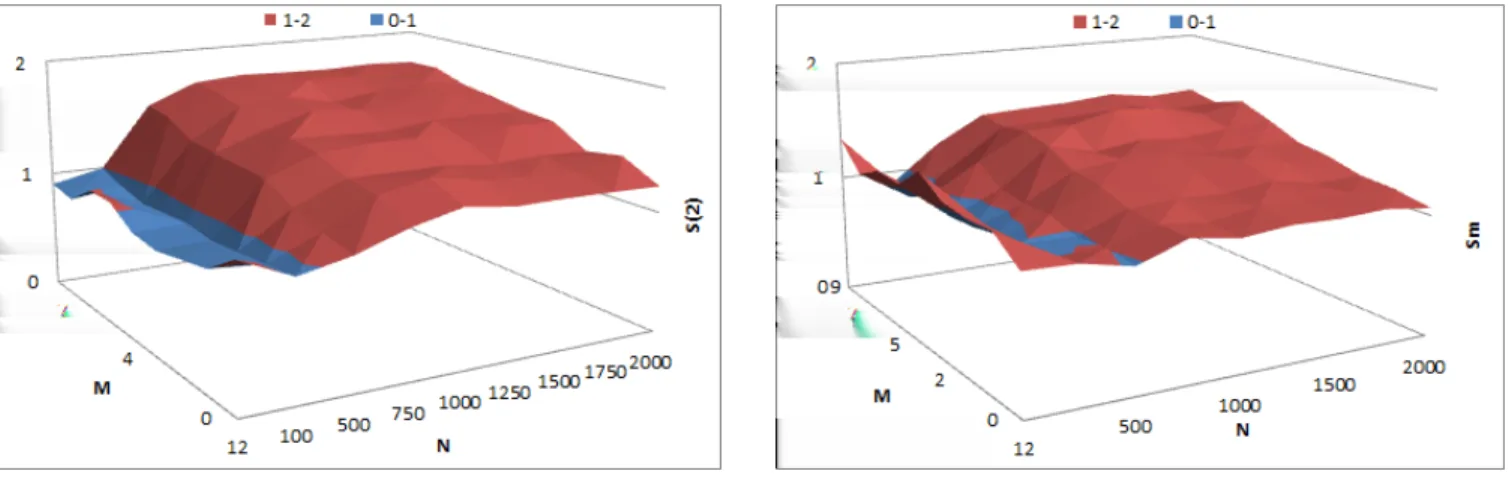
1) Scaling Factor 2: Figure 7 presents the results for relative scaled CPU utilizationS(2)forConcatweb service. We observe that S(2) < 2 for each N and M, i.e., the hypothesis H1 is satisfied. However, very unexpected result is the region for smaller N regardless of M where S(2)<1, i.e., the total CPU utilization with scaling factor 2 is reduced compared to CPU utilization without scaling. We can conclude that there is a region where the hypothesis H2 is not satisfied. Minimum and maximum values for relative scaled CPU utilization are S(2) = 0.87 and S(2) = 1.73, respectively.
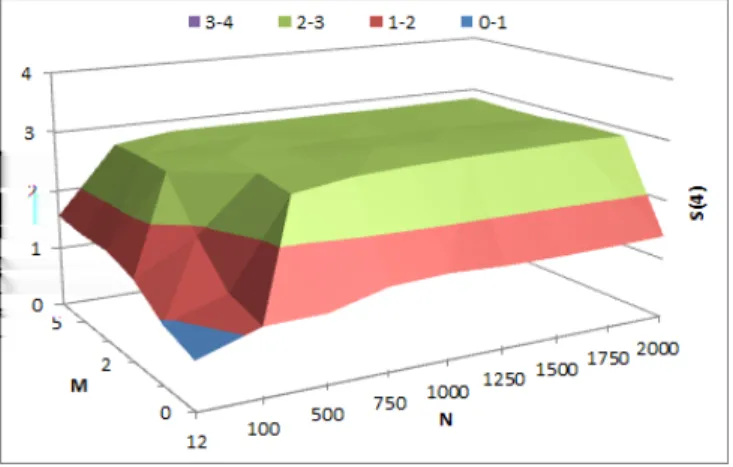
2) Scaling Factor 4: Relative scaled CPU utilizationS(4) is depicted in Figure 8.
We also observe similar results, i.e.,S(4)<4for eachN andM, i.e., the hypothesis H1 is satisfied. The same region CLOUD COMPUTING 2013 : The Fourth International Conference on Cloud Computing, GRIDs, and Virtualization
Figure 7. S(2) forConcatweb service
Figure 8. S(4) forConcatweb service
is observed where S(4) < 1 and the total CPU utilization with scaling factor 4 is reduced compared to CPU utilization without scaling. That is, the hypothesis H2 is not satisfied in the same region as scaling with 2 CPUs. Minimum and maximum values for relative scaled CPU utilization are S(4) = 0.79andS(4) = 2.56, respectively.
3) Relative Multi-core Scaled CPU UtilizationSm:
Fig-ure 9 depicts the relative multi-core scaled CPU utilization Sm forConcatweb service.
The similar conclusions can be derived asS(2)andS(4). We found that Sm < 2 for each value of parameters M
and N, and also there is the similar region for smalled N where Sm < 1. That is, the hypothesis H1 is satisfied
always, while the hypothesis H2 is not satisfied for smaller N. Minimum and maximum values for relative multi-core scaled CPU utilization are Sm = 0.87 and Sm = 1.54,
respectively.
B. Relative Scaled CPU Utilization for SortWeb Service
This section presents the relative scaled CPU utilization and relative multi-core CPU utilization forSortweb service
Figure 9. SmforConcatweb service
Figure 10. S(2) forSortweb service
for scaling factorsn= 2andn= 4.
1) Scaling Factor 2: Figure 10 depicts the relative scaled CPU utilization S(2) for Sort web service hosted on a virtual machine with 2 cores.
We observe that the hypothesis H1 is also satisfied for each N and M as for Concat web service, i.e., U2 < 2. However, opposite to Concat web service, U2 > 1 for Sort web service, i.e., the total CPU utilization is always greater while scaling with 2 CPU cores. We can conclude that the hypothesis H2 is also satisfied for each N and M. The relative scaled CPU utilization is the smallest for smaller parameters M and N. Minimum and maximum values for relative scaled CPU utilization are S(2) = 1.03 andS(2) = 1.76, respectively.
2) Scaling Factor 4: The results for relative scaled CPU utilizationS(4) are depicted in Figure 11.
We can conclude that S(4) < 4 for all values of N and M, i.e., the hypothesis H1 is also satisfied. Even more, S(4) < 3 for each M and N. We found a region for the smallest M and N where S(4) < 1, i.e., the hypothesis H2 is not satisfied in this region. That is, the
Figure 11. S(4) forSortweb service
Figure 12. SmforSortweb service
total CPU utilization is smaller while scaling the CPUs with factor 4. The relative scaled CPU utilization increases for greaterM orN. Minimum and maximum values for relative scaled CPU utilization are S(4) = 0.76 and S(4) = 2.92, respectively.
3) Relative Multi-core Scaled CPU UtilizationSm: The
similar results are observed for relative multi-core CPU utilization forSort web service, as depicted in Figure 12.
There is a region for smallerM andN whereSm <1,
i.e., the hypothesis H2 is not satisfied. For all other values for N and M the relative multi-core CPU utilization is in the range1< Sm<2. That is, both hypotheses H1 and H2
are satisfied. A local extreme exists in point (M,N) = (1, 750) whereSm= 2.37>2. Minimum and maximum values
(excluding local extreme) for relative multi-core scaled CPU utilization areSm= 0.74 andSm= 1.73, respectively.
VI. CONCLUSION ANDFUTUREWORK
In this paper, we measured and analyzed the CPU uti-lization with two web services (Concat andSort) hosted on a virtual machine instance on the cloud, while the
number of CPUs was scaled from 1 to 2 and 4 CPU cores. Web services were tested with different load determined with various message parameter size M, and number of concurrent messagesN.
We have introduced a relative scaled CPU utilization measure and a relative multi-core scaled CPU utilization for the same server load over scaled resources. The methodology is based on measurement of real CPU utilization and calcu-lation of new relative measures to make better conclusions for scaling.
The results show that normalized CPU utilization depends mostly on the number of concurrent messages for Concat web service, whileSortweb service depends on both input parameters.
Both expected and unexpected results are achieved for relative scaled CPU utilization. It is sublinear for each values of parameters N andM, proving the hypothesis H1. However, contrary to the hypothesis H2, the results show that there is a region where relative scaled CPU utilization is smaller than 1, i.e., the total CPU utilization is even smaller than unscaled test case. This region is determined for smaller N regardless of M for Concat web service, while the region for Sort web service is determined when both input parameters are small.
CPU utilization has directly impact to the power con-sumption, both for CPU working and cooling, which is a significant part of cloud total cost. Therefore, reducing the CPU utilization will greatly reduce the overall cost. In this paper, we determine the correlation between CPU utilization (cost) with the number of concurrent messagesN and their parameter sizeM using two different web servicesConcat andSort.
We will analyze the other performance parameters, such as response time for both web services in order to determine the tradeoffs between performance, cost and CPU utilization while scaling the resources on the cloud. Another important analysis will be performed to determine the platform impact (various operating systems and web servers) on CPU utiliza-tion in the cloud, using different clouds and hypervisors.
REFERENCES
[1] Q. Zhang, L. Cheng, and R. Boutaba, “Cloud computing: state-of-the-art and research challenges,” Journal of Internet Services and Applications, vol. 1, no. 1, 2010, pp. 7–18. [2] A. Berl, E. Gelenbe, M. Di Girolamo, G. Giuliani,
H. De Meer, M. Dang, and K. Pentikousis, “Energy-efficient cloud computing,” The Computer Journal, vol. 53, no. 7, 2010, pp. 1045–1051.
[3] L. Mei, W. Chan, and T. Tse, “A tale of clouds: Paradigm comparisons and some thoughts on research issues,” in Asia-Pacific Services Computing Conf., 2008. APSCC ’08. IEEE, 2008, pp. 464 –469.
[4] S. Ostermann, A. Iosup, N. Yigitbasi, R. Prodan, T. Fahringer, and D. Epema, “A performance analysis of EC2 cloud com-puting services for scientific comcom-puting,” Cloud Comcom-puting, 2010, pp. 115–131.
[5] K. Xiong and H. Perros, “Service performance and analysis in cloud computing,” in Services-I, 2009 World Conference on. IEEE, 2009, pp. 693–700.
[6] D. Durkee, “Why cloud computing will never be free,” Queue, vol. 8, no. 4, Apr. 2010, pp. 20:20–20:29.
[7] A. Beloglazov and R. Buyya, “Energy efficient allocation of virtual machines in cloud data centers,” in Cluster, Cloud and Grid Computing (CCGrid), 2010 10th IEEE/ACM Interna-tional Conference on, may 2010, pp. 577 –578.
[8] M. Gusev and S. Ristov, “The optimal resource allocation among virtual machines in cloud computing,” in CLOUD COMPUTING 2012, The Third International Conference on Cloud Computing, GRIDs, and Virtualization, 2012, pp. 36– 42.
[9] K. Saleh and R. Boutaba, “Estimating service response time for elastic cloud applications,” in 2012 IEEE 1st Inter-national Conference on Cloud Networking (CLOUDNET) (IEEE CloudNet’12), Paris, France, Nov 2012, pp. 12–16. [10] M. Gusev, G. Velkoski, S. Ristov, and M. Simjanoska, “Web
service CPU overutilization in the cloud,” in the 6th Interna-tional Conference on Information Technology, ser. ICIT 2013, Amman, Jordan, in press.
[11] G. Velkoski, M. Simjanoska, S. Ristov, and M. Gusev, “CPU utilization in a multitenant cloud,” in EUROCON - Interna-tional Conference on Computer as a Tool (EUROCON), 2013 IEEE, in press.
[12] Y. O. Yazir, C. Matthews, R. Farahbod, S. Neville, A. Gui-touni, S. Ganti, and Y. Coady, “Dynamic resource alloca-tion in computing clouds using distributed multiple criteria decision analysis,” in Proceedings of the 2010 IEEE 3rd International Conference on Cloud Computing, ser. CLOUD ’10. Washington, DC, USA: IEEE Computer Society, 2010, pp. 91–98.
[13] E. Ciliendo and T. Kunimasa, Linux Performance and Tuning Guidelines, 1st ed. ibm.com/redbooks, Jul. 2007.
[14] E. T. G. de Sousa, P. R. M. Maciel, E. M. Medeiros, D. S. L. de Souza, F. A. A. Lins, and E. A. G. Tavares, “Evaluating eucalyptus virtual machine instance types: A study considering distinct workload demand,” in CLOUD COMPUTING 2012, The Third International Conference on Cloud Computing, GRIDs, and Virtualization, 2012, pp. 130– 135.
[15] Eucalyptus Systems. Eucalyptus cloud. [Retrieved: March, 2013]. [Online]. Available: http://www.eucalyptus.com/ [16] G. Wang and T. S. E. Ng, “The impact of virtualization
on network performance of amazon EC2 data center,” in Proceedings of the 29th conference on Information commu-nications, ser. INFOCOM’10. Piscataway, NJ, USA: IEEE Press, 2010, pp. 1163–1171.
[17] M. Hovestadt, O. Kao, A. Kliem, and D. Warneke, “Evalu-ating adaptive compression to mitigate the effects of shared I/O in clouds,” in Parallel and Distributed Processing Work-shops and Phd Forum (IPDPSW), 2011 IEEE International Symposium on, 2011, pp. 1042–1051.
[18] G. Vilutis, L. Daugirdas, R. Kavaliunas, K. Sutiene, and M. Vaidelys, “Model of load balancing and scheduling in cloud computing,” in Information Technology Interfaces (ITI), Proceedings of the ITI 2012 34th International Confer-ence on, june 2012, pp. 117 –122.
[19] D. Jayasinghe, S. Malkowski, Q. Wang, J. Li, P. Xiong, and C. Pu, “Variations in performance and scalability when mi-grating n-Tier applications to different clouds,” in Proceedings of the 2011 IEEE 4th International Conference on Cloud Computing, ser. CLOUD ’11. Washington, DC, USA: IEEE Computer Society, 2011, pp. 73–80.
[20] OpenStack Cloud Software, “Openstack cloud,” [Retrieved: March, 2013]. [Online]. Available: http://openstack.org [21] SoapUI, “Functional testing tool for web service testing,”
[Retrieved: March, 2013]. [Online]. Available: http://www. soapui.org/
[22] M. Juric, I. Rozman, B. Brumen, M. Colnaric, and M. Her-icko, “Comparison of performance of web services, WS-security, RMI, and RMI–SSL,” Journal of Systems and Soft-ware, vol. 79, no. 5, 2006, pp. 689–700.