PUBLIC UTILITY FLEET MANAGEMENT:
ACTIVITY BASED COSTING METHOD
APPLICATION
Aleksandar Manojlović, Faculty of Transport and Traffic Engineering, University of Belgrade, Serbia, [email protected]
Olivera Medar, Faculty of Transport and Traffic Engineering, University of Belgrade, Serbia, [email protected]
Dragana Drenovac, Faculty of Transport and Traffic Engineering, University of Belgrade, Serbia, [email protected]
Snežana Filipović, Faculty of Transport and Traffic Engineering, University of Belgrade, Serbia, [email protected]
ABSTRACT
Public companies’ fleets are often composed of several hundreds of vehicles of different categories. Within the complex organization structure, the fleets are providing support for the company’s core activities. The vehicles are used by company’s departments for different purposes, i.e. such departments represent users of Fleet department’s vehicles and services. The vehicles of the same categories used by different users significantly vary in matter of travelled distances, hours in operation and costs. Activities´ costs give impression of the effectiveness of fleet resource usage and to what extent important activities contribute to the services´ costs. Those information represent a key issue in the decision-making process on eventual restructuring of the Fleet Department or while outsourcing some of the activities..
possible to identify the amount of the FD overhead, while the detailed data collection on transport costs requires additional efforts and investments.
Developed procedure for transport cost allocation within a public company and for setting a rate regarding the transport service’s cost coverage is presented. Applying Activity Based Costing gives more precisely and trustworthy basis for the transport cost allocation regarding the usage of vehicles. Determination of the transport direct costs and overhead amounts, and overhead allocation to services, performed by the FD, as well to vehicle groups and to specific user, by using the Activity Based Costing model are first activities of the procedure. Using the costs data obtained from described activities we could obtain information on the rates of services realized by the FD, vehicle usage rate upon vehicle-kilometre, and amounts charged to the departments. Creation of different rates is allowed for the vehicle usage upon categories and different users. Determined FD activity cost levels are valuable information for decision making about which services and in what extents should be preserved within the company and which ones will be outsourced.
Previously defined procedure has been illustrated through a case study of public utility company in Belgrade, with a fleet of more than 400 vehicles classified in ten groups, within nine departments. Charged costs of vehicle-kilometres for certain users are differing for as much as 50%, influencing the size of the fleet.
FLEET COSTS
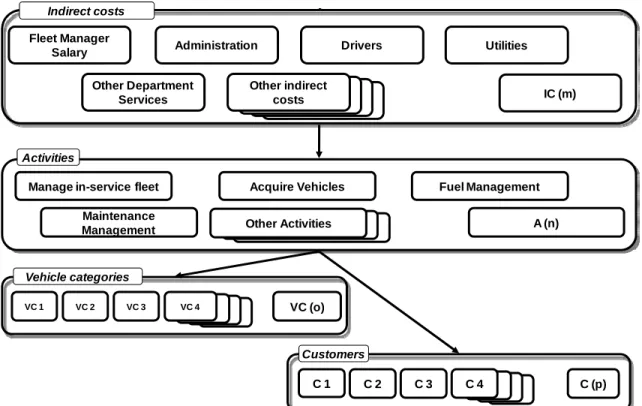
The knowledge of the level of realized costs and cost efficiency parameters, as unit costs per kilometre travelled, realized jorney and hours in operation, enables operation results analysis and represents a basis to for comparisons to other vehicle fleets. To provide a basis for cost management and monitoring, as well as to assure a referential foundation for measuring the cost control effectiveness, it is indispensable to standardize vehicle and fleet costs (Lauria and Owen, 2004). The Figure 1 show particular cost category, activities and cost objects of the transport subsystem.
KT (...)
KT (...) KT (...) KT (6) Fleet Manager
Salary Administration Drivers Utilities
Other Department Services Indirect costs
Fuel Management Manage in-service fleet Acquire Vehicles
Maintenance Management Activities Other indirect costs IC (m) KT (...) KT (6) Other Activities A (n) Vehicle categories VC 1 VC 2 VC 3 VC 4 VC (o) C 1 C 2 C 3 C 4 C (p) Customers
Figure 1 – Cost category, activities and cost objects
The procedure for transport overhead allocation within a public company and for setting the rate regarding the transport service's cost coverage, more precisely regarding the usage of vehicles established on the Activity Based Costing consists of several steps. Determination of the the transport direct costs and overhead is the first step (Roztocki et al., 1999). Afterwards overheads are allocated to the FD services, to the group of vehicles and to users by using the Activity Based Costing model (Figure 2).
Identifying Main Activities
Determining Costs Categories
Determining Dependence Costs and Activities Identifying Main Activities
Determining Costs Categories
Determining Dependence Costs and Activities
Based on obtained costs data, the information on services rates, vehicle usage rate upon vehicle-kilometre and tehe amounts charged to the departments, could also be achieved. The creation of different rates is allowed for the vehicle usage upon categories and different users. Determined Fleet department activity costs allows the decision makers to decide which services and in what extents will be preserved within the company and which ones will be outsourced.
CASE STUDY
Previously defined procedure has been implemented in one public utility company in Belgrade, whose fleet is composed of 409 vehicles sorted in ten categories within nine departments.
The transport process as a supporting process to the core company process is decentralized in such a way that it is integrated into sectors’, functions’ and administration’s – vehicle users where the core processes are performed. On the other hand, there is a central Transport organization unit (FD) with competencies in particular segments of the transport process. Vehicles are designated for fulfillment of particular users’ needs within a sector, and any assistance is effected neither between vehicles belong to the same sector nor among specific sectors, regarding vehicle loan and/or exchange.
Fleet Department activities are: administrative activities, analysis of customers’ activities, acquisition and re-market of vehicles, vehicle condition verification and certification, fleet maintenance management, fuel management and transport. Cost categories and cost drivers are presented in Table 1.
Table 1 – Cost categories and cost drivers
Cost categories € Cost driver
Fleet manager salary 66.324 Time (h)
Maintenance manager salary 24.509 Time (h)
Driver salary 42.300 Time (h)
Mechanics salary 93.323 Time (h)
Utilities 114.286 Space (m2)
Office costs 15.662 Level of use of office resources (%)
Other department services 76.314 Level of use of other department
services (%)
Driver cost of own vehicles 6.830 Distance (km)
Driver costs of special vehicles 15.360 Distance (km)
∑454.908
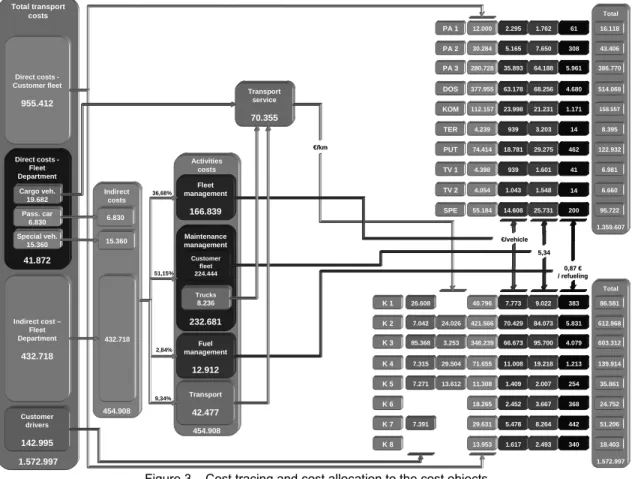
Figure 3 presents the results of cost tracing and cost allocation to the the cost object (vehicles categories and fleet customers) and Figure 4 shows fleet costs and activities’ costs.
Total transport costs 1.572.997 Total 1.359.607 Total 1.572.997 Activities costs 454.908 Indirect costs 454.908 Direct costs -Customer fleet 955.412 Direct costs -Fleet Department 41.872 Indirect cost – Fleet Department 432.718 Customer drivers 142.995 12.000 30.284 280.728 377.955 112.157 4.239 74.414 4.398 4.054 55.184 40.796 421.566 348.239 71.655 11.308 18.265 29.631 13.953 Pass. car 6.830 Cargo veh. 19.682 Special veh. 15.360 PA 1 PA 2 PA 3 DOS KOM TER PUT TV 1 TV 2 SPE K 1 K 2 K 3 K 4 K 5 K 6 K 7 K 8 6.830 15.360 432.718 Fleet management 166.839 Maintenance management 232.681 Fuel management 12.912 Transport 42.477 Customer fleet 224.444 Trucks 8.236 Transport service 70.355 7.773 70.429 66.673 11.008 1.409 2.452 5.478 1.617 9.022 84.073 95.700 19.218 2.007 3.667 8.264 2.493 383 5.831 4.079 1.213 254 368 442 340 24.026 3.253 29.504 13.612 26.608 7.042 85.368 7.315 7.271 7.391 86.581 612.968 603.312 139.914 35.861 24.752 51.206 18.403 2.295 5.165 35.893 63.178 23.998 939 18.781 939 1.762 7.650 64.188 68.256 21.231 3.203 29.275 1.601 61 308 5.961 4.680 1.171 14 462 41 1.043 14.608 1.548 25.731 14 200 € €//vehiclevehicle 5,34 5,34 0,87 0,87 €€ / / refuelingrefueling € €/km/km 16.118 43.406 386.770 514.068 158.557 8.395 122.932 6.981 6.660 95.722 36,68% 51,15% 2,84% 9,34%
Figure 3 – Cost tracing and cost allocation to the cost objects
. In d ir ect co st s 4,02% 3,09% 3,12% 1,16% 12,27% 16,51% 0,95% Outsourced Maintenance Own Maintenance Washing Tires Fleet Management Maintenance Management Fuel Management € per vehicle
5,34€ per 1€ used spare parts and materials 0,87€ per refueling 70,27% 29,73% Rates t co st s 100%
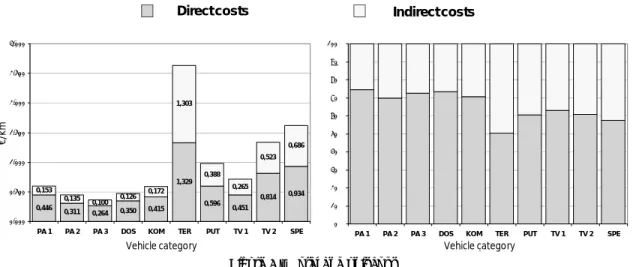
The cost structure and values of total and unit costs with included activities’ costs, sorted by vehicle groups (Figure 5), are well-suited for recognition of the possible fleet operation enhancements in the phase of vehicle ownership model definition and for considereation of the subcontractors’ engagement and choice. Besides, this is an important element in the decision-making regarding fleet dimension and also provides a basis for the chargeback system establishment. 0,446 0,311 0,264 0,350 0,415 1,329 0,596 0,451 0,814 0,934 0,153 0,135 0,100 0,126 0,172 1,303 0,388 0,265 0,523 0,686 0,000 0,500 1,000 1,500 2,000 2,500 3,000
PA 1 PA 2 PA 3 DOS KOM TER PUT TV 1 TV 2 SPE
Grupa vozila Jedi ni č n i tr o šk o vi ( € /k m ) 0% 10% 20% 30% 40% 50% 60% 70% 80% 90% 100%
PA 1 PA 2 PA 3 DOS KOM TER PUT TV 1 TV 2 SPE
Grupa vozila U č eš ć e Indirect costs Direct costs €/ km
Vehicle category Vehicle category
Figure 5 – Total and unit cost
Different vehicle groups "spend" activities in different amounts. The value and structure of annual indirect costs per vehicle is shown in Figure 6. In relation to the origination moment, the activities’ costs are composed of a fixed part, costs of activity "Fleet Management", and variable part, costs of activity "Maintenance Management" and "Fuel Management".
1.148 574 209 365 1.043 470 1.043 939 1.043 1.826 881 850 373 395 923 1.601 1.626 1.601 1.548 3.216 25 14 26 7 51 41 30 34 35 27 0 1.000 2.000 3.000 4.000 5.000 6.000
PA 1 PA 2 PA 3 DOS KOM TER PUT TV 1 TV 2 SPE
Grupa vozila V re d no st in di re kt ni h t roš ko va (€ ) 0% 10% 20% 30% 40% 50% 60% 70% 80% 90% 100%
PA 1 PA 2 PA 3 DOS KOM TER PUT TV 1 TV 2 SPE
Grupa vozila U č eš ć e Fuel Management Maintenance Management Fleet Management €/ km
Vehicle category Vehicle category
Figure 6 – Cost of main activities
Activities’ costs give an impression about effectiveness of the fleet resource usage and to what extent important activities contribute to the services’ costs.
CONCLUSIONS
This paper presents the procedure for transport overhead allocation within a public company and for setting the rate regarding the transport service's cost coverage, more precisely regarding the usage of vehicles established on the Activity Based Costing. Recommended procedure ensures a high-quality basis for the decision making regarding fleet utilization strategies, especially in matter of public companies' fleets. The cost structure with incorporated activities’ costs is suitable for the recognition of possible enhancements and for the decision-making in matter of vehicle fleet dimensioning. Information on activities’ costs represents a key issue in the decision-making process about eventual restructuring of the Fleet Department or while outsourcing some of the activities.
REFERENCES
Lauria, P., and Owen. R. (2004). Managing Managed Competition. NAFA`s Fleet Management Institute
Roztocki, N., Valenzuela, J., Porter, J., Monk, R. and K. Needy (1999). A Procedure for Smooth Implementation of Activity Based Costing in Small Companies, Proceedings from the ASEM National Conference, American Society for Engineering Management