Mobile backhaul market:
Phase 1 report
27 February 2014
Dr James Allen, Dr Franck Chevalier, Burcu Bora
Ref: 39013-86
Contents
1 Introduction 3
2 LTE capacity evolution 5
2.1 Introduction 5
2.2 Primary factors affecting LTE throughput 5
2.3 LTE radio capacity roadmap 7
2.4 Typical operator LTE roadmap 8
3 Microwave technology assessment 11
3.1 Introduction 11
3.2 Primary factor affecting microwave capability 11
3.3 Typical microwave capacity 15
4 Suitability of microwave backhaul for LTE network 18
4.1 Topology and reference network 18
4.2 How much capacity is required for LTE sites? 19
4.3 Results 21
Confidentiality Notice: This document and the information contained herein are strictly private and confidential, and are solely for the use of Vodafone.
Copyright © 2014. The information contained herein is the property of Analysys Mason Limited and is provided on condition that it will not be reproduced, copied, lent or disclosed, directly or indirectly, nor used for any purpose other than that for which it was specifically furnished.
Analysys Mason Limited Bush House, North West Wing Aldwych
London WC2B 4PJ UK
Tel: +44 (0)20 7395 9000 Fax: +44 (0)20 7395 9001 london@analysysmason.com www.analysysmason.com
1
Introduction
1.1.1Background
The European regulatory framework for electronic communications imposes ex-ante regulatory remedies on operators found to have significant market power (SMP) in „relevant markets‟ as a result of a formal market review by their national regulatory authority (NRA). The markets to be assessed are either taken from the Commission‟s recommendation on relevant markets susceptible to ex-ante regulation, or can be analysed by the NRA subject to the NRA showing that the relevant market passes a so-called „triple test‟. A market that is not in the recommendation but is so defined by the NRA is subject to a Commission veto through the so-called Article 7 process.
1.1.2Mobile operators’ needs
Each mobile operator needs to connect its base stations with its core network electronics; these links from the base station back in to the core are often referred to as “backhaul”. These links are, or are based on1, leased lines (with a variety of interfaces, usually SDH or Ethernet). The mobile operator has a variety of options to provide these links:
building its own links, often using microwave point to point radio
leasing commercial inputs, where these are available
buying regulated inputs from the SMP operators. In many EU countries there exists a variety of regulated wholesale leased line inputs.
While the fixed incumbent operator may well have access to a fibre-based input as a matter of course, these inputs are not always made available to competing operators as a wholesale or retail product with the desired interface, quality, speed, or price. The fact that the required inputs are not available, or are extremely expensive, may dampen competition in the mobile market in some countries because the incumbent fixed operator is usually (with the exception of the UK) a major mobile operator and can gain benefits as a result of this vertical integration – specifically the much greater capillarity of their fibre network.
A variety of different base station types are deployed in modern network deployments and may have slightly different needs and face different constraints, especially in different geographies. In this document we look at Urban macrocells, Urban small cells, and Rural macrocells.
1.1.3Revised recommendation on relevant markets
The European Commission has recently launched a short four-week consultation on a revised recommendation containing a list of relevant markets. The proposed list of relevant markets does not include a business-focussed wholesale broadband access market (which might also have been
1
For example, an MPLS network could be based on an Ethernet point to point connection from an aggregation node to each base station.
useful for cell site backhaul), and instead contains (omitting the irrelevant markets for this purpose):
Market 3:
– a) Wholesale local access provided at a fixed location
– b) Wholesale central access provided at a fixed location for mass-market products
Market 4: Wholesale high-quality access provided at a fixed location.
Market 4 of the new proposal is the market of most interest to this study.
1.1.4This document
This document is the final report of phase 1 of a study for Vodafone. It examines the extent to which microwave point to point radio can support the provision of cell site backhaul over the lifetime of the recommendation on relevant markets, examines the extent to which operators with highly capillary fibre networks use fibre instead, and draws conclusions regarding the regulation of these markets.
The remainder of this document is laid out as follows:
Section 2 explores the capacity evolution of LTE , considering both the evolution of the standards and the typical roadmap of European MNOs
Section 3 describes the capability of microwave systems and considers the potential challenges associated with the deployment of these systems
Section 4 provides an assessment of the capacity of microwave systems compared with the demand of LTE sites for different deployment scenarios
2
LTE capacity evolution
2.1
Introduction
The increase of mobile broadband service speeds enabled by LTE networks compared with 2G and 3G networks puts additional strains on cell site backhaul networks. Not only are the transport capacity requirements of backhaul networks significantly higher than those required for 3G networks, there is also a fundamental shift from TDM transport (in 2G and 3G2) backhaul to packet Ethernet/IP transport backhaul required for „all-IP‟ LTE networks.
In order to estimate the current and future backhaul capacity requirements of LTE cell sites, it is important to first understand the evolution of the LTE standards, as specified by the 3GPP standardisation body.
In this section, we first describe the factors affecting the supply side of LTE capacity evolution i.e. the improvement in performance created by technological development. We then highlight the current and future theoretical performance in terms of throughput as specified by the 3GPP standards. As improvements in performance are associated with specific 3GPP standards releases we then describe an expected standards release roadmap (i.e. what technology will be deployed when).
2.2
Primary factors affecting LTE throughput
In the following sections, we present the 3GPP capacity roadmap for 4G networks in terms of maximum theoretical peak throughput they can achieve.
The evolution of the 4G roadmap is based on the following primary factors:
Radio frequency modulation scheme
Antenna configuration
Spectrum bandwidth
2.2.1Modulation scheme
The broadband speed a user can access is highly dependent upon the radio frequency modulation scheme the mobile network can provide. In simple terms, the modulation scheme relates to the amount of information that can be sent in a single pulse (the more information per pulse, the higher the throughput). In technical terms, the modulation scheme relates to the number of bits that can be encoded per symbol e.g:
2
QPSK (also known as 4 QAM3) –enables four states or two bits to be encoded per symbol
16 QAM –enables 16 states or 4 bits to be encoded per symbol
64 QAM –enables 64 states or 6 bits to be encoded per symbol.
Therefore, a 64 QAM modulated signal will transmit three times as much as information per second compared with a QPSK modulated signal, which means that the throughput of a system using 64 QAM frequency modulation will be trebled compared to a QSPK system.
However, higher-order modulation schemes (i.e., 64 QAM) are much more affected by noise than lower modulation schemes (i.e. QPSK). This implies that a 64 QAM signal will require a significantly better Signal to Noise Ratio (SNR) than a QPSK modulated signal to have comparable bit error rates at the receiver. As a consequence, the area covered by a 64 QAM signal will be significantly smaller than the area covered by a QPSK signal.
In practical systems, users close to the cell site will be able to benefit from a 64 QAM modulated signal and therefore from the highest possible throughput offered by the system deployed. However, users far away from the cell site may only be able to use a lower frequency modulation scheme (e.g. QPSK) due to the decrease in SNR and therefore will only have access to lower speed services. In particular, end-users in rural areas will get a lower modulation scheme than end-users in urban areas4, which means that rural end users will benefit from a lower throughput than their urban counterparts.
2.2.2Antenna configuration
The most basic antenna configuration is a single antenna at the cell site and a single antenna at the user equipment (UE). This is known as a Single Input Single Output system (SISO). However, to increase the throughput of 3G and 4G mobile networks, 3GPP standards have introduced the possibility of using Multiple Input Multiple Output (MIMO) antenna systems. MIMO uses several antennas to transmit and receive to improve performance. Performance is improved by mathematically correlating all the signals transmitted and received by the different antennas by using digital signal processors. The benefit achieved is higher spectral efficiency, that is, more bits per second per hertz of radio spectrum being used. For example a spectral efficiency of 1.2 bit/s/Hz using 20MHz of radio spectrum will provide 24 Mbit/s of throughput i.e. 1.2 bit/s/Hz x 20MHz.
Below, we define some possible antenna configurations specified by the 3GPP standards:
SISO means that both the transmitter and the receiver have a single antenna
2x2 MIMO system means that both the transmitter and the receiver have 2 antennas
4x4 MIMO system means that both the transmitter and the receiver have 4 antennas
The more antennas, the higher the throughput of the system.
3
Quadrature Amplitude Modulation
4
2.2.3Spectrum Bandwidth
Throughput of LTE cell sites is directly dependent on the amount of spectrum available. LTE (3GPP R8 and R9 standards) is able to use a range of carrier bandwidths (1.4, 3, 5, 10, 15 and 20MHz), providing more spectrum flexibility for operators. However, LTE-Advanced (LTE-A), defined in 3GPP standard R10 uses a flexible carrier bandwidth up to 100MHz, made more practical by the fact that the spectrum does not have to be contiguous (i.e. carrier aggregation).
All other things being equal, an operator deploying its network on a 20MHz carrier will be able to offer double the capacity compared with an operator deploying its LTE network on a 10MHz carrier.
2.3
LTE radio capacity roadmap
Long term evolution (LTE) technology is a more spectrally efficient5 technology than HSPA/HSPA, which means higher throughputs can be achieved with LTE using the same amount of spectrum.
There are different variants of LTE and the first release (Release 8) was standardised by 3GPP in 2008, but commercial launch started in 2009. LTE Release 8 and 9 operate in a carrier bandwidth of up to 20 MHz (1.4, 3, 5, 10, 15 and 20MHz). However LTE Release 10 to 12, commonly referred to as LTE advanced, can use up to 100 MHz and can (depending on the modulation scheme chosen and the use of MIMO) deliver theoretical throughput of up to 3Gbit/s per sector.
Figure 2.1 provides a summary of the improvement in throughput and spectral efficiency for the current and future LTE releases.
Figure 2.1: Peak download speed for LTE roadmap [Source: Analysys Mason, 2014] 3GPP
release
Category Modulation Antenna configuration Carrier bandwidth (MHz) Peak download speed per sector (Mbit/s) Peak spectral efficiency (bps/Hz) Average spectral efficiency for Urban (bps/Hz)
8 1 64 QAM SISO 5 10.3 2.06 0.35
8 2 64 QAM 2x2 MIMO 10 51 5.1 0.86
8 3 64 QAM 2x2 MIMO 15 102 6.8 1.13
8 4 64 QAM 2x2 MIMO 20 150.8 7.54 1.28
8 5 64 QAM 4x4 MIMO 20 299.6 14.98 2.49
10 6 64 QAM 2x2 MIMO 20 301.5 15.07 2.50
10 7 64 QAM 2x2 MIMO 20 301.5 15.07 2.50
10 8 64 QAM 4x4 MIMO 50 984.6 19.68 3.27
10 8 64 QAM 8x8 MIMO 100 2998.6 29.99 5.08
5
In Figure 2.1, Peak Spectral Efficiency relates to the maximum theoretical spectrum efficiency LTE networks can deliver and the Average Spectral Efficiency relates to practical spectrum efficiency in the field. Average spectrum efficiency is significantly less than Peak spectral efficiency because, in reality, not many users can benefit from the highest modulation scheme available because they are too far from the site (see section 2.2.1). The average spectral efficiency in rural areas is typically 50% of that of urban areas for the above reason.
2.4
Typical operator LTE roadmap
Based on the above 3GPP release specifications and on their projection for future traffic demand, European operators have defined their future roadmap in terms of what LTE standards they will use for their RAN when. We describe the roadmap for Urban Macro sites, Rural Macro sites and Urban small cell sites in the following sections.
2.4.1Operator LTE roadmap for Urban Macro Sites
Figure 2.2 illustrates a typical mobile operator Roadmap for Urban Macro sites.
Figure 2.2: A typical mobile operator roadmap for Urban Macro sites [Source: Analysys Mason, 2014]
Year Spectrum
(MHz)
Peak spectral efficiency
Average spectral efficiency
Theoretical peak throughput per sector (Mbit/s)
Average throughput per 3 sector site (Mbit/s)
2014 20 6.8 1.13 136 68
2015 30 6.8 1.13 204 102
2016 30 15.07 2.50 452 225
2017 30 15.07 2.50 452 225
2018 50 15.07 2.50 754 376
2019 50 19.68 3.27 984 491
2020 70 19.68 3.27 1378 687
In 2014, typical mobile operators have deployed LTE Release 8 (category 4) in most European countries, using 20 MHz carriers, 64 QAM and a 2x2 MIMO antenna system. This means that the maximum theoretical peak throughput per sector that can be achieved is 136Mbit/s6 and the average throughput per site is 68Mbit/s7.
In 2015, typical mobile operators plan to acquire or refarm 10 MHz of additional spectrum for the LTE, increasing their spectrum to 30MHz and use LTE Release 8 (category 4)increasing the
6
20MHz x 6.8bps/Hz
7
theoretical peak throughput per sector to 204Mbit/s and the average throughput per site to 102 Mbit/s.
In 2018, typical mobile operators plan to acquire or refarm 20 MHz of additional spectrum for the LTE to have 50MHz of Spectrum. This increase in spectrum bandwidth will increase the theoretical peak throughput per sector to 754 Mbit/s and the average throughput per site to 376 Mbit/s. It should be noted that with LTE R10, spectrum bandwidth does not have to be contiguous.
In 2019, the LTE network will be upgraded to LTE Release 10 (category 8), which will increase the spectrum efficiency and therefore increase the theoretical peak throughput per sector to 984 Mbit/s and the average throughput per site to 491 Mbit/s.
Finally, in 2020, typical mobile operators plan to plans to acquire or refarm 20 MHz of additional spectrum for the LTE to have 70MHz of Spectrum, increasing the theoretical peak throughput per sector to 1378 Mbit/s and the average throughput per site to 687 Mbit/s.
2.4.2Typical mobile operator LTE roadmap for Rural Macro Sites
Figure 2.3 illustrates a typical mobile operator roadmap for Rural Macro sites.
Figure 2.3: A typical mobile operator roadmap for Rural Macro sites [Source: Analysys Mason, 2014]
Year Spectrum
(MHz)
Theoretical Peak spectral efficiency
Average spectral efficiency
Theoretical peak throughput per sector (Mbit/s)
Average throughput per 3 sector site (Mbit/s)
2014 15 6.8 0.57 102 25
2015 15 6.8 0.57 102 25
2016 15 15.07 1.05 226 47
2017 20 15.07 1.30 301 78
2018 20 15.07 1.30 301 78
2019 20 19.68 1.70 394 102
2020 30 19.68 1.70 590 153
For rural sites, typical mobile operators plan to follow the same LTE roadmap as for urban sites. However, they also plan to use less spectrum in rural environment because of a lower demand from end-users in terms of capacity. It should also be noted that the average spectrum efficiency will be less than in urban areas mainly because users will typically be further away from LTE site (see section 2.2.1 for more details).
2.4.3LTE roadmap for urban small cell sites
Figure 2.4: Typical mobile operator roadmap for Urban small cell sites [Source: Analysys Mason, 2014]
Year Spectrum
(MHz)
Theoretical Peak spectral efficiency
Average spectral efficiency
Theoretical peak throughput per sector (Mbit/s)
Average throughput per site (Mbit/s)
2014 20 6.8 2.26 136 45
2015 20 6.8 2.26 136 45
2016 20 15.07 5 301 100
2017 20 15.07 5 301 100
2018 40 15.07 5 603 200
2019 40 19.68 6.54 787 262
2020 40 19.68 6.54 787 262
Again, for small cell sites, typical mobile operators plan to follow the same LTE roadmap as for Urban Macro Sites. However, they plan to dedicate 20MHz of spectrum for LTE/WiFi small sites until 2017. Typical mobile operators plan to increase their spectrum to 40MHz from 2018 to respond to the increasing demand of end users.
In Figure 2.4, it should be noted that the assumed average spectrum efficiency is doubled compared to the average spectrum efficiency of urban macro sites. This is because, in a small cell, users will typically be less than 500m away from the site, benefiting from an increased modulation scheme compared to users connecting to a Macro urban site.
Finally, we also assumed that a typical small cell will have a single sector (compared to 3 sectors for an urban macro cell).
3
Microwave technology assessment
3.1
Introduction
Microwave point to point links represent a significant proportion of backhaul deployed by non-incumbent operators today. With the advent of LTE, many operators worry that microwave solutions may not provide the necessary scalability to support the bandwidth increases associated with these services in the future. In this section we assess the capability of microwave systems.
3.2
Primary factor affecting microwave capability
In microwave systems, five primary factors affect the throughput of microwave systems:
Spectrum band
Spectrum bandwidth
Frequency modulation scheme
Compression techniques
Cross polarisation interference cancellation technology
We discuss each of these parameters in the following sections.
3.2.1Spectrum band
Traditionally, microwave bands have been licenced in the 6GHz to 42GHz bands in Europe. In addition, systems are now being deployed in the millimetre wave band (also called “E-Band”) that is between 60GHz and 100GHz, as illustrated in Figure 3.1.
Figure 3.1: Example of Microwave bands [Source: Sub-10 systems, 2014]8
8
First it is important to state three key principles associated with microwave bands:
Due to propagation characteristics (higher absorption and lower diffraction around obstacles), the higher the frequency band, shorter the link length.
The higher the frequency band, the larger the typical spectrum bandwidth available and thus the higher the throughput of microwave system, all other things being equal
Systems using 6GHz spectrum and above need a line of sight to meet their operational requirements.
Traditional microwave spectrum and higher frequencies require line of sight. Typically, this is not an issue for Urban macro sites as there are many opportunities to find a “high site” (e.g. on the top of a multiple storey building) that can be seen from the base station. In rural sites, line of sight is usually not an issue for most sites (except for 5-10% of the sites due to terrain reasons). However, for small cells, line of sight might be a significant issue because microwave equipment is typically just above street level and there may be many obstacles in the urban environment.
We describe the traditional microwave bands and the millimeter wave bands (E-Band) in the following subsections.
Traditional microwave bands
Traditional microwave bands can be decomposed into two sub-bands:
6GHz to 23GHz sub-band
26GHz to 42GHz sub-band
Typically, 6GHz to 23GHz sub-band spectrum is used by MNOs to deploy microwave in rural areas, which typically need longer hops (between 2-15 km). This this because this sub-band supports longer “hop” distances, than the higher frequency sub-bands, and this greater “hop” length is important for rural cell sites which tend to be further away from the operators‟s fibre network nodes. However, this sub-band is becoming congested in rural areas because most operators use this band.
26GHz to 42GHz sub-band spectrum is typically used by MNOs to deploy backhaul for urban cell sites. This is because, urban cell sites are typically within 3 km of the MNO fibre network and microwave systems using 26GHz to 42GHz sub-band can achieve this hop distance. However, this sub-band is also becoming congested (in urban areas) due to heavy use by operators.
Millimetre wave bands (E-Band)
E-Band microwave systems are starting to also be deployed in the countries where the band has been licensed. There exits three different licensing regimes for the E-Band:
E-Band is not yet available in some countries
E-Band is lightly licensed in some countries (e.g. UK)
E-Band is fully licensed in some country (e.g. Spain, France, Germany, the Netherlands)
► Lightly licensed E-Band case study: UK
In the UK, In March 2007, after considerable public consultation, the UK Office of Communications (Ofcom) opened up the e-band frequencies in the UK9 under a “light licensed” regime, with point to point fixed wireless licenses obtained rapidly and at a relatively low cost – currently £50 per year.
Currently, Ofcom administers the E-band frequencies under an interim manual licensing and link registration processes10. In the process to obtain the license, the applicant first applies to Ofcom to become a nationwide licensee, and can then apply for any number of individual link licenses. Responsibly for interference analysis rests with the licensee, who needs to check Ofcom‟s link database prior to link registration (links are protected on a “first come, first served” basis). This self-coordination aspect significantly reduces Ofcom‟s administration costs.
► Fully licensed E-Band case study: France
Spain France Germany and the Netherlands have all opened up the E-band using a fully licensed regime. In France for example, the applicant has to apply for individual links to the ARCEP. The ARCEP coordinates the allocation of the spectrum to ensure no interference can occur. In the allocation process, the ARCEP also defines the conditions of utilisation of the band (i.e. number of authorised channels, maximum transmission power etc).
Other bands
For small cells, it is possible for operators to use sub 6GHz spectrum, which does not require direct line of sight. For example, it is possible to use some of the LTE spectrum in the 2.6GHz band to provide point to point backhaul. However, with the increasing demand on the LTE network, the 2.6GHz spectrum will eventually be fully used for the LTE RAN. Therefore, using the 2.6GHz spectrum for microwave backhaul is not a future proof solution. Also, the 5GHz unlicensed spectrum, traditionally used for WiFi, could also be used to provide microwave backhaul for the LTE network. The issue is that the unlicensed 5GHz spectrum is, due to its lack of licensing and coordination, prone to interference as different operators could use the same spectrum. Also the 5GHz band is becoming congested due to the increasing use of WiFi in this band.
9
See http://www.ofcom.org.uk/consult/condocs/licensing7176/statement/
10 See “Guidance Notes for Self Co-ordinated License and Interim Link Registration Process in the
71.125-75.875 GHz and 81.125-85.875GHz bands,” OfW 369, March 2007; available at http://www.ofcom.org.uk/radiocomms/ifi/licensing/classes/fixed/scl/ofw_369.pdf
3.2.2Spectrum bandwidth
The throughput that can be delivered by a microwave point to point link is proportional to the spectrum bandwidth. For example, a microwave system using 28MHz of bandwidth will deliver twice the throughput of a microwave system using 14MHz, using the same technology.
Standard spectrum bandwidths are 7MHz, 14MHz, 28MHz and 56MHz for “traditional” microwave bands (see Figure 3.1). It should be noted that “traditional” microwave bands are becoming heavily congested and obtaining 56MHz spectrum bandwidth is becoming increasingly difficult.
However, for millimetre wave bands (see Figure 3.1), the spectrum bandwidth can be much larger (e.g. 250MHz), delivering significantly more capacity than “traditional” microwave bands. However, it is not always practical to deploy microwave systems using the millimetre wave bands because both equipment and license fees might be expensive.
For small cell sites, sub-6GHz transmission systems typically use 20MHz or 40MHz TDD spectrum.
3.2.3Frequency modulation scheme
The capacity of a microwave system is also highly dependent upon the frequency modulation scheme used: the principles stated in section 2.2.1 for LTE are equally applicable to microwave systems. Microwave systems typically can use modulation scheme of up to 1024 QAM, and a microwave system using 1024 QAM will have a throughput 5 times higher compared with a system using QPSK.
However, when deploying microwave link, MNOs have to consider the availability of that link. Link availability is defined as the percentage of time the link is meeting its operational requirements (the variability being considered is to do with rainfall, amongst other factors). Operational requirements can include parameters such as bit error rate at the receiver. Typically, MNOs plan their microwave backhaul link to be 99.995% available. This means that the link is allowed not to meet its operational requirements only 26 minutes in a year.
As described in section 2.2.1, a high frequency modulation scheme requires a higher SNR to detect the signal correctly. Therefore, all other things being equal, microwave systems using lower modulation schemes (e.g. QPSK) will have a longer range (for a given level of signal power) than microwave systems using higher modulation schemes (e.g. 1024 QAM).
For small cell sites using sub-6GHz backhaul systems, the frequency modulation scheme is typically 16QAM or 32 QAM. This is because these systems are near Line of Sight (nLoS) or Non Line of sight (NLoS) and the received signal is significantly weaker that of a Line of Sight systems. NLoS radio transmission is characterised by a path that is partially obstructed, usually by a physical object (buildings, trees, and in some cases, high voltage electric power lines). Some of these obstructions reflect certain radio frequencies, while some simply absorb the signals. This
results in a weaker signal received and therefore in a lower SNR. As explained above, a lower SNR means that the systems have to use lower frequency modulation schemes to meet their operational requirements (i.e. link availability of 99.995%). Therefore NLoS and NLoS systems will typically only be able to use 16QAM or 32QAM modulation schemes, limiting their throughput.
Therefore, in summary:
the higher the frequency modulation scheme used by the microwave system, the lower the transmission distance
the higher the frequency modulation scheme used by the microwave system, the higher the throughput of the system.
the higher the frequency modulation scheme used by the microwave system, the lower the link availability
LoS systems can use higher modulation schemes than nLoS or NLoS systems
3.2.4Compression techniques
In order to increase the throughput of microwave systems, equipment vendors have developed compression techniques. This means that, with all other things being equal the microwave system has more capacity to carry content. The increase in throughput due to header compression is around 15-20% today depending on the vendor and we believe that, as new compression techniques will emerge, we can expect a 2%-3% improvement in compression year on year.
3.2.5Cross polarisation interference cancellation
Cross Polarisation Interference Cancellation (XPIC) means that two microwave signals can be transmitted in the same spectrum resulting in a doubling of capacity for the microwave link. This is achieved by using orthogonal polarisation for each of the signals (one signal is sent using polarisation on the X axis and the other signal is sent using polarisation on the orthogonal Y axis) to ensure they do not interfere with each other.
Microwave links using XPIC technology can use a single antenna but have to use two different radios, nearly doubling the cost of the solution.
3.3
Typical microwave capacity
Based on the above observations, we provide the expected throughput of current microwave systems, for both LoS systems (using traditional microwave bands and E-Band) and NLoS and nLoS systems (using sub 6GHz bands) in the following sections.
3.3.1LoS microwave systems
Figure 3.2 provide the expected throughput of current microwave system for traditional microwave band and E-Band as a function of the modulation scheme and spectrum bandwidth11
Figure 3.2: LoS microwave links typical capacity in 2014 [Source: Analysys Mason, 2014]
Modulation Capacity for 14MHz spectrum 12 (Mbit/s) Capacity for 28MHz spectrum 12 (Mbit/s) Capacity for 56MHz spectrum (Mbit/s) Capacity for 100MHz spectrum13 (Mbit/s) Capacity for 250MHz spectrum13 (Mbit/s)
1024 QAM 128 256 511 N/A N/A
512 QAM 119 238 476 N/A N/A
256 QAM 105 210 421 751 1878
128 QAM 89 177 354 633 1581
64 QAM 77 155 309 552 1380
32 QAM 63 127 253 452 1129
16 QAM 51 101 202 360 904
QPSK 25 51 101 181 452
Please note that the throughput provided in Figure 3.2 assumes that microwave systems use compression techniques as explained in section 3.2.4, with a compression factor of 15%. It also assumes that the cross polarisation cancellation technique is not used.
Due to the congestion of traditional microwave bands, it is difficult for MNO to obtain large amounts of spectrum. It is common that 14MHz can be available but it is becoming increasingly challenging to obtain 28MHz spectrum bandwidth, especially in urban areas. It is extremely difficult for MNOs to obtain 56MHz in Urban areas.
Therefore, MNO typically deploy microwave links using 14MHz and 28 MHz, which, today, can deliver up to128Mbit/s and 256Mbit/s of throughput respectively as illustrated in the table above.
E-Band offers a great potential because more bandwidth is available but is only suitable for a subset of urban sites, in countries where the regulator licences its use.
We expect the throughput of these microwave systems to increase year on year, mainly due to advancements in compression techniques.
Finally it should be noted that we do not expect operators to deploy microwave links with a greater modulation than 1024 QAM as the range and in particular the link availability would be insufficient.
11
Modulation and spectrum bandwidth are the two most influencing factors on bandwidth
12
In traditional microwave bands
13
3.3.2NLoS and nLoS microwave systems
Figure 3.3 provide the expected throughput of current microwave system for traditional microwave band and E-Band as a function of the modulation scheme and spectrum bandwidth11.
Figure 3.3: NLoS and nLoS microwave links typical capacity in 2014 [Source: Analysys Mason, 2014]
Modulation Capacity for 20MHz TDD spectrum in sub-6GHz band(Mbit/s)
Capacity for 40MHz TDD spectrum in sub-6GHz band (Mbit/s)
64 QAM 55 110
32 QAM 45 90
16 QAM 36 72
QPSK 18 36
Please note that the throughput provided in Figure 3.3 assumes that microwave systems use compression techniques as explained in section 3.2.4, with a compression factor of 15%. It also assumes that the cross polarisation cancellation technique is not used.
Sub-6GHz microwave systems, typically used for the backhaul of small cells, typically use Time Division Duplex (TDD) spectrum. This means that the spectrum bandwidth is shared between the uplink and downlink. In our assumptions, we have assumed that uplink and downlink are shared equally which means that a 20MHz TDD microwave system is equivalent to 2x10MHz of Frequency Division Multiplex spectrum.
As explained before, NLoS and nLoS systems typically use 16QAM or 32 QAM modulation scheme for small cell backhaul application. This means that a 20MHz TDD microwave system will provide a maximum throughput of 45 Mbit/s and a 40MHz TDD microwave system will provide a maximum throughput of 90 Mbit/s.
We expect the throughput of these microwave systems to increase year on year, mainly due to advancements in compression techniques.
4
Suitability of microwave backhaul for LTE network
4.1
Topology and reference network
In order to determine the capacity required for the backhaul of different sites in different topologies, we consider 3 different scenarios for the requirement:
Urban Macro site
Rural Macro site
Urban small cell site
We describe each of these cases in the following sub-sections.
Urban Macro sites
For Urban macro sites, we consider a hub and spoke topology as illustrated in Figure 4.1.
Figure 4.1: Typical backhaul configuration for urban macro sites[Source: Analysys Mason, 2014]
Rural Macro sites
For Rural Macro sites, we consider a daisy chain topology with no more than 5 sites in a single daisy chain as illustrated in Figure 4.2.
Aggregation point
Aggregation network (Fibre)
Mobile core
Figure 4.2: Typical backhaul configuration for rural macro sites [Source: Analysys Mason, 2014]
Urban small cell sites
For Small cells, we consider hub and spoke topology as illustrated in Figure 4.3.
Figure 4.3: Typical backhaul configuration for urban small cell [Source: Analysys Mason, 2014]
4.2
How much capacity is required for LTE sites?
Essentially, there are two limiting factors setting the required backhaul link capacity:
Theoretical peak throughput
Typical average throughput of a 3 sector site
If MNOs want to advertise peak theoretical throughput of the deployed technology for mobile broadband services, they have to dimension their backhaul network in terms of theoretical peak throughput to ensure the advertised speed can be achieved. In other words, the capacity of the backhaul system should be dimensioned to the maximum throughput that can be achieved by one of the sector at that site. This leads to the backhaul network being largely empty in the early years of deployment as the typical average throughput that can be achieved at a site is significantly lower than the theoretical peak cell throughput.
Alternatively, MNO can dimension the capacity of their backhaul based on the average throughput for each site (taking into account the 3 sectors). If MNO dimension their backhaul this way, it
Aggregation network
(Fibre) Mobile core
Up to 5 sites in Daisy chain
LTE site
Link capacity has to support traffic for 5 Sites 2-15km
Aggregation point
Aggregation network (Fibre)
Mobile core
means that they cannot advertise the theoretical peak speed to mobile broadband users as the network is not dimensioned to carry this peak throughput.
For this report, we have assumed that Macro Urban and Rural site could be dimensioned either as Peak sector throughput or as average site throughput.
Finally, it should be noted that typical small cell sites will have both LTE and WiFi. However, operators typically use WiFi as a “best effort” service and therefore do not provide explicit additional capacity in the backhaul for WiFi. Therefore, in our analysis, we have assumed that the backhaul capacity is only dimensioned in terms of LTE throughput.
The required capacity of the backhaul, based on the assumptions described in section 2.4, is provided in Figure 4.4.
Figure 4.4: Backhaul capacity required in Mbit/s for different scenarios[Source: Analysys Mason, 2014]
Backhaul Capacity 2014 2015 2016 2017 2018 2019 2020
Urban Macro (peak throughput
dimensioning)
136 204 452 452 754 984 1,378
Urban Macro (average throughput dimensioning)
68 102 225 225 376 491 687
1 Rural Macro site (peak throughput dimensioning)
102 102 226 301 301 394 590
1 Rural Macro site (average throughput dimensioning)
25 25 47 78 78 102 153
5 Rural Macro sites in daisy chain (peak throughput dimensioning)14,15
357 357 791 1,055 1,055 1,378 2,066
5 Rural Macro sites in daisy chain (average throughput
dimensioning)16
102 102 188 312 312 407 611
1 Small cell (peak throughput dimensioning)
136 136 301 301 603 787 787
1 Small cell (average throughput
dimensioning)
45 45 100 100 200 262 262
14
This calculates the capacity required on the last link before the aggregation point for 5 daisy chained sites.
15
This assumes a 30% statistical multiplexing gain
16
4.3
Results
Based on the analysis of the backhaul throughput required for LTE sites provided in the previous section, and on the projected capacity of microwave systems(section 3.3), we have determined the suitability of deploying microwave backhaul for each of the following type of sites:
Urban Macro
Rural Macro sites
Small cell sites
The results are provided in the next subsections.
4.3.1Urban Macro sites
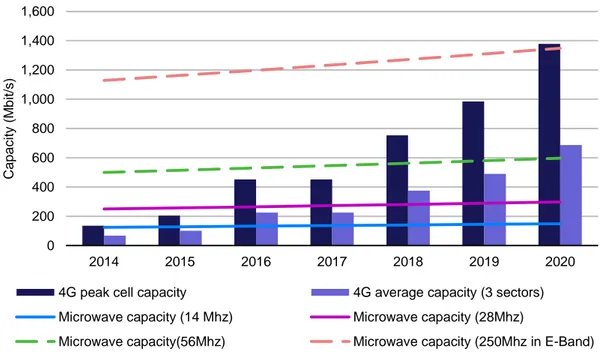
Figure 4.5 compares the capacity delivered by microwave systems for different spectrum bandwidth with the capacity required by LTE urban Macro sites for backhaul.
Figure 4.5: Adequacy of Microwave backhaul for Urban Macro sites [Source: Analysys Mason, 2014]
In Figure 4.5, it can be seen that a 14MHz microwave system is sufficient to backhaul the traffic of an Urban site in 2014 and possibly in 2015, depending on the dimensioning rule adopted by the MNO. However, the graph clearly shows that 14MHz microwave system will be inadequate to backhaul Urban Macro sites from 2016 onwards.
It can also be seen that 28MHz microwave systems may have enough capacity to backhaul LTE site until 2017 depending on the dimensioning rule selected by the operator. However, 28MHz microwave systems will be inadequate to backhaul Urban sites from 2018 onwards.
0 200 400 600 800 1,000 1,200 1,400 1,600
2014 2015 2016 2017 2018 2019 2020
Cap
a
c
ity
(M
b
it/
s
)
4G peak cell capacity 4G average capacity (3 sectors)
Microwave capacity (14 Mhz) Microwave capacity (28Mhz)
It can also be seen that 56MHz microwave systems will be able to backhaul LTE site till 2019, depending on the dimensioning rule selected by the operator. However, the congestion of traditional microwave spectrum will mean that deploying 56MHz microwave spectrum links will be extremely challenging, if not impossible from 2016 onwards.
Finally, it can also be seen that E-Band microwave system would in theory be able to provide enough capacity for urban site backhaul but cost issues may prevent its deployment.
4.3.2Rural Macro sites
For rural macro sites we provide two sets of results:
Capacity required for a single rural macro site
Capacity required for 5 daisy-chained rural macro sites
Capacity of a single Rural Macro site
Figure 4.6 compares the capacity delivered by microwave systems for different spectrum bandwidth with the capacity required by a single LTE Rural Macro sites for backhaul.
Figure 4.6: Adequacy of Microwave backhaul for 1 Rural Macro site [Source: Analysys Mason, 2014]
It should be noted that E-Band microwave systems are not represented in Figure 4.6. This is because typical rural backhaul links are between 2 and 15 km in length which is well beyond the reach of these systems, making them impractical to be deployed in rural environments.
As shown in Figure 4.6, 14MHz microwave systems will be adequate to backhaul a single site until 2020 if the operator dimensions its network according to average capacity. However, if the
0 100 200 300 400 500 600
2014 2015 2016 2017 2018 2019 2020
Ca
p
a
c
ity
(M
b
it/
s
)
4G average throughput (1 sites) 4G theoretical peak throughput (1 site)
Microwave capacity (14 Mhz) Microwave capacity (28Mhz)
operator dimensions its network according to the theoretical peak throughput of LTE site, 14MHz microwave systems will only be adequate till 2016. In the case the operator dimensions its network according to peak throughput, the 28MHz microwave systems will extend the adequacy of microwave backhaul till ~2018.
The 56MHz microwave system would have enough capacity to backhaul a single rural site independently of how capacity is dimensioned. However, availability of the spectrum is a significant issue which will significantly limit the deployment of such backhaul systems.
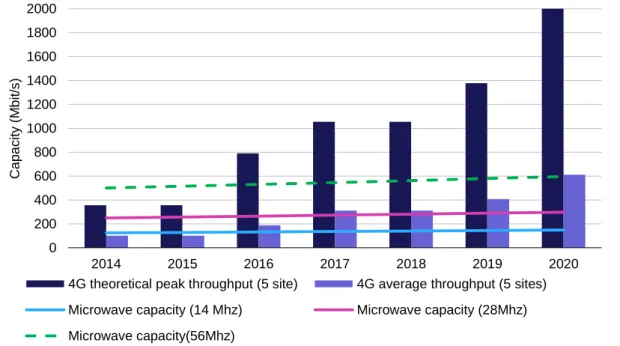
Capacity for 5 Rural macro sites
Figure 4.7 compares the capacity delivered by microwave systems for different spectrum bandwidth with the capacity required on the last hop to backhaul the traffic of 5 sites which have been daisy-chained.
Figure 4.7: Adequacy of Microwave backhaul for 5 daisy-chained Rural Macro site [Source: Analysys Mason, 2014]
As shown in Figure 4.7, nor the 14MHz microwave systems neither the 28MHz microwave systems are not adequate today to backhaul 5 daisy-chained sites if the operator dimensions its network according to theoretical peak throughput of an LTE sector.
If the operator dimensions its network according to average throughput, 14 MHz microwave links will provide sufficient capacity till 2015 and 28 MHz microwave links will provide sufficient capacity until 2018. However beyond 2018, only 56MHz microwave links will provide sufficient capacity till 2020 if the network is dimensioned according to average throughput. Finally, it can also be seen that 56MHz microwave will not be able to provide the required capacity beyond 2015 if the network is dimensioned according to peak throughput. Also, as mentioned previously,
0 200 400 600 800 1000 1200 1400 1600 1800 2000
2014 2015 2016 2017 2018 2019 2020
Cap
a
c
ity
(M
b
it/
s
)
4G theoretical peak throughput (5 site) 4G average throughput (5 sites)
Microwave capacity (14 Mhz) Microwave capacity (28Mhz)
congestion of the spectrum bands is a significant issue and 56 MHz bandwidth will be very challenging to obtain.
4.3.3Small cell sites
Figure 4.8 compares the capacity delivered by microwave systems for different spectrum bandwidth with the capacity required by LTE urban small cell sites for backhaul.
Figure 4.8: Adequacy of Microwave backhaul for small cells sites [Source: Analysys Mason, 2014]
For small cells, backhaul equipment vendors have designed specific transmission systems which have significantly smaller form factors that traditional systems. This is because space is at a premium in small cell sites which is typically hosted on street furniture.
In Figure 4.6, it can be seen that 20MHz17 microwave capacity will only be able to meet the average throughput of small cell sites until 2016 and the 40MHz microwave capacity will be able to meet the average throughput of small cell sites until 2018. However, if operators want to dimension their backhaul according to peak throughput, sub-6GHz systems will not be appropriate.
E-Band millimetre wave links may be suitable for peak throughput dimensioning until 2018but the relatively low positioning of the microwave dish (typically on street furniture for small cell) will mean it is often very difficult to get line of sight, a pre-requisite for E-Band systems. Therefore, E-Band systems may only be able to serve a sub-set of small cell sites.
17
TDD in the sub-6GHz band 0
100 200 300 400 500 600 700 800 900
2014 2015 2016 2017 2018 2019 2020
Cap
a
c
ity
(M
b
it/
s
)
4G peak cell throughput 4G average throughput (1 sectors)
Microwave 20MHz TDD Microwave 40 MHz TDD
4.3.4Impact of site sharing
In the past 5 years, operators had to find ways to save costs. One of the options actively pursued by MNOs is site sharing, where a single site can host two or more operators in such a way that operational expenditure to operate and maintain that site can be shared between operators. In some of these options, the backhaul services can be shared as well as the tower. Site sharing clearly puts additional strain on the backhaul if shared. Typically, operators want their own dedicated capacity so that the traffic of other operators does not impact their ability to carry their own traffic.
Further sharing can be achieved beyond sites and backhaul: shared electronics. These “Shared RAN” solutions can operate within the same backhaul requirements as a single operator, if they deploy LTE in the same amount of spectrum (for example in rural areas where the cell does not require additional capacity over the basic level of coverage); however, if additional spectrum is used, then additional backhaul capacity will be required just as in the case of shared backhaul. Therefore, assuming that both operators have the same capacity requirements, at sites where two operators are present and both deploy base station electronics or where the total spectrum of two operators is deployed in a shared RAN, the backhaul capacity will need to effectively be doubled.
Already through our analysis of section 4.3.1 to 4.3.4, we have demonstrated that if operators plan their network according to peak throughput, traditional microwave band systems will not be sufficiently future proof; site sharing will only make this issue more pressing.
5
Conclusions
Based on the analysis carried out in the previous subsections, it is clear that if the operator dimensions its backhaul network according to the peak throughput and uses traditional microwave spectrum bands, 14 MHz and 28MHz point to point systems will provide insufficient capacity to backhaul to urban macro and a significant fraction of rural sites beyond 2016. Also, if the operator dimensions its backhaul network according to the peak throughput, sub-6GHz systems (20MHz or 40 MHz) provide insufficient capacity to backhaul small cell sites today.
The situation is further exacerbated by the increasing use of site sharing, which can put significant additional strain on the capacity required for the backhaul.
In countries where the E-Band is licensed in a way which allows coordinated and effective use, it represents an opportunity for MNOs to deploy the required capacity for their backhaul systems in urban environment. For small cells, the utility of E-band is highly dependent on having a suitable line of sight to the point of aggregation.
These points will make access to leased lines increasingly important for mobile operators over the lifetime of the proposed recommendation on relevant markets.
If operators do not have any cost efficient alternative (such as fibre based high speed leased lines), they will not be able to take full advantage of the technology upgrade on their mobile network (e.g. upgrading from LTE to LTE-A) and end users will not be able to enjoy these benefits. There may be some risk of leverage of market power from the leased line market into the retail mobile market.