US/Overseas Tax Analysis
The international oil industry has seen continued expansion into new geographical locations. New frontiers have opened up to the industry with exploration and development moving into previously unexplored regions.
As companies have moved into new regions to capture new opportunities there has also been growing competition from companies based in countries outside of North America and Europe, the home of the larger oil and gas companies that have traditionally driven international expansion. Whilst there has been increased competition for those International Oil Companies (IOCs) from National Oil Companies (NOCs) in the NOCs‟ own countries, there has also been increasing competition from NOCs, in particular Asian NOCs, across other geographies.
From the start of 2009 through to mid-October 2010 Asian NOCs spent $55 billion on international acquisitions, acquiring over 5 billion barrels of oil equivalent commercial reserves. Chinese NOC CNPC now holds commercial interests in 17 countries outside China, whilst Petronas has interests across 15 countries.
Proposed changes to the US tax system, regarding the treatment of income taxes paid overseas by US based oil and gas companies, could disadvantage those companies from competing effectively against non-US based investors for access to global oil and gas reserves.
In this report, Wood Mackenzie evaluates the economics of a typical upstream development in 14 countries. The after-tax return for a US based oil and gas company under each fiscal system is compared with the after-after-tax return of „In-Country‟ producers in each country. Under current rules, US taxpayers are subject to US tax on their worldwide income. In order to prevent double taxation, foreign taxes paid by US investors on their foreign income are permitted to be offset against the US tax otherwise due on such foreign income. To claim this offset, US taxpayers must show that the foreign tax they paid is an income tax for US tax purposes as defined under section 901 of the Internal Revenue Code and its regulations. Some US taxpayers, categorised as “dual capacity taxpayers” because they pay foreign taxes on their income as well as making other payments to foreign governments for specific benefits, must, under US rules, show that the tax paid is an income tax as well as the payment not being for any type of specific benefit.
The US Government has proposed that the rules governing the treatment of dual capacity taxpayers need to be modified. Under the proposed terms, dual capacity taxpayers would be prevented in some countries from claiming the full amount of foreign income taxes they pay as an offset to their US tax. The limitation would be based upon only foreign tax otherwise payable at the general corporate tax rate applicable to other industries. Tax payments at levels greater than this would be reclassified as an operating expense, and therefore not creditable for US tax purposes. Under the proposed changes to the dual capacity taxpayer rules, US based oil and gas companies would face an additional or residual US tax burden that they do not currently face. This additional US tax will reduce the after-tax value and returns from overseas projects. This could make US investors less able to acquire or develop overseas opportunities economically, compared to competitors who do not face a similar additional domestic tax burden. As a result, non-US based investors would obtain a competitive advantage over the US based investors in the race to acquire
US/Overseas Tax Analysis
valuable to other investors. The higher value of the assets to other companies could result in the sale of overseas assets by US investors to maximise shareholder value.
The internal rate of return (IRR) and Net Present Value (NPV10) of a representative project in each of fourteen countries have been calculated on the following bases:
In-country (i.e. the investor net cash flow, after payments to the host country government, assuming the investor retains all profits in the country or, if a foreign, non-US investor, remits those payments to its home country)
Proposed US investor (i.e. In-country less US tax payments under proposed terms) The remainder of this report is presented as follows:
Key findings
In-country and US investor economics
Appendix 1: Overseas Model Project Assumptions
Key Findings
The following tables summarise the difference in the economics of the selected fields run under the In-country terms compared with the proposed US terms. The In-country system is that which applies not only to companies operating in their home environment, but also to those companies based in systems where taxes are calculated on a territorial system: the income generated overseas is generally not subject to tax in the home country.
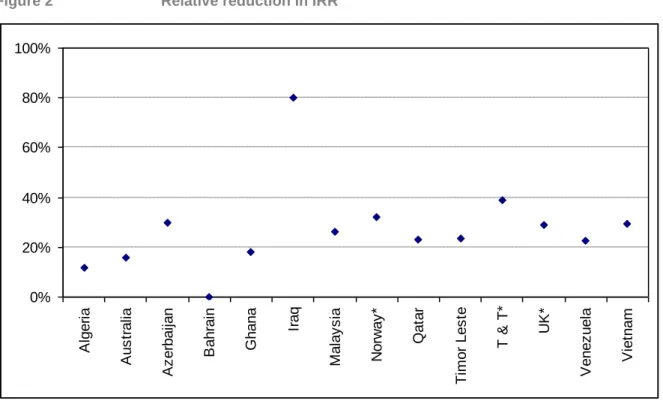
The result is that of a reduction, sometimes significant, in the returns and value when moving from In-country terms to the proposed US terms. Tables 1 and 2 show the effect on the IRR and Net Present Value at a 10% discount rate (NPV10) for investment in different countries of moving from an In-country system to the New US Investor system. There is a marked reduction in IRRs across the selected countries, ranging from two percentage points up to nineteen percentage points in absolute terms. Some of the smaller absolute percentage point reductions occur in countries where the In-country IRR is between 11% and 15%. However, as such IRRs are around the typical threshold level for companies deciding whether to proceed with investments, reduced IRRs at this level may mean that US based investors would be unable to compete for such projects.
Table 1 also reflects the competitive disadvantage that a US investor would face by showing the higher IRR that a non- US based investor could earn relative to what that US investor could earn under the proposed tax changes. These differences are substantial in a number of instances. For example, the IRR that a non-US based investor could earn in a new project in Iraq is some five times higher than what a US based investor would be able to earn.
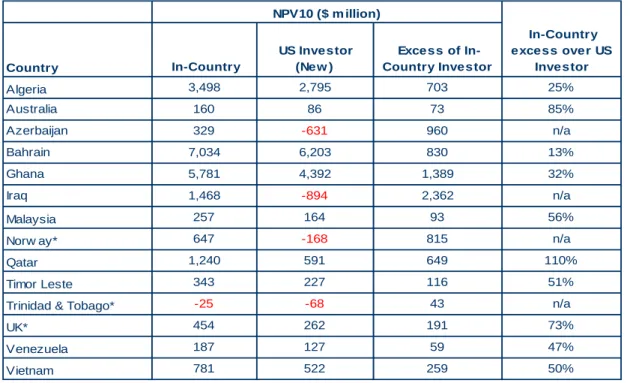
In Table 2 the net present values using a 10% discount rate are shown together with the additional value accruing to an In-country investor over a US based Investor. In all cases the value of the asset to the US investor is much less than the value of the asset to the non-US based investor. The value reduction in some cases is significant. For Azerbaijan and Iraq the example field used generates positive returns at a 10% discount rate under an In-country system. However, when the New US Investor terms are applied the returns are negative at a 10% discount rate. The implication is that for fields similar to the representative field, a US based Investor would be unlikely to be willing to invest.
Even for those countries that still generate positive returns at a 10% discount rate the values for an In-country investor are between 13% and 110% greater than that for a US based Investor. This could have significant implications to US investors who must compete for new reserves. Access to reserves is typically awarded to the investor willing to pay the most to the reserve owner or invest the most through exploration activity. Economic modelling, similar to that used in this study, helps companies determine how much to bid (or to invest) by calculating the net present value of the proposed investment. The higher the net present value, the more an investor would be willing to bid for the access rights. As shown in Table 2, non-US investors could outbid US based investors in all cases. Some situations, such as Qatar, show that a non-US based investor could offer twice as much as a US investor for new reserves.
The proposed tax changes that would apply only to US based investors are likely to make them less willing to invest in overseas opportunities and may also make it attractive to them to dispose of overseas assets where the value of the asset to a non-US company is significantly greater than that to a US based investor.
Table 1 – Effect on IRR of the US taxation system
IRR for the Bahrain project cannot be calculated as the project is re-development of existing field and has positive cash flow from year one.
* Grandfathering existing treaty provisions may mitigate the effect of the proposed US changes. Table 2 – Effect on Net Present Values of the US taxation system
* Grandfathering existing treaty provisions may mitigate the effect of the proposed US changes.
Country In-Country
US Investor (New )
Relative reduction in IRR
Algeria 29.4% 25.9% 11.7%
Australia 15.3% 12.8% 15.8%
Azerbaijan 11.0% 7.7% 29.8%
Bahrain n/a n/a n/a
Ghana 34.0% 27.8% 18.2%
Iraq 23.8% 4.7% 80.1%
Malaysia 29.9% 22.1% 26.1%
Norw ay* 13.4% 9.1% 31.9%
Qatar 18.2% 14.1% 22.9%
Timor Leste 41.6% 31.8% 23.7%
Trinidad & Tobago* 8.2% 5.0% 38.7%
UK* 28.9% 20.6% 28.8%
Venezuela 23.0% 17.9% 22.5%
Vietnam 44.0% 31.1% 29.4%
IRR
Country In-Country
US Investor (New )
Excess of In-Country Investor
In-Country excess over US
Investor
Algeria 3,498 2,795 703 25%
Australia 160 86 73 85%
Azerbaijan 329 -631 960 n/a
Bahrain 7,034 6,203 830 13%
Ghana 5,781 4,392 1,389 32%
Iraq 1,468 -894 2,362 n/a
Malaysia 257 164 93 56%
Norw ay* 647 -168 815 n/a
Qatar 1,240 591 649 110%
Timor Leste 343 227 116 51%
Trinidad & Tobago* -25 -68 43 n/a
UK* 454 262 191 73%
Venezuela 187 127 59 47%
Vietnam 781 522 259 50%
In-country and US investor economics
Methodology
A typical recent upstream project in 14 countries has been modelled. Each project has been selected on the basis that production has either recently started or is due to begin within the next 2-3 years. Where several such projects exist in a country, the specific project has been selected on the basis that it is in the middle of the range, based on recoverable reserves. All projects have then been re-based so the first year of capital expenditure is 2010, to ensure that the total project cash flows are captured in the cash flow analysis. Economics have been conducted assuming a $70/bbl (constant, real) oil price, although local price differentials and gas prices will vary according to local conditions and agreements. A summary of the project reserves and costs is included in Appendix 1 to this report.
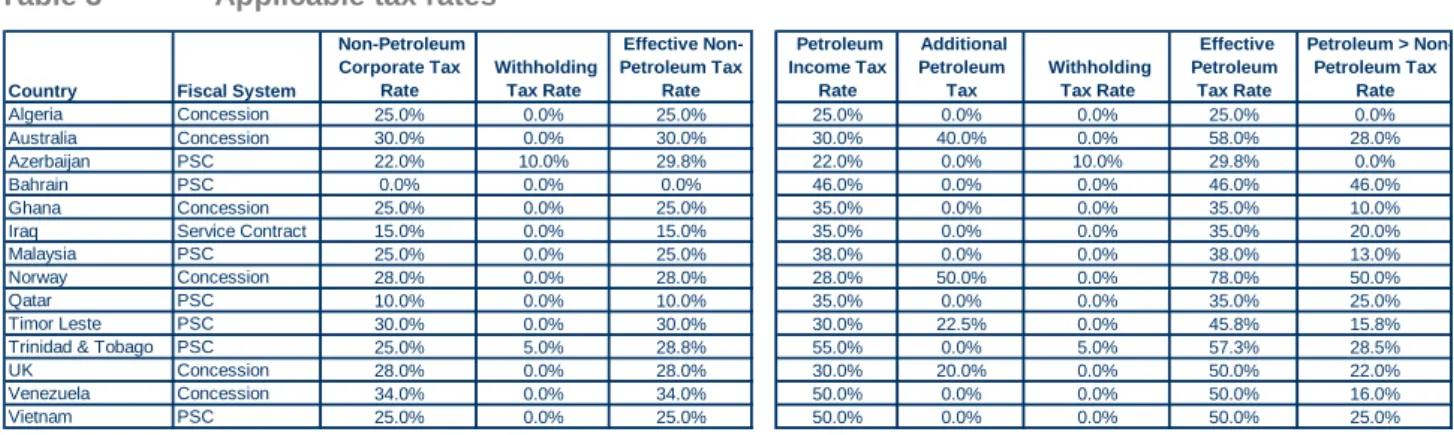
The fiscal terms appropriate to each particular project have been modelled. A summary of the petroleum fiscal terms and the standard income tax terms in each country is included in Appendix 2 to this report.
The US tax system is assumed to apply as follows:
Revenue for US tax purposes is the investor‟s revenue from the project less payments to the host government, with the exception of taxes (i.e. net revenue after royalty and similar levies have been paid)
Capital costs are depreciated according to the following schedules:
o Tangible costs (assumed to be 70% of the total) are depreciated over 14 years on a straight-line basis, with depreciation starting when production from the project commences.
o Intangible costs (assumed to be 30% of the total) are depreciated over 10 years on a straight-line basis, with depreciation starting when the costs are incurred
Operating costs are expensed
Any losses generated by the project are carried forward to future years, i.e. the tax liability is assumed to be „ring-fenced‟ from the investor‟s other operations and a carry back to the profits of the proceeding year is also allowed. Under the „new‟ proposals, only corporate income tax in a country equal to that which would be paid by non-petroleum businesses is allowed as an offset or credit against the US tax liability. Any corporate income tax payments paid by petroleum businesses in excess of those paid by non-petroleum businesses are treated as deductions and reduce the income base for US tax. Where petroleum tax is based on the same rules as non-petroleum tax, but at a higher rate, the non-non-petroleum tax is pro-rated from the non-petroleum tax already calculated. When petroleum tax is charged on a different income base from non-petroleum income, the non-petroleum tax is calculated separately.
Withholding tax on dividends remitted from the country have been included, to the extent that these are payable by US investors under the various tax treaties applicable. This information was supplied by the API.
We have valued each asset on a stand alone basis. No benefit from pooling of interests has been taken into account.
In our analysis we have assumed that companies that we are comparing with US companies will be an In-country investor or will come from countries either having a robust foreign tax credit system or one that has a territorial taxing system. In such circumstances those companies will generally not be required to pay an additional sum in tax in their home country.
The residual US tax calculation has been based upon U.S. Treasury Regulation Section 901-2A(e)(1), the details of which were provided by API.
Table 3 Applicable tax rates
Source: Wood Mackenzie (Oct 2010)
Additional Petroleum Tax rates are maximum rates – in some cases the tax will not be applied until the project achieves a hurdle rate of return. In other cases, the tax will always apply. See Appendix 2 for details.
A Windfall Tax applies in Algeria that is not shown in the above table, but is deducted as a cost in the split calculation for Algeria and is used in the determination of the US creditable proportion.
Country Fiscal System
Non-Petroleum Corporate Tax
Rate
Withholding Tax Rate
Effective Non-Petroleum Tax
Rate
Petroleum Income Tax
Rate
Additional Petroleum
Tax
Withholding Tax Rate
Effective Petroleum Tax Rate
Petroleum > Non-Petroleum Tax
Rate Algeria Concession 25.0% 0.0% 25.0% 25.0% 0.0% 0.0% 25.0% 0.0% Australia Concession 30.0% 0.0% 30.0% 30.0% 40.0% 0.0% 58.0% 28.0% Azerbaijan PSC 22.0% 10.0% 29.8% 22.0% 0.0% 10.0% 29.8% 0.0%
Bahrain PSC 0.0% 0.0% 0.0% 46.0% 0.0% 0.0% 46.0% 46.0%
Ghana Concession 25.0% 0.0% 25.0% 35.0% 0.0% 0.0% 35.0% 10.0% Iraq Service Contract 15.0% 0.0% 15.0% 35.0% 0.0% 0.0% 35.0% 20.0% Malaysia PSC 25.0% 0.0% 25.0% 38.0% 0.0% 0.0% 38.0% 13.0% Norway Concession 28.0% 0.0% 28.0% 28.0% 50.0% 0.0% 78.0% 50.0%
Qatar PSC 10.0% 0.0% 10.0% 35.0% 0.0% 0.0% 35.0% 25.0%
Timor Leste PSC 30.0% 0.0% 30.0% 30.0% 22.5% 0.0% 45.8% 15.8% Trinidad & Tobago PSC 25.0% 5.0% 28.8% 55.0% 0.0% 5.0% 57.3% 28.5% UK Concession 28.0% 0.0% 28.0% 30.0% 20.0% 0.0% 50.0% 22.0% Venezuela Concession 34.0% 0.0% 34.0% 50.0% 0.0% 0.0% 50.0% 16.0% Vietnam PSC 25.0% 0.0% 25.0% 50.0% 0.0% 0.0% 50.0% 25.0%
Internal Rate of Return (IRR)
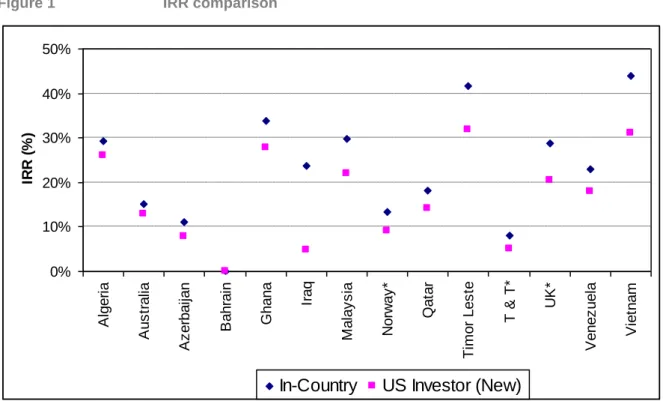
The net cash flow of each project has been calculated from the perspective of an „in-country‟ investor (or a company from a country not subject to the dual capacity rules applying to US Investors) under the proposed US tax terms. The resulting IRR of the cash flow is shown in Figure 1, below.
Figure 1 IRR comparison
IRRs based upon model fields representative of new field developments in each country
IRR for the Bahrain project cannot be calculated as the project is re-development of existing field and has positive cash flow from year one.
* Grandfathering existing treaty provisions may mitigate the effect of the proposed US changes.
0% 10% 20% 30% 40% 50% A lg e ri a A u s tr a lia A z e rb a ija n B a h ra in G h a n a Ir a q M a la y s ia N o rw a y * Q a ta r Ti m o r L e s te T & T* U K * V e n e z u e la V ie tn a m IR R ( % )
Figure 2 Relative reduction in IRR
IRRs based upon model fields representative of new field developments in each country
IRR for the Bahrain project cannot be calculated as the project is re-development of existing field and has positive cash flow from year one.
* Grandfathering existing treaty provisions may mitigate the effect of the proposed US changes.
Net Present Value (NPV10)
Net Present Values show a universal reduction when moving to the proposed US system compared to the in-country approach, with a number of countries, including Azerbaijan and Iraq generating a negative NPV under the US system.
Figure 3 NPV10 ($million) comparison
NPVs based upon model fields representative of new field developments in each country * Grandfathering existing treaty provisions may mitigate the effect of the proposed US changes.
0% 20% 40% 60% 80% 100% A lg e ri a A u s tr a lia A z e rb a ija n B a h ra in G h a n a Ir a q M a la y s ia N o rw a y * Q a ta r Ti m o r L e s te T & T* U K * V e n e z u e la V ie tn a m -2,000 0 2,000 4,000 6,000 8,000 A lg e ri a A u s tr a lia A z e rb a ija n B a h ra in G h a n a Ir a q M a la y s ia N o rw a y * Q a ta r Ti m o r L e s te T & T* U K * V e n e z u e la V ie tn a m N P V 1 0 ( $ m il li on )
Figure 4 Excess value of In-Country investor over US (New) Investor NPV10 ($million)
NPVs based upon model fields representative of new field developments in each country * Grandfathering existing treaty provisions may mitigate the effect of the proposed US changes.
Table 4 Remaining Oil Reserves
0 250 500 750 1,000 T & T* V e n e z u e la A u s tr a lia M a la y s ia Ti m o r L e s te U K * V ie tn a m Q a ta r A lg e ri a N o rw a y * B a h ra in A z e rb a ija n G h a n a Ir a q N P V 1 0 ( $ m il li on ) Country Remaining Oil Reserves (Bn Bbbl) Algeria 11.2 Australia 3.1 Azerbaijan 7.6 Bahrain 3.0 Ghana 1.8 Iraq 105.3 Malaysia 2.4 Norway 8.3 Qatar 18.8
Timor Leste 0.2 Trinidad & Tobago 0.4
UK 5.3
Venezuela 163.0
Vietnam 1.0
Total 331.4
Appendix 1: Overseas Project Assumptions
API Field Assum ptions
Recent project, re-based to 2010 first capex, US$70/bbl
Country
Oil
(m m bbl) Gas (bcf)
Reserves (m m boe)
Capex ($/boe)
Opex ($/boe)
Total Costs ($/boe)
Algeria 444 0 444 10.6 5.7 16.2
Australia 73 0 73 30.6 9.8 40.4
Azerbaijan 0 6,600 1,100 6.6 10.6 17.2
Bahrain 334 1,493 582 7.6 4.2 11.8
Ghana 700 600 800 12.3 10.7 23.1
Iraq 7,859 0 7,859 2.7 2.0 4.8
Malaysia 36 250 78 9.0 5.1 14.0
Norw ay 172 1,445 412 16.4 11.4 27.8
Qatar 1,132 13,171 3,327 1.0 1.2 2.2
Timor Leste 45 0 45 17.1 16.5 33.6
Trinidad & Tobago 0 603 100 4.4 1.4 5.8
UK 35 100 52 20.1 6.8 26.9
Venezuela 85 0 85 9.2 7.2 16.4
Vietnam 165 83 179 5.7 12.2 17.8
Appendix 2: Overseas Fiscal Terms and US Tax Treatment
Algeria
Government profit share: 63%-80%, depending on production rate Windfall profit tax: 15%-50% of profit share, depending on production rate Non-petroleum income tax: 25%, with no withholding tax
Australia
PRRT: 0%-40%, depending on IRR
Non-petroleum income tax: 30%, with no withholding tax
Azerbaijan
Government profit share: 45%-90%, depending on profitability ratio
Non-petroleum income tax: 22%, plus 10% withholding tax = effective 29.8% tax rate
Bahrain
Government profit share: 70%-90%, depending on production and profitability ratio Petroleum income tax: 46%, with no withholding tax
Non-petroleum income tax: 0%, with no withholding tax
Ghana
Royalty: 5% (of revenue)
Additional Oil Entitlement: 5%-25%, depending on IRR
Petroleum income tax: negotiated in agreements with typical rate of 35% (although the law provides for 50%), with no withholding tax – paid instead of income tax
Non-petroleum income tax: 25%, with no withholding tax
Iraq
Remuneration fee: $0.57 - $1.90 per barrel, depending on profitability ratio
Petroleum income tax: 35%, with no withholding tax – paid instead of Non-petroleum income tax Non-petroleum income tax: 15%, with no withholding tax
Malaysia
Royalty: 10% (of revenue)
Government profit share: 20%-90%, depending on production and profitability ratio Supplementary Payment: 0%-70% , depending on price
Export Duty: 10% (of export revenue)
Qatar
Government profit share: 74%-81%, depending on production and profitability ratio
Petroleum Income Tax: 35%, with no withholding tax – paid instead of Non-petroleum income tax Non-petroleum income tax: 10%, with no withholding tax
Timor Leste
Royalty: 5% (of revenue) Government profit share: 40% SPT: 0%-22.5%, depending on IRR
Non-petroleum income tax: 30%, with no withholding tax
Trinidad & Tobago
Government profit share: 50%-85% Unemployment Levy: 5%
Petroleum income tax: 50%, plus 5% withholding tax = effective 52.5% tax rate – paid instead of Non-petroleum income tax
Non-petroleum income tax: 25%, plus 5% withholding tax = effective 28.8% tax rate
UK
Supplementary Charge: 20%
Petroleum income tax: 30%, with no withholding tax – paid instead of Non-petroleum income tax Non-petroleum income tax: 28% (reducing to 24%), with no withholding tax
Venezuela
APT: 0%-60% (of revenue), depending on price Royalty: 33.3% (of revenue)
Other Taxes: c.4%
Petroleum income tax: 50%, with no withholding tax – paid instead of Non-petroleum income tax Non-petroleum income tax: 34%, with no withholding tax
Vietnam
Royalty: 6%-25% (of revenue), depending on production Export duty: 4% (of export revenue)
Government profit share: 60%-80%, depending on production
Petroleum income tax: 50%, with no withholding tax – paid instead of Non-petroleum income tax Non-petroleum income tax: 25%, with no withholding tax