Understanding Ohio’s State Tests
Score Reports
Spring 2015 Science and Social Studies
11/3/2015Table of Contents
Table of Contents
Introduction ... 2
Purpose of Ohio’s State Tests ... 2
Subjects/Grade Levels Tested in 2015 ... 2
Testing Format ... 2
Question Formats ... 3
Ohio’s State Tests Scores ... 4
Scale Scores and Performance Levels... 4
Reporting Category Indicators ... 4
Codes for No Data Reported ... 5
Ohio’s State Tests Reports ... 6
Family Score Reports ... 7
Online Score Reports ... 9
Online Reporting System ... 9
Homepage Dashboard ... 9
School Listing Report ... 9
Reporting Categories Report ... 11
Student Listing Report ... 12
Individual Student Report ... 13
Glossary ... 15
Table of Figures
Figure 1. Family Score Report: Front Page ... 7Figure 2. Family Score Report: Back Page ... 8
Figure 3. Homepage Dashboard ... 9
Figure 4. School Listing Report ... 10
Figure 5. Exploration Menu ... 10
Figure 6. Reporting Categories Report ... 11
Figure 7. Student Listing Report ... 12
Figure 8. Individual Student Report ... 13
Understanding Ohio’s State Tests Reports for
Science and Social Studies
Introduction
This document has been prepared to help you understand the score reports for Ohio’s State Tests in science and social studies for spring 2015. It includes explanations of the reports, information about the content
assessed in science and social studies relating to Ohio’s Learning Standards and a glossary of the terms used in these reports.
Authorized district and school personnel can log in to the Online Reporting System to access and view their spring 2015 science and social studies reports. Assistance with these reports is available in the Online Reporting System User Guide, which is available on the Ohio’s State Tests Portal or by clicking the Help button within the system.
Purpose of Ohio’s State Tests
The State Board of Education approved Ohio’s Learning Standards in science and social studies in June 2010. By the 2014-2015 school year, all schools were implementing these K-12 standards. Schools assess student performance of the standards through Ohio’s State Tests. Data from the tests will provide information to parents, teachers, policy makers and the general public regarding how well students are progressing under Ohio’s Learning Standards.
Subjects/Grade Levels Tested in 2015
Districts and schools administered the following tests in spring 2015: • Grades 4 and 6 Social Studies;
• Grades 5 and 8 Science; • American History;
• American Government; • Physical Science.
Students enrolled in the tested grades of 4, 5, 6, and 8 participated in the spring 2015 administration. Students enrolled in a grade lower than the tested grade but who are accessing the tested grade curriculum also
participated as accelerated testers. Students enrolled in an eligible year-long or spring-semester American History and American Government course participated in the spring 2015 administration. Additionally, students who entered the ninth grade after July 2014 and were enrolled in an eligible year-long or spring-semester Physical Science course participated in the spring 2015 administration.
Testing Format
Districts and schools administered each science and social studies test in two parts across two test windows, or periods of time. They administered the first part, also referred to as the performance-based assessment (PBA), in March 2015. They administered the second part, also referred to as the end-of-year (EOY) test, in May 2015. The test contractor combined student responses for each part to produce one summative score.1
1
Only test parts of the same mode (online or paper) are combined into a summative score. Two separate scores are reported for students who took one test part in one mode (e.g., online) and another test part in another mode (e.g., paper). These scores cannot be combined to produce one summative score. In these cases, the district can choose the higher score to be submitted to EMIS and to assign graduation points.
Page 2 │ Understanding Ohio’s State Tests Reports Spring 2015
The test contractor made the spring 2015 tests available in two formats: computer-based testing (online) and paper-based testing. Ohio has been transitioning to computer-based testing since 2012. Ohio districts chose whether to administer the state tests on paper or online. Districts could elect to administer each grade or test in a different test mode. Paper tests also were available in Braille and large print for students requiring specific accommodations. Spanish-English test forms were available to students testing online.
Question Formats
Students responded to items in multiple ways, including by creating charts, writing extended responses and using other interactive features. The various question types assessed higher-order thinking skills and offered different ways for students to show what they know and can do. Released items from the spring 2015 science and social studies administration, as well as descriptions and tutorials of the item types, are available on the
Ohio's State Tests Portal.
Ohio’s State Tests Scores
Scale Scores and Performance Levels
Ohio reports five performance standards: Limited, Basic, Proficient, Accelerated or Advanced. The scale score ranges in the tables below define each level. The accelerated level of performance suggests that a student is on track for college and career readiness.
Table 1: Scale Score Ranges in Science
Grade/Subject Limited Basic Proficient Accelerated Advanced
Grade 5 559-663 664-699 700-724 725-752 753-845
Grade 8 575-673 674-699 700-724 725-765 766-868
Physical Science 634-683 684-699 700-724 725-748 749-815 Table 2: Scale Score Ranges in Social Studies
Grade/Subject Limited Basic Proficient Accelerated Advanced
Grade 4 621-686 687-699 700-724 725-750 751-800
Grade 6 541-675 676-699 700-724 725-754 755-829
American History 619-683 684-699 700-724 725-737 738-800 American Government 642-686 687-699 700-724 725-738 739-774
For a summary of what the Ohio’s Learning Standards expect students to know and do at each level, refer to the Performance Level Descriptors available on the Ohio’s State Tests Portal.
Reporting Category Indicators
Each test has three to four reporting categories. Reporting categories represent groups of similar student skills or learning standards assessed within each grade and subject. For example, a reporting category within grade 6 social studies would be economics.
Student performance on the subset of items associated with a reporting category is reported with an indicator, rather than with scale scores or raw scores. These indicators are:
• Below proficient; • At/near proficient; • Above proficient.
Ohio educators may use these indicators to determine the strengths and weaknesses of a student’s performance for a particular subject. Each test’s reporting categories are listed below.
Grade 4 Social Studies • History;
• Government;
• Geography/Economics.
Grade 5 Science
• Earth Science;
• Life Science;
• Physical Science. Grade 6 Social Studies
• History and Government;
• Economics;
• Geography. Grade 8 Science
• Earth Science;
• Life Science;
• Physical Science. American Government
• Historic Documents;
• Principles and Structure;
• Ohio/Policy/Economy. American History
• Skills and Documents;
• 1877-1945;
• 1945-present. Physical Science
• Matter;
• Energy and Waves;
• Forces and Motion;
• The Universe.
Codes for No Data Reported
The following abbreviations may appear on some reports: • DNA — Did Not Attempt
• INV — Invalidated
A student will receive a DNA if he or she answered at least one item but did not meet the department’s criteria for having attempted the test. The department defines a test as attempted if the student responded to five items or achieved five points. A record will reflect INV if both parts of the student’s test were invalidated. If a student receives a condition code, the parent or student should consult the student’s designated guidance counselor.
Ohio’s State Tests Reports
Ohio’s State Tests results are available in several formats. Table 3 provides a list of Ohio’s State Tests reports, the delivery format for the report, the grade levels at which each report is available and the page of this
document on which each report is described.
Table 3: Ohio’s State Tests Reports, Format of Delivery and Grades
Ohio’s State Tests Report Title Format of
Delivery Grades Page of Report Fam il y S cor e R epor ts
Social Studies Family Score Report Paper 4, 6 7
Science Family Score Report Paper 5, 8 7
Physical Science Family Score Report Paper HS 7
American Government Family Score Report Paper HS 7
American History Family Score Report Paper HS 7
O nl ine S cor e R epor ts
School Listing Report Online All 9
Reporting Categories Report Online All 11
Student Listing Report Online All 12
Individual Student Report Online All 13
Family Score Reports
Family score reports arrive in districts Nov. 3, 2015.2 The Ohio’s State Tests Family Score Report is a two-page color report. The first two-page provides resources for families. The second two-page provides the student’s scale score and performance level, including the student’s reporting category indicators and a summary of each reporting category.3
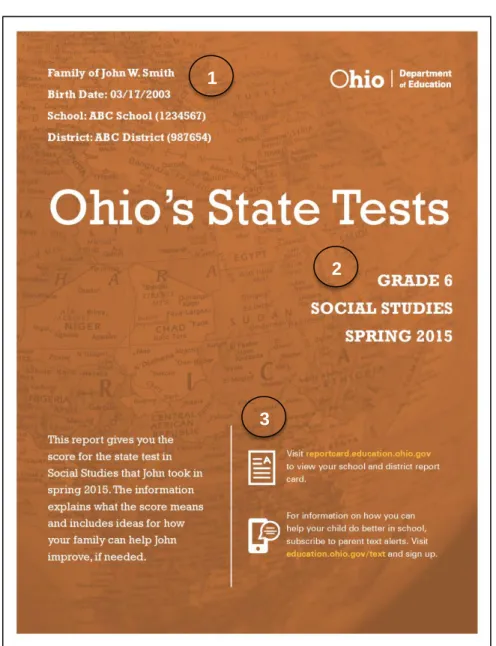
Figure 1. Family Score Report: Front Page
1.
Student Information: The top of the front page lists the student’s name, date of birth, school and district.2. Test Information: The right middle side of the front page provides the test administration.
3. Resources: Additional resources and information are available to parents by visiting the websites provided in the bottom right corner.
2
Family score reports are delivered for students with on-time results. Students may not have on-time results for the following reasons: (a) paper test materials were delivered to the test contractors after the deadline; (b) paper answer documents could not be matched to a Pre-ID record in TIDE; or (c) there are discrepancies with the student’s test record.
3
Students who took two parts of the same test in different test modes receive a separate scale score for each part. As a result, schools may receive a separate family report for each test part. The district can determine which score corresponds to the student’s test part by checking the district’s downloadable data file in the Online Reporting system, which includes a PBA tested and EOY tested indicator. In these cases, the district can choose the higher score to assign graduation points.
1
2
3
Page 7 │ Understanding Ohio’s State Tests Reports Spring 2015
Figure 2. Family Score Report: Back Page
1. Ohio’s State Test Score: On the top section of the page, a graph displays the student’s scale score and information about how this scale score compares with the average scale score of other students in the state, district and school.
2. Reporting Category Indicators: The top right table on the page lists the reporting categories assessed. It also provides the indicator associated with the student’s performance in each reporting category.
3. Your child’s strengths and weakness: The table at the bottom of the page includes a description of the student’s performance for each reporting category. What This Result Means and Next Steps text provides a detailed explanation of the student’s skills based on the achieved performance level and provides guidance on advancing the student’s capabilities.
1
2
3
Online Score Reports
Online Reporting SystemAuthorized district and school personnel can log in to the Online Reporting System from the Ohio’s State Tests Portal to access and view district and school-level Ohio’s State Tests report of students. For more information on accessing and navigating online score reports, readers should refer to the Accessing Score Reports section of Online Reporting System User Guide. The user guide is available on the Ohio’s State Tests Portal or by clicking the Help button in the Online Reporting System.
Homepage Dashboard
After logging into the Online Reporting System, district- and building-level users will first view district or school aggregation tables on the Homepage Dashboard. The Homepage Dashboard page displays the overall
summary of score data for your district or school and is the starting point for data analysis. You can navigate to more detailed score reports from the Homepage Dashboard page. The score data you see are dependent on your role; for example, a building test coordinator only sees that school’s aggregate data.
Aggregation tables that appear on the Homepage Dashboard page display score data for students by grade and subject and provide access to more detailed subject score reports. Click the corresponding grade or subject cell that contains a value from the table. For example, if you want to view the Ohio’s State Tests subject detail report for Grade 8 Science, click the “Number of Students Tested” or “Percent Proficient” buttons in the Grade 8 Science row.
Figure 3. Homepage Dashboard
School Listing Report
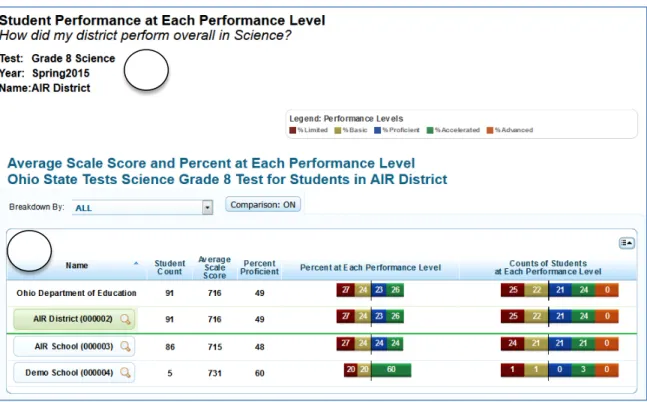
The School Listing Report is the default for district-level users and shows data for the grade and subject selected on the Homepage Dashboard page. A school’s performance data in the selected grade and subject appears together with the associated district and state performances in the selected grade and subject for the purpose of comparison. Authorized district-level users can view the data for each school in their district.
Figure 4. School Listing Report
1. Top of Reports: The title of the report is printed here identifying the test, administration year, and district or school name.
2. Bottom of Reports: This section displays the student count, average scale score, percent proficient, percent at each performance level and count of students at each performance level. Readers also may choose to view reporting categories by using the navigation tool to select Reporting Categories, which will display in this section as seen below.
You can navigate from one score report to another using the exploration menu. Click the magnifying glass symbol next to the school name to open the exploration menu. From the exploration menu drop-down lists, select the report that you wish to view.
Figure 5. Exploration Menu
Using the exploration menu, you can navigate to any report by making different selections under the Who, What and When dimensions. However, the dimension categories that are available depend on your user role, the report you are viewing and the entity level where you have opened the exploration menu. For more information regarding the exploration menu, consult the Online Reporting System User Guide.
1
2
Reporting Categories Report
The Reporting Categories Report shows the percentage of your students in each reporting category indicator. To navigate to the Reporting Categories Report, click the magnifying glass symbol next to the school name in the School Listing Report. The exploration menu appears. On the exploration menu, from the What dimension drop-down list, select Reporting Categories; from the Who dimension drop-down list, select the required entity level; from the When dimension, select Current Admin. Click View.
Figure 6. Reporting Categories Report
1. Top of Reports: The title of the report is printed here identifying the test, administration year and roster name.
2. Bottom of Reports: This section displays the student count, average scale score, percent proficient and percentage of students in each reporting category indicator. Refer to the legend on the top of the report to understand the data represented.
1
2
Student Listing Report
From the School Listing Report, use the exploration menu to navigate to the Student Listing Report. On the Exploration Menu, from the What dimension down list, select Student; from the Who dimension drop-down list, select the required entity level; from the When dimension, select Current Admin.
The Student Listing Report displays all the students associated with the selected school, teacher or roster who have completed the selected test, in addition to any students who were assigned a condition code.
Figure 7. Student Listing Report
1. Top of Reports: The title of the report is printed here identifying the test, administration year and roster name.
2. Bottom of Reports: This section displays each individual student by name, SSID, scale score and performance level. Readers may also choose to view reporting categories by using the exploration menu to select Reporting Categories.
1
2
Individual Student Report
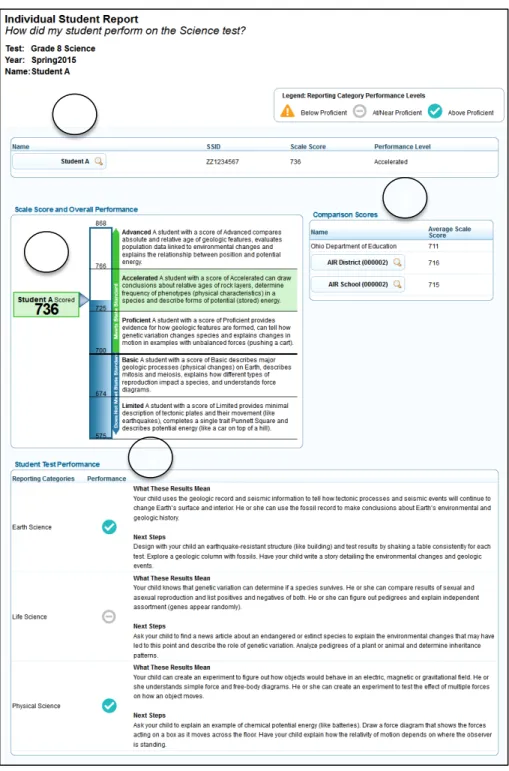
The Individual Student Report displays the student’s scale score and performance level for the selected
subject. The report includes a graphical representation of a student's performance and text explaining what the achieved performance level means and possible next steps. The report includes average scale scores for the state, district and school for comparison purposes.
From the Student Listing Report, use the exploration menu to navigate to the Student Listing Report. On the exploration menu, from the What dimension down list, select Student; from the Who dimension drop-down list, select the required entity level; from the When dimension, select Current Admin.
Figure 8. Individual Student Report
1
2
3
4
1. Student Information — The table includes the student’s name, overall scale score and performance level.
2. Scale Score and Overall Performance — The barrel chart visually depicts the student’s performance level based on his or her overall scale score. It also includes a brief description of the student’s
performance level.
3. Comparison Scores — The Comparison Scores table includes the average scale score for the state, district and school with which the student is associated.
4. Student Test Performance — The Student Test Performance table includes two elements. First, the table lists the student’s indicators for each reporting category. Refer to the legend on the top of the report to understand the data represented. Second, the What This Result Means and Next Steps text provides a detailed explanation of the student’s skills based on the achieved performance level and provides guidance on advancing the student’s capabilities.
Glossary
Computer-Based Testing — When taking the test on the computer or supported device, students make their answer choices using the mouse or keyboard, and they may use various testing tools, such as the
strikethrough tool or the highlighter tool, as they work. Once they have completed the test, they submit their answers electronically. Before exiting the assessment and submitting their responses, the program takes students to a screen that identifies questions that are answered, unanswered and marked for review. Items — Test questions that students are required to answer.
Ohio’s Learning Standards — Ohio’s Learning Standards define expectations for student learning in Ohio’s classrooms. Find information about Ohio’s Learning Standards on the Ohio Department of Education website at education.ohio.gov.
Performance Level — Ohio reports five performance levels (or standards): Limited, Basic, Proficient, Accelerated or Advanced.
Reporting Category — Reporting categories represent groups of similar student skills or content standards assessed within each grade and subject.
Reporting Category Indicators — The report shows student performance on the subset of items associated with a reporting category with an indicator, rather than with scale scores or raw scores.
Scale Score — A scale score is a conversion of a student's raw score on a test to a common scale that allows for a numerical comparison between students.
SSID — Statewide student identifier