Independent Fiscal Office
Fiscal Implications of a York County
School District Consolidation
About the Independent Fiscal Office
The Independent Fiscal Office (IFO) provides revenue projections for use in the state budget process along with impartial and timely analysis of fiscal, economic and budgetary issues to assist Commonwealth residents and the General Assembly in their evaluation of policy decisions. In that capacity, the IFO will not support or oppose any policies it analyzes, and will disclose the methodologies, data sources and assumptions used in published reports and estimates.
Independent Fiscal Office
Rachel Carson State Office Building, 2
ndFloor
400 Market Street
Harrisburg, PA 17105
Telephone:
717-230-8293
E-mail:
contact@ifo.state.pa.us
Website:
www.ifo.state.pa.us
Staff Contacts: Matthew Knittel, Director
Mark Ryan, Deputy Director
___________________________________________________________
The Independent Fiscal Office was created
by the Act of Nov. 23, 2010 (P.L.1269, No.120).
-INDEPENDENT FISCAL OFFICE
Second Floor, Rachel Carson State Office Building 400 Market Street
Harrisburg, Pennsylvania 17105
December 12, 2014
The Honorable Seth Grove, Stan Saylor, Ron Miller,1 Keith Gillespie, Will Tallman and Mike Regan:
This report addresses the fiscal implications of a consolidation of York County school districts. The analysis provides a snapshot of a consolidated district using revenue and expenditure data reported for fiscal year 2012-13.
The analysis considers the range of cost savings that may be obtained by consolidation of district-level administration as well as the effects on taxpayers of countywide real estate and earned income taxes. It also addresses the classification of a countywide district and the effect of consolidation on state funding, debt service and salary schedules for instructional employees. By design, the analysis is broad-based, and it does not delve into specific transitional, administrative, legal or logistical issues that would be associated with a detailed discussion of consolidation.
Per the policy of the Independent Fiscal Office, this report will be posted to the office website no later than the third business day following transmittal. The office welcomes any questions or comments regarding this analysis. Inquiries can be submitted to contact@ifo.state.pa.us. Sincerely, MATTHEW J. KNITTEL Director 1 Retired November 30, 2014.
-Table of Contents
Section 1: Introduction ... 1
Section 2: Scope of Analysis ... 3
Section 3: Characteristics of a Consolidated York County School District ... 5
Classification ... 5
Taxing Authority ... 7
Demographics ... 8
Revenues and Expenditures ... 10
Section 4: Administrative Costs ... 13
Statewide Comparison ... 13
York County District-Level Administrative Costs ... 16
Section 5: Local Tax Revenue ... 17
Earned Income Tax ... 18
Real Estate Tax ... 20
Property Tax Reduction Allocations ... 21
Section 6: State Funding ... 25
Basic Education Funding ... 25
Social Security and Retirement (PSERS) ... 26
Transportation ... 27
Special Education Funding and Accountability Block Grants ... 27
Section 7: Standardization of Salaries for Instructional Staff ... 29
Section 8: Debt and Debt Service ... 33
Section 9: Consolidated District Real Estate Tax Rates ... 35
Impact on Median Homesteads and Median Wage Earners ... 39
Section 10: Summary of Findings ... 43
Appendix A: District Characteristics ... 47
Appendix B: State Funding by District ... 51
Appendix C: Administrative Costs ... 53
Appendix D: Computation of Property Tax Reduction Allocations ... 55
Independent Fiscal Office
Page 1
Section 1: Introduction
School district consolidation receives attention as a means for achieving cost savings or efficiencies. The concept is relatively straightforward in that combining multiple smaller school districts into a single larger one has the potential to create an economy of scale and allow for administrative streamlining. School district residents are interested in learning whether consolidation could facilitate real estate tax reductions, program enhancements or a combination of the two.
Other effects of consolidation are more complicated and may not be widely understood. For example, combining school districts will result in a single tax base for real estate and earned income taxes. Therefore, some taxpayers might pay more and others less than they do under separate districts. In addition, consolidation also may affect formulas that distribute state education funding and real estate tax relief, resulting in changed funding levels.
This report responds to a request that the Independent Fiscal Office (IFO) provide a broad overview of the fiscal implications from the consolidation of the 15 individual school districts that are located entirely in York County.2 The goal is to provide information to public officials and residents that will facilitate general discussions about consolidation, its impact on public school financing in York County and, ultimately, how it would affect taxpayers.
The analysis is divided into multiple sections, which proceed as follows:
Section 2 provides information regarding the scope of the report and identifies the major issues addressed in the analysis.
Section 3 addresses the characteristics of a potential countywide district, including its classification. The section also compares such a district to statewide averages for certain demographic, revenue and expenditure data elements.
Section 4 compares administrative spending for the York County districts to comparable districts statewide and provides an estimate of district-level administrative spending within York County.
Section 5 discusses local taxes under consolidation, with specific focus on the earned income tax, real estate tax and property tax relief.
Section 6 addresses the potential changes in state funding for a consolidated district, including basic education funding and subsidies for retirement contributions, Social Security contributions and transportation.
2
The West Shore School District is excluded from the analysis because it is only partially located in York County. The Northern York County School District, despite being served by a different intermediate unit than the other York County districts, is included in the analysis because it is located entirely in the county.
Page 2 Independent Fiscal Office
Section 7 outlines the potential costs associated with a standardization of salaries for instructional staff in a consolidated district.
Section 8 addresses debt service and debt outstanding for York County school districts.
Section 9 presents potential real estate tax rates for a consolidated district using various scenarios for earned income tax rates and administrative cost savings. The section also presents the impact of the potential real estate and earned income tax rates under each scenario on hypothetical households representing median homestead properties and median earned incomes in the separate districts.
Independent Fiscal Office
Page 3
Section 2: Scope of Analysis
The analysis offers a snapshot of potential real estate tax rates under a hypothetical consolidated York County district using fiscal year (FY) 2012-13 as the basis for analysis (also referred to as the base year).3 It utilizes data and performs computations on the assumption that a consolidated York County school district had been in existence for the entire base year.4 Using this convention, it further assumes that a consolidated district would have: (1) been governed by a single body, (2) had a district-wide tax base and (3) levied uniform tax rates within its boundaries. The prospect of administrative savings motivated the request for the report; therefore, the analysis specifically examines the magnitude of potential savings that could have been obtained from combining certain district-level administrative functions. However, it does not address consolidation of building-level administrative or instructional staff, classes or school buildings, nor does it consider the realignment of boundaries that determine where a student would have attended school.
Specific issues addressed in the report are as follows:
Local taxation. The analysis estimates the average real estate tax millage in the county for the base year and compares that millage rate to the rates actually levied by the individual districts. It also computes consolidated district real estate tax millage rates incorporating (1) various assumptions for the rate of the earned income tax; (2) changes in state funding; (3) costs to standardize the salaries of instructional staff; and (4) various levels of administrative savings resulting from consolidation.
Property tax relief. The analysis estimates the consolidated district property tax reduction allocation under Special Session Act 1 of 2006 (from the state tax on slot machines) and compares it to the Act 1 funds actually received by the individual districts. The analysis also computes the amount of property tax relief for homestead owners in a consolidated district and compares it to the amount provided to homestead owners in each of the individual districts.
State education funding. The analysis computes the basic education funding subsidy, the transportation subsidy and the state shares of retirement and Social Security contributions for a consolidated district and compares those amounts to the funds actually received by the individual districts.
Potential administrative savings. The analysis estimates the amount the individual school districts spent on district-wide administration in the base year
3
..FY 2012-13 is the most recent year for which data are available from the Pennsylvania
Department of Education.
4
..For the purpose of the analysis, the consolidated district is treated as fully phased-in and the costs or issues related to a transition from individual districts to a consolidated district generally are not addressed.
Page 4 Independent Fiscal Office
(excluding the cost of administering individual school buildings) and computes the dollar value for each one percent of such administrative cost. It outlines the potential savings that could have been obtained at various thresholds of administrative consolidation (e.g., 25 percent, 50 percent or 75 percent), but does not make any assumptions regarding the cost of administering a consolidated district.
Other issues. The analysis addresses the following issues:
o The classification of a consolidated school district and the major differences in taxing authority for the different classes of districts; and
o The cost of standardizing salaries for instructional staff in a consolidated district.
The scope of the analysis does not include a determination of the appropriate administrative staffing levels for a consolidated district. Also, it does not attempt to estimate the expenditures that would have been required to manage a district with the second highest number of students in the state. Instead, it proceeds with the assumption that some level of savings could have been obtained by combining the district-level administrative functions performed by 15 individual school districts and provides estimates of such savings at various thresholds.
The broad-based approach used in this analysis is not designed to address the transitional, legal, logistical or administrative questions that will arise if discussions on consolidation advance beyond the preliminary stages.5 Due to the large number of districts involved, these issues would be complex and the General Assembly may wish to address them in enabling legislation that outlines the parameters of consolidation. Such issues include:
The status of referendums that authorized earned income tax increases in exchange for the elimination of the occupation tax.
The authority, if any, of a consolidated district to levy certain taxes that are currently restricted or grandfathered (e.g., business privilege or mercantile taxes, amusement taxes and occupation taxes).
The application of the Act 1 index (limiting increases in real estate tax rates) to a consolidated district in its first year of existence.
The combination of 135 school board members (15 districts, 9 members each) into one governing body.
5
For example, some of the transitional issues that would affect school district finances include the standardization of textbooks, curriculum, computer technology and networks, benefits and support staff salaries.
Independent Fiscal Office
Page 5
Section 3: Characteristics of a
Consolidated York County School District
This section provides a broad overview of certain characteristics of a countywide school district in York County. Pennsylvania law classifies school districts by total population, and statutes governing school districts often make distinctions based on the district’s classification. Therefore, the section addresses the classification of a countywide district and the taxing authority under such classification.
The section also makes general, statewide comparisons on demographic, revenue and expenditure data elements to give readers a sense of how a countywide district would have compared to other districts in the state. Appendix A contains graphs displaying the results for each York County district and compares the districts to each other.
Classification
School districts are classified based on population in the most recent census. The statute provides for the following classifications: 6
First Class – population greater than or equal to 1,000,000.
First Class A – population greater than or equal to 250,000 and less than 1,000,000.
Second Class – population greater than or equal to 30,000 and less than 250,000.
Third Class – population greater than or equal to 5,000 and less than 30,000.
Fourth Class – population less than 5,000.
Table 3.1 displays the classification and total population for each York County school district based on the 2010 Census.7 Three York County districts are classified in the second class and 12 districts are classified in the third class.8 No York County school districts were classified in the fourth class, and that classification is omitted from the discussion in the remainder of this section.9
6
..Section 202 of the act of March 10, 1949 (P.L. 30, No. 14), known as the “Public School Code
of 1949.”
7
..As of FY 2012-13, the 2000 U.S. Census was the most recent census for which data were
available. The 2010 U.S. Census is used for this table because the data are now available and there would be no change in classification for the consolidated district.
8
..Based on a 2010 population of 37,538 (up from 29,242 in the 2000 Census), the Central York
School District would move from a district of the third class to a district of the second class. The Secretary of Education certifies changes in classification.
9
..For the topics addressed in this section, the statutory provisions governing fourth class school districts are generally the same as those governing districts in the second and third classes.
Page 6 Independent Fiscal Office
Table 3.1
Population Totals by School District
School District Population Classification
York City 43,718 2
Dallastown Area 41,093 2
Red Lion Area 38,264 2
Central York 1 37,538 3
Spring Grove Area 27,384 3
South Western 26,736 3
Dover Area 25,748 3
West York Area 23,636 3
Northeastern York 23,371 3
York Suburban 21,658 3
Northern York County 21,083 3
Southern York County 20,833 3
South Eastern 19,544 3
Eastern York 19,542 3
Hanover Public 15,289 3
York County Total 405,437 --
1
The increase in population from the 2000 Census to the 2010 Census supports a change in classification from third class to second class. The Secretary of Education must certify a change in classification before it can take effect.
Sources: U.S. Census Bureau, 2010 Census and Pennsylvania Department of Education.
The Secretary of Education must approve the classification of school districts. According to the 2010 Census, the population across all 15 York County school districts equals 405,437, which would signify a classification of first class A. Currently, the Pittsburgh School District is the only district classified as first class A.
Table 3.2
Top Five School Districts in Pennsylvania by 2010 Population
School District Population Classification
Philadelphia City 1,526,006 1 Pittsburgh 309,086 1a Allentown City 118,036 2 Bethlehem Area 116,811 2 Central Bucks 114,377 2
York County Total 405,437 --
Sources: U.S. Census Bureau, 2010 Census and Pennsylvania Department of Education.
Independent Fiscal Office
Page 7
Taxing Authority
School districts levy various taxes to raise local revenue for district expenditures. The rates and authority to levy taxes may vary by classification. This subsection primarily focuses on the real estate and earned income taxes, but it does note other taxes for which the taxing authority or tax rates differ between classifications. Certain taxes are restricted to districts that imposed the tax before a specific date (e.g., mercantile, business privilege and amusement taxes), and those taxes are not addressed in this subsection.10
Real Estate Taxes
First class A school districts have no limit on real estate tax rates.
Second and third class districts have no effective rate limit because they are allowed unlimited millage for salaries, rentals and debt, which constitute the vast majority of school district expenditures.11
Earned Income Taxes
First class A school districts may levy an earned income tax on residents at a rate not exceeding 2.0 percent.12
Second and third class districts may levy an earned income tax on residents at a rate not exceeding 1.0 percent.13
o School districts share the 1.0 percent earned income tax with the municipality in which the taxpayer resides, if the municipality also levies the tax. When shared, the school district portion is limited to 0.5 percent.
o School districts may eliminate taxes on the occupation of residents and replace such taxes with a higher earned income tax. This tax is in addition to any other earned income tax levied.14
School districts of the first class A, second class and third class may increase their earned income taxes to reduce the real estate tax.15
Other Taxes
School districts of the first class A, second class and third class may levy a per capita tax that is subject to sharing with the municipality.16
10
Restrictions on mercantile or business privilege taxes are addressed in section 533 of the act of December 13, 1988 (P.L.1121, No.145), known as the "Local Tax Reform Act." Restrictions on amusement taxes are addressed in 53 Pa.C.S. §8402(c).
11
See section 672 of the Public School Code of 1949.
12
See section 652.1 of the Public School Code of 1949.
13
See Chapter 3 of the act of December 31, 1965 (P.L. 1257, No. 511), known as the “Local Tax Enabling Act.”
14
See Chapter 4 of the Local Tax Enabling Act.
15
See Chapter 3 of the act of June 27, 2006, Special Session 1 (P.L. 1873, No. 1), known as the “Taxpayer Relief Act.”
16
Page 8 Independent Fiscal Office
School districts of the second and third class may levy a per capita tax up to $5 on residents age 18 or older.17 This tax is in addition to any other per capita tax.
School districts may levy a realty transfer tax of 1.0 percent, which is subject to sharing with the municipality.18
Demographics
The 15 districts of York County vary in terms of general demographics, such as the overall population density of the school district, the total number of students and the percentage of students that are from low income families. Each school district faces somewhat difference challenges based on these demographics. Unless otherwise noted, all data are from the Pennsylvania Department of Education. These three demographic items are discussed below.
Population Density
Population density is calculated by dividing the total population of a district by the total square miles of land within the district. In 2010, York City had the highest population density of any York County school district and the fifth highest in the state with a population density of 8,260 people per square mile.19 Hanover Public, which ranked second in the county, had a population density about half the level of York City. The lowest density district in York County was South Eastern, with 180 people per square mile. York County as a whole had an overall population density of 480 people per square mile.If it had been one school district, it would have ranked as the 195th most densely populated school district in Pennsylvania.
Student Population
An often used measure of total student population in a school district is average daily membership (ADM).20 In the 2012-13 school year, York City had an ADM of 7,636, which ranked first in York County and 33rd in the state. York City’s ADM was a little over four times larger than Hanover Public’s ADM of 1,860, which was the smallest in the county. York County as a whole had an overall ADM of 62,304 students. If it had been one school district, it would have had the second largest number of students in the state, behind only the School District of Philadelphia.
17
See section 672 of the Public School Code of 1949.
18
See Chapter 3 of the Local Tax Enabling Act.
19
U.S. Census Bureau. 2010 Census and Small Area Income and Poverty Estimates.
20
ADM of a district is the total number of students in a school district for which the school district is financially responsible to educate and “…is calculated by dividing the aggregate days membership for all children on active rolls by the number of days the school district is in session.” Pennsylvania Department of Education. Financial Data Elements. Average Daily Membership.
Independent Fiscal Office
Page 9
Students from Low Income Families
The total number and share of students that qualify for free or reduced lunch within each school district is representative of the low income student population.21 In the 2012-13 school year, 86.9 percent of York City students qualified for free or reduced lunch, ranking first in York County and seventh in the state. At the other end of the spectrum, Southern York County ranked last in the county at 21.2 percent. On average, 34.7 percent of York County students qualified for free or reduced lunch. If it had been one school district, it would have ranked near the middle of all districts throughout Pennsylvania.
Demographic Summary
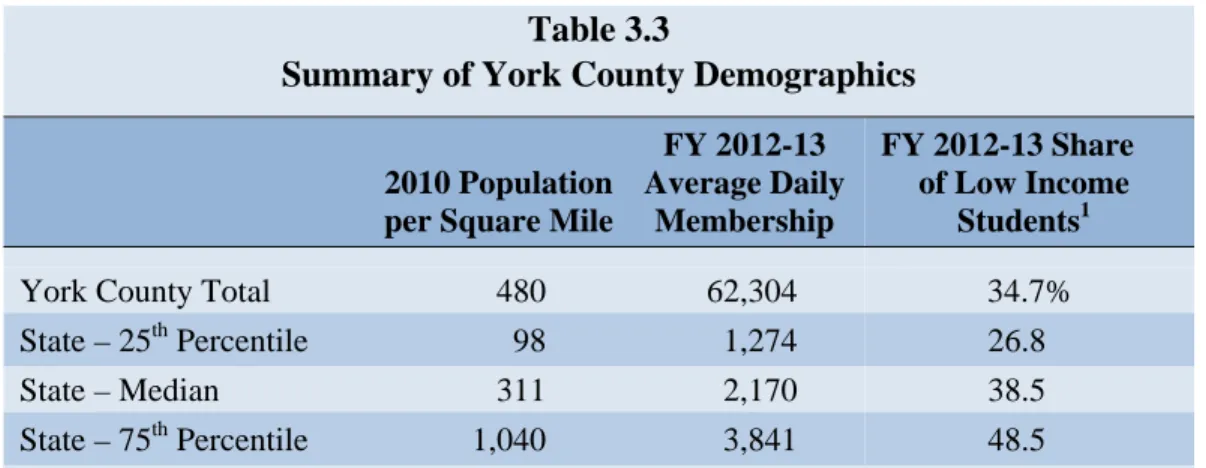
Table 3.3 summarizes how York County would have compared to the remaining 485 Pennsylvania districts if the county had been one school district. Compared to the rest of the state, York County had a population density greater than the state median population density. For ADM, York County would have ranked second in the state and would have placed near the 100th percentile. For the share of low income students, York County had a slightly smaller share of low income students compared to the median district. See Appendix A for more detailed graphs on the demographic differences between the individual school districts within York County.
Table 3.3
Summary of York County Demographics
2010 Population per Square Mile
FY 2012-13 Average Daily Membership FY 2012-13 Share of Low Income Students1
York County Total 480 62,304 34.7%
State – 25th Percentile 98 1,274 26.8
State – Median 311 2,170 38.5
State – 75th Percentile 1,040 3,841 48.5
1
The share of students that qualify for free or reduced lunch.
Source: Pennsylvania Department of Education. Calculations by the IFO.
21
Beginning in FY 2013-14, several school districts in Pennsylvania decided to provide breakfast and lunch to all students through the Community Eligibility Provision offered by the United States Department of Agriculture (USDA). In these districts, the USDA now calculates low-income students through means other than individual household applications. The USDA uses information such as a family’s participation in the Supplemental Nutrition Assistance Program (SNAP), Temporary Assistance for Needy Families (TANF), and the Food Distribution Program on Indian Reservations (FDPIR). The FY 2012-13 data used for this demographic factor are not impacted by the change.
Page 10 Independent Fiscal Office
Revenues and Expenditures
Considerable attention is paid to disparities in school district expenditures and funding on a per student basis. Spending levels vary based on the demographics of the district, the local tax base and state funding. This subsection uses per student measures of operating expenditures, state revenue, local revenue, and personal income to illustrate the differences among the individual districts and how a countywide average would have compared to other districts across the state. Unless otherwise noted, the data used in this subsection are from the Pennsylvania Department of Education.
Total Operating Expenditures per ADM
Operating expenditures vary from district to district on a per student basis, and they include expenses for instructional services, support services and operation of non-instructional services.22 For FY 2012-13, York Suburban ranked first in York County with per student operating expenditures of $14,053. The county district with the lowest per student operating expenditure was Northern York County at $10,483, which ranked 459th statewide. The countywide average for per student operating expenditures was $12,221, which would have ranked in roughly the middle (rank of 245th) of all Pennsylvania school districts.
State Revenue per ADM
Every school district in Pennsylvania receives state funding such as subsidies for basic and special education, Accountability Block Grants, reimbursement for a portion of pension and Social Security costs and transportation subsidies. However, state support varies significantly from district to district on a per student basis.
For FY 2012-13, York City’s state revenue per ADM of $8,854 ranked first in York County and 62nd statewide. This amount was 1.7 times higher than second highest district in York County (South Eastern, $5,179) and almost 3.9 times higher than the York County district with the lowest state revenue per ADM (York Suburban, $2,285). York County on average received $4,493 per ADM in state revenue. If it had been one school district, it would have ranked 166th among all Pennsylvania districts. Section 6 discusses state funding of public schools in additional detail.
22
..As used in this report, operating expenditures include all district expenditures except
expenditures for facilities acquisition, construction and improvement services (expenses classified under function code 4000) and other expenditures and financing uses (expenses classified under function code 5000). Expenses under function code 5000 include debt service and various other financing uses as well as special and extraordinary expenses. More information about debt and debt service expenditures can be found in Section 8.
Independent Fiscal Office
Page 11
Local Revenue per ADM
The largest share of revenue for most school districts comes from local sources. The primary sources of local revenue are real estate and earned income taxes. Generally, more affluent districts generate a much higher share of local revenue than districts with a high poverty level.
For FY 2012-13, York Suburban’s local revenue per ADM of $13,611 ranked first in York County and 39th statewide. This amount was almost 2.9 times greater than York City, which ranked last in York County and 405th statewide at $4,734 per ADM. If York County had been one district, it would have had an average local revenue per ADM of $9,182, which would have been ranked 160th among all Pennsylvania districts. Section 4 discusses local funding of public schools in additional detail.
Local School District Taxable Income per ADM
One way to measure local wealth, or the capacity to fund education, is by average state taxable income per ADM. This metric is equal to the ratio of total state taxable income of all residents in a district to the ADM of that district. A high ratio may indicate that a district is generally wealthier than lower-ranked districts and has some flexibility to raise local revenues. A low ratio may indicate that a district faces constraints on its ability to raise local funds to finance education. In order to generate the same amount of local tax revenue per student, a district with a lower taxable income ratio would have to impose a higher tax rate than a district with a higher taxable income ratio.
The Department of Revenue publishes annual state taxable income by school district. Using 2012 state taxable income per ADM for FY 2012-13, York Suburban had the highest taxable income per ADM in York County and ranked 59th statewide at $247,709. This amount was almost 4.5 times greater than the taxable income per ADM in York City at $55,087. York City ranked last in this category in York County and third to last among all Pennsylvania districts. Only Chester-Upland in Delaware County and Reading in Berks County had a lower taxable income per ADM within the state. The average taxable income per ADM for York County was $150,707, and if it had been one district, it would have ranked 238th statewide among all Pennsylvania districts.
Revenues and Expenditures Summary
Table 3.4 below summarizes how York County would have compared to the remaining 485 Pennsylvania districts if the county had been one school district. In terms of operating spending per ADM, York County on average was very close to the state median. The state revenue per ADM of the district would have been $1,230 lower than the state median. For local revenue per ADM, York County contributed an average of $1,860 more than the state median. In terms of local taxable income per ADM, York County was slightly higher than the state median district (York County - $150,707; state median - $149,429). See Appendix A for more detailed graphs on the revenue and expenditure differences between the individual school districts within York County.
Page 12 Independent Fiscal Office
Table 3.4
Summary of York County School District Revenues and Expenditures
(FY 2012-13) Operating Expenditures per ADM State Revenue per ADM Local Revenue per ADM Local Taxable Income per ADM
York County Total $12,221 $4,493 $9,182 $150,707 State – 25th Percentile $11,218 $3,996 $5,226 $124,285
State – Median $12,232 $5,723 $7,322 $149,429
State – 75th Percentile $13,805 $7,916 $10,205 $193,634
Source: Pennsylvania Department of Education.
Independent Fiscal Office
Page 13
Section 4: Administrative Costs
The purpose of this section is to estimate base year district-level administrative costs for York County school districts. This estimate will serve as the basis for establishing the potential administrative savings under consolidation and the dollar value for each one percent reduction in administrative cost. The section begins with a general comparison of full-time administrative staff and overall administrative costs between York County school districts and statewide averages. These statewide comparisons are broad-based because these data include building-level expenses. York County districts are compared to districts of similar size across the state.
The remainder of the section addresses costs for York County school districts that are associated with district-level administration, which is consistent with the request that motivates this report. The parameters of the report exclude any changes in staffing or administration at individual school buildings; therefore, those costs have been excluded from the analysis. Examples of district-level staff include superintendents, assistant superintendents, program supervisors or coordinators, and operations staff. Building principals and their staff are not considered to be district-level and they are not included.
Statewide Comparison
This subsection compares the York County school districts to other Pennsylvania school districts on two broad-based measures: (1) full-time administrators and coordinators per 1,000 students; and (2) administrative spending per student.23,24 Both measures include building-level staff and associated costs to facilitate statewide comparisons based on the available data.
23
..More detailed administrative cost information was only obtained for York County school
districts, but it is not used in the statewide comparison because it was not available for all districts.
24
..The number of full-time administrators and coordinators are from the 2012-13 Professional and Support Personnel Data and Statistics report published by the Pennsylvania Department of Education. Administrative spending is from the annual financial reports that school districts file with the department. This includes spending classified under function codes 2300 (support services – administration) and 2500 (support services – business). Other function codes contain administrative costs, but school districts are not required to separately report such costs to the department on the annual financial report. The vast majority of administrative costs are reported under the 2300 and 2500 function codes. The 2300 function code includes some building-level expenditures.
Page 14 Independent Fiscal Office
Across all Pennsylvania school districts, the analysis reveals an average of 11.1 full-time administrators for every 1,000 students and average administrative spending of $958 per student. However, the averages obscure a disparity in administrators and costs based on the size of the school district. In order to illustrate the impact of district size, the 500 school districts in Pennsylvania were separated into 10 equal groupings, or deciles, based on the number of students in the district.
Figure 4.1 shows that the number of full-time administrators/coordinators and administrative spending declines on a per student basis as the number of students increases. The average number of administrators per 1,000 students ranged from 15.9 in the first decile (districts with 862 students or less) to 9.7 in the tenth decile (districts with more than 6,012 students). For administrative costs per student, the average amount ranged from $1,449 for the first decile to $885 for the tenth decile.
These data suggest that some economies of scale may exist for school district administration. The clearest example of this result is provided by the steep decline in both measures between the first and fourth deciles. After the fifth decile, the declines become inconsistent and less pronounced. These data are not conclusive because other factors, for which there were no controls, may influence the number of administrators and level of spending. For example, some large urban districts in difficult financial situations may
Figure 4.1
Administrators and Spending by Number of Students in PA School Districts
Source: Pennsylvania Department of Education. Calculations by the IFO.
8 9 10 11 12 13 14 15 16 17 $800 $900 $1,000 $1,100 $1,200 $1,300 $1,400 $1,500 1 2 3 4 5 6 7 8 9 10
Number of Students by Decile; 1=smallest; 10=largest
Administrative Spending per Student (left)
Independent Fiscal Office
Page 15
limit administrators and spending because of necessity, rather than the intent to take advantage of an economy of scale. Furthermore, the results for the tenth decile are highly influenced by the School District of Philadelphia, which accounts for 29 percent of the student population in that decile.
York County school districts average 10.7 administrators per 1,000 students and administrative costs of $881 per student, both of which are below the statewide averages. Table 4.1 provides data for each county district and a comparison to the average of the other districts in the same decile.
Table 4.1
Comparison of York County Districts to Statewide Averages
(FY 2012-13) School District Decile1 Full-Time Administrators and Coordinators per 1,000 ADM Administrative Spending per ADM ($) Value2 State
Avg.3 Diff. Value4
State Avg.5 Diff. Central York 9 9.0 11.4 -2.4 $894 $925 -$31 Dallastown Area 10 8.7 9.7 -1.0 731 885 -154 Dover Area 8 9.7 11.6 -1.9 778 976 -198 Eastern York 6 9.3 11.4 -2.1 992 952 40 Hanover Public 5 16.7 12.3 4.4 1,155 1,063 92 Northeastern York 8 12.1 11.6 0.5 843 976 -133
Northern York County 7 10.5 11.9 -1.4 911 980 -69
Red Lion Area 9 10.3 11.4 -1.1 703 925 -222
South Eastern 7 14.6 11.9 2.7 1,029 980 49
South Western 8 11.7 11.6 0.1 813 976 -163
Southern York County 7 11.0 11.9 -0.9 1,095 980 115
Spring Grove Area 8 14.0 11.6 2.4 849 976 -127
West York Area 7 12.4 11.9 0.5 1,010 980 30
York City 10 7.3 9.7 -2.4 784 885 -101
York Suburban 7 12.7 11.9 0.8 1,267 980 287
York County Average all 10.7 11.1 -0.4 881 958 -77
1
The 500 Pennsylvania school districts were ranked from lowest to highest based on ADM, broken into 10 groups of 50 each and assigned a decile with 1 containing the smallest districts and 10 containing the largest.
2
The number of full-time administrators and coordinators (from the Department of Education’s Professional and Support Personnel Data and Statistics report) divided by ADM (in thousands).
3
The weighted average number of administrators and coordinators per 1,000 students for schools in the same decile.
4
Administrative spending per student, including building-level administration, based on AFR function codes 2300 and 2500.
5
The weighted average administrative spending per student for schools in the same decile. Source: Pennsylvania Department of Education. Calculations by the IFO.
Page 16 Independent Fiscal Office
York County District-Level Administrative Costs
The York County district-level administrative costs for the base year (FY 2012-13) were estimated using two methods.
Under the first method, the IFO obtained the microdata underlying the Department of Education’s 2012-13 Professional and Support Personnel Data and Statistics report. Records for administrators and coordinators were extracted and subjected to additional analysis on a district-by-district basis to ensure that instructional staff and building-level administrators were removed.25
The analysis of these records revealed aggregate salaries of $12.7 million for staff identified as district-level in the 15 York County districts. This amount does not include benefits, overhead and other costs associated with district-level administration. An examination of detailed information on school district expenditures for administrative support suggests that salaries represent 50 percent of the total cost of that function.26 Therefore, the examination of the microdata yields an estimate of $25.4 million for district-level administration.
Under the second method, the IFO identified categories of expenditures that were determined to be for district-level administration: (1) detailed annual financial report (AFR) data available from the Department of Education; and (2) supplemental data obtained directly from York County school districts.27
The analysis of data for expenditures in the listed classifications indicates that administrative spending was $30.2 million in FY 2012-13.
The two methods used to estimate district-level administrative spending in York County school districts provide estimates that are relatively close given the limitations of the data. The position classification and expenditure classification methods suggest estimates of $25.4 million and $30.2 million, respectively. The average of the two methods is $27.8 million, which is the amount used in this analysis. At this level of district-level spending, each one percent of cost reduction yields savings of $278,000.
Section 9 addresses the impact of administrative cost reductions on real estate tax rates under three hypothetical scenarios: 25 percent reduction (savings of $6.95 million), 50 percent reduction (savings of $13.90 million) and 75 percent reduction (savings of $20.85 million).
25
..See Appendix D for a detailed list of positions that were included.
26
..Based on an IFO analysis of annual financial report data supplied by the Pennsylvania
Department of Education.
27
Independent Fiscal Office
Page 17
Section 5: Local Tax Revenue
This section: (1) displays countywide local revenue for the base year, (2) estimates the countywide revenues from the earned income and net profits tax (hereafter referred to as the earned income tax, or EIT) at various rates, (3) displays the impact of consolidating the real estate bases of the individual districts into a uniform countywide levy and (4) estimates the impact of consolidation on property tax relief for homesteads and farmsteads. These pieces are incorporated in the computations of real estate tax rates in Section 9.
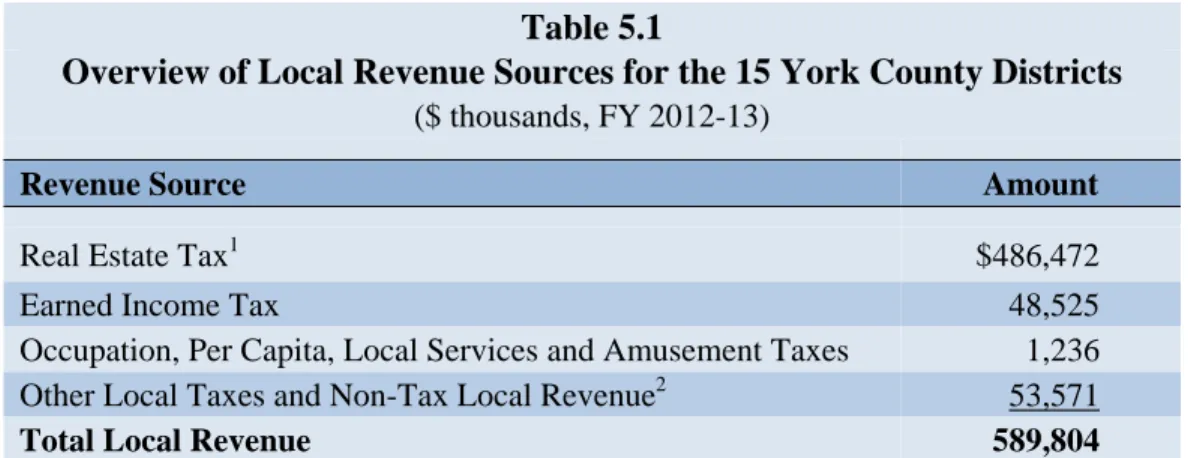
York County school districts collected $589.8 million in local revenue in the base year. Table 5.1 summarizes the amounts by source. The real estate tax accounted for $486.5 million, or 82.5 percent, of all local revenue. The earned income tax was the second largest source at $48.5 million, or 8.2 percent of local revenue. The subsections that follow discuss the earned income tax and real estate tax in more detail.
The remaining revenues are divided among numerous smaller revenue sources. Minor taxes (e.g., occupation, per capita and amusement taxes) generated $1.2 million, or 0.2 percent. Collectively, all other local revenue sources produced $53.6 million, or 9.1 percent.
Table 5.1
Overview of Local Revenue Sources for the 15 York County Districts
($ thousands, FY 2012-13)
Revenue Source Amount
Real Estate Tax1 $486,472
Earned Income Tax 48,525
Occupation, Per Capita, Local Services and Amusement Taxes 1,236 Other Local Taxes and Non-Tax Local Revenue2 53,571
Total Local Revenue 589,804
1
Includes $17.724 million in property taxes levied by school districts but paid by state-financed property tax relief provided to owners of homestead and farmstead properties.
2
Includes delinquent taxes, realty transfer tax, public utility realty tax, payments-in-lieu-of-tax, earnings on investments, food service revenue, and revenue from district activities. Source: Pennsylvania Department of Education. Calculations by the IFO.
Page 18 Independent Fiscal Office
Earned Income Tax
York County school districts reported $48.5 million of earned income tax collections in the base year. Earned income tax rates ranged from 0.5 percent to 0.9 percent, with a weighted average of 0.56 percent. Table 5.2 displays the rate, collections and estimated earned income in each district. The last two rows of the table display the weighted average tax rate as well as the amount of EIT generated countywide for each tenth of a percent in the rate.
Table 5.3 provides estimates for EIT collections at rates of 0.5, 1.0, 1.5 and 2.0 percent.28 The estimates are based on the actual collections and revenues for each tenth of a percentage point displayed in Table 5.2.
Table 5.2
York County Earned Income Tax Collections
($ thousands, FY 2012-13)
School District EIT Rate EIT Collections Earned Income1
Central York 0.50% $4,660 $931,947 Dallastown Area 0.50 5,126 1,025,238 Dover Area 0.90 5,285 587,217 Eastern York 0.50 1,923 384,577 Hanover Public 0.50 1,393 278,644 Northeastern York 0.50 2,362 472,350
Northern York County 0.75 4,170 556,017
Red Lion Area 0.50 3,910 781,996
South Eastern 0.50 2,110 421,904
South Western 0.50 3,133 626,655
Southern York County 0.80 4,319 539,884
Spring Grove Area 0.50 2,137 427,343
West York Area 0.50 2,450 489,990
York City 0.50 2,749 549,804
York Suburban 0.50 2,799 559,735
Total -- 48,525 8,633,300
Weighted Average 0.56
Amount generated each 0.1% of EIT 8,633
1
Earned income tax collections divided by the statutory rate.
Source: Pennsylvania Department of Education. Calculations by the IFO.
28
Section 652.1of the Public School Code of 1949 authorizes a school district of the first class A to impose an earned income tax at a rate not exceeding 2.0 percent. (See Section 3.) The hypothetical rate scenarios in this subsection are based on that statutory provision. The rate limits applicable to a consolidated York County district would depend on the ultimate classification of the district and the applicability of various laws authorizing and restricting the earned income tax.
Independent Fiscal Office
Page 19
Table 5.3
Earned Income Tax Estimates for Selected Tax Rates; Countywide Basis
($ thousands, FY 2012-13)
EIT Rate Estimated Amount Difference from Actual
0.5% $43,167 -$5,359 1.0 86,333 37,808 1.5 129,500 80,974 2.0 172,666 124,141 Source: IFO.
Table 5.4 displays the impact of a change in the EIT rate on taxpayers receiving the median earned income in their respective school districts.
Table 5.4
Impact of Earned Income Tax Rate Changes on Earners at the Median Income
School District Median Income1 EIT Rate Current EIT
Change in Liability at Stated Rate
0.5% 1.0% 1.5% 2.0% Central York $49,354 0.50% $247 $0 $247 $494 $740 Dallastown Area 47,500 0.50 238 0 238 475 713 Dover Area 42,397 0.90 382 -170 42 254 466 Eastern York 39,891 0.50 199 0 199 399 598 Hanover Public 32,949 0.50 165 0 165 329 494 Northeastern York 42,233 0.50 211 0 211 422 633
Northern York County 49,477 0.75 371 -124 124 371 618
Red Lion Area 43,504 0.50 218 0 218 435 653
South Eastern 51,167 0.50 256 0 256 512 768
South Western 46,705 0.50 234 0 234 467 701
Southern York County 53,980 0.80 432 -162 108 378 648
Spring Grove Area 45,991 0.50 230 0 230 460 690
West York Area 40,859 0.50 204 0 204 409 613
York City 22,904 0.50 115 0 115 229 344
York Suburban 49,645 0.50 248 0 248 496 745
1
Median taxable compensation and net profits on 2012 state personal income tax returns reporting taxable compensation and net profits in excess of $5,000.
Source: IFO.
Page 20 Independent Fiscal Office
Real Estate Tax
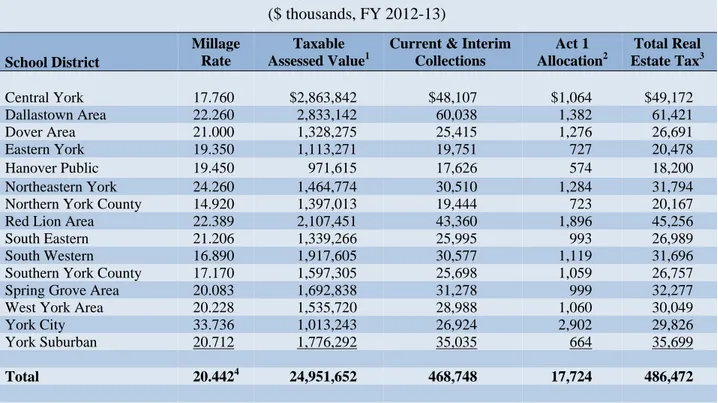
For FY 2012-13, York County school districts collected $486.5 million from the real estate tax levy. Tax rates ranged from 14.920 mills to 33.736 mills, with a weighted average of 20.442 mills.
Table 5.5 displays the real estate tax millage rates, assessed values and total collections for each district. For the purpose of this analysis, total real estate tax includes the Act 1 property tax reduction allocations. Table 5.6 compares the millage rate each district levied in FY 2012-13 to the countywide average.
Table 5.5
Real Estate Tax Millage Rates, Assessments and Collections
($ thousands, FY 2012-13) School District Millage Rate Taxable Assessed Value1
Current & Interim Collections Act 1 Allocation2 Total Real Estate Tax3 Central York 17.760 $2,863,842 $48,107 $1,064 $49,172 Dallastown Area 22.260 2,833,142 60,038 1,382 61,421 Dover Area 21.000 1,328,275 25,415 1,276 26,691 Eastern York 19.350 1,113,271 19,751 727 20,478 Hanover Public 19.450 971,615 17,626 574 18,200 Northeastern York 24.260 1,464,774 30,510 1,284 31,794
Northern York County 14.920 1,397,013 19,444 723 20,167
Red Lion Area 22.389 2,107,451 43,360 1,896 45,256
South Eastern 21.206 1,339,266 25,995 993 26,989
South Western 16.890 1,917,605 30,577 1,119 31,696
Southern York County 17.170 1,597,305 25,698 1,059 26,757
Spring Grove Area 20.083 1,692,838 31,278 999 32,277
West York Area 20.228 1,535,720 28,988 1,060 30,049
York City 33.736 1,013,243 26,924 2,902 29,826 York Suburban 20.712 1,776,292 35,035 664 35,699 Total 20.4424 24,951,652 468,748 17,724 486,472 1
The 2012 assessed value.
2
The property tax reduction allocation authorized under Special Session Act 1 of 2006. School districts levy the real estate tax and credit owners of homestead and farmstead properties a fixed dollar amount per property, which varies by district. The districts receive reimbursement from the Commonwealth for those tax reductions. This analysis treats the Act 1 allocations as local real estate tax collections, notwithstanding the state reimbursement, because the funds are received pursuant to the real estate tax levied by the school district.
3
Includes current and interim property tax collections and the Act 1 allocations.
4
Weighted average based on the millage rates levied, weighted by taxable assessed value. Total real estate tax collections equate to a countywide collection rate that is estimated to have been about 95.373 percent for FY 2012-13.
Sources: Pennsylvania Department of Education and the York County Assessment & Tax Claim Office. Weighted average calculated by the IFO.
Independent Fiscal Office
Page 21
Table 5.6
Comparison of Actual Millage Rates to the Countywide Average
1(FY 2012-13) School District Actual Millage Difference From Weighted Average (Mills) Percent Difference
Northern York County 14.920 -5.522 -37.0%
South Western 16.890 -3.552 -21.0
Southern York County 17.170 -3.272 -19.1
Central York 17.760 -2.682 -15.1
Eastern York 19.350 -1.092 -5.6
Hanover Public 19.450 -0.992 -5.1
Spring Grove Area 20.083 -0.359 -1.8
West York Area 20.228 -0.214 -1.1
York Suburban 20.712 0.270 1.3
Dover Area 21.000 0.558 2.7
South Eastern 21.206 0.764 3.6
Dallastown Area 22.260 1.818 8.2
Red Lion Area 22.389 1.947 8.7
Northeastern York 24.260 3.818 15.7
York City 33.736 13.294 39.4
1
Countywide weighted average levy equals 20.442 mills.
Source: Pennsylvania Department of Education. Calculations by the IFO.
Property Tax Reduction Allocations
School districts receive proceeds from the state tax on gross terminal revenues of slot machines, which they are required to use for property tax relief for the owners of homestead and farmstead properties. The funds provided to the school districts are termed “property tax reduction allocations,” and they are transmitted through the Property Tax Relief Fund based on a formula that was established in Special Session Act 1 of 2006.29
In FY 2012-13, the 15 York County school districts received $17.7 million that was split among more than 106,000 homestead and farmstead properties.30 The homestead/ farmstead tax relief ranged from $108 per eligible property in Central York to $490 per eligible property in York City. The weighted average for all county school districts was $167. See Appendix D for additional information about the property tax reduction allocations, number of homesteads and farmsteads and amount of tax relief per eligible property in each of the school districts.
29
See Chapter 5 of the act of June 27, 2006, Special Session 1 (P.L. 1873, No. 1), known as the “Taxpayer Relief Act.”
30
Each homestead and farmstead in a school district receives the same dollar amount of property tax relief. The relief is applied to the tax bill in the form of a reduction in taxable assessed value.
Page 22 Independent Fiscal Office
Table 5.7
Real Estate Taxes Levied on the Median Homestead in the Base Year
(FY 2012-13) School District Median Homestead1 Millage Rate Homestead Exclusion Real Estate Tax Central York $144,010 17.760 $108 $2,450 Dallastown Area 148,660 22.260 126 3,183 Dover Area 120,730 21.000 168 2,367 Eastern York 120,250 19.350 130 2,197 Hanover Public 121,110 19.450 165 2,191 Northeastern York 119,330 24.260 200 2,695
Northern York County 153,450 14.920 118 2,172
Red Lion Area 137,580 22.389 180 2,900
South Eastern 164,540 21.206 178 3,311
South Western 148,750 16.890 151 2,361
Southern York County 176,700 17.170 172 2,862
Spring Grove Area 136,190 20.083 121 2,614
West York Area 120,400 20.228 164 2,271
York City 53,780 33.736 490 1,324
York Suburban 134,630 20.712 114 2,674
1
Based on properties that qualify for the homestead exclusion.
Sources: Median homestead values are from the York County Assessment & Tax Claim Office. Millage rates are from the Pennsylvania Department of Education. Calculations are by the IFO.
Based on a recalculated formula that substitutes a potential countywide district for the 15 individual districts, the countywide district would have received $16.9 million in property tax reduction allocations. This amount is a reduction of $0.8 million compared to the amount the 15 individual districts actually received. This funding would be divided equally among all homesteads and farmsteads in the countywide district. Accordingly, the property tax relief for each homestead and farmstead property would be $159, a reduction of $8 (-5 percent) compared to the average for the individual districts. See Appendix D for more detail on the computations for the consolidated district.
The relatively minor change in average property tax relief for the entire county does not reflect the substantial individual variation in results for the school districts. For example, the owners of each homestead property in York City School District would receive a reduction of $331 (-68 percent). At the other end of the spectrum, the owners of each homestead property in Central York School District would have received an additional $51 (47 percent). The changes for each school district are detailed in Table 5.8. These changes are reflected in the estimates for the real estate taxes paid by the median homestead properties in Section 9.
Independent Fiscal Office
Page 23
Table 5.8
Change in FY 2012-13 School Property Tax Relief
Based on a Consolidated District
School District
Change Per Homestead/ Farmstead Dollars Percent
Central York $51 47%
York Suburban 45 40
Northern York County 41 35
Spring Grove Area 38 31
Dallastown Area 33 26
Eastern York 29 22
South Western 8 5
West York Area -5 -3
Hanover Public -6 -4
York County Average -8 -5
Dover Area -9 -5
Southern York County -13 -8
South Eastern -19 -11
Red Lion Area -21 -12
Northeastern York -41 -20
York City -331 -68
Page 24 Independent Fiscal Office
Independent Fiscal Office
Page 25
Section 6: State Funding
This section outlines the funding that was received by school districts for the following categories: basic education, special education, Accountability Block Grants, Social Security and Medicare taxes and Public School Employee Retirement System (PSERS) employer contributions. Unless noted otherwise, data for the individual York County school districts for FY 2012-13 are from the Pennsylvania Department of Education. See Appendix B for state funding by district. Table 6.1 displays a summary of state funding for York County districts and a comparison to funding if the districts had been consolidated for FY 2012-13.
Table 6.1
Summary of Consolidated and Current Funding Scenarios
($ thousands, FY 2012-13)
State Revenue Item
Consolidated School District
Total of
Individual SDs Difference
Basic Education Funding $151,054 $156,473 -$5,419
Special Education Funding 30,129 30,129 0
Accountability Block Grants 3,081 3,081 0
Social Security and Medicare Taxes 14,465 14,646 -181
PSERS Contributions 23,935 24,234 -299
Transportation Subsidy 15,409 14,629 780
Total 238,073 243,192 -5,118
Sources: Pennsylvania Department of Education and IFO.
Overall, the consolidated York County school district would have received approximately $5.1 million less in state funding. Much of that difference is attributable to lower basic education funding. The following subsections provide detail for each state revenue item. The impact of changes in state funding is reflected in the computation of real estate tax rates in Section 9.
Basic Education Funding
Basic education funding is distributed through a statutory formula that establishes a base amount with supplements for districts that meet certain criteria.31 In practice, the base amount for a school district is often the same as the district received in the prior year, sometimes with an across-the-board increase. This practice is often referred to as a “hold harmless” provision because funding does not vary based on student counts, aid ratios or other factors.
31
Page 26 Independent Fiscal Office
For FY 2012-13, each York County school district received the same base level of funding as the prior year. York City qualified for two of the eight possible supplements, but no other county district qualified. The supplements received by York City were (1) the English Language Learner High Incidence Supplement ($1.6 million) and (2) the Charter School Extraordinary Enrollment Supplement ($3.8 million).
The “hold harmless” provision was assumed to apply to the consolidated district, and it was calculated as the sum of the base amounts for each individual district. A countywide school district would not have been eligible for the supplements received by York City under the criteria used in FY 2012-13 because it would not have met the statutory thresholds for concentration of English language learners and the concentration of charter school students.32 No other supplements would have applied to a countywide district; therefore, the analysis estimates a reduction of $5.4 million in basic education funding.
Social Security and Retirement (PSERS)
The formula used to calculate the state share of Social Security and Medicare taxes and the state share of PSERS contributions is based, in part, on the date an employee was hired and the market value / personal income (MV/PI) aid ratio of the school district.33 For the Social Security and Medicare taxes reimbursement, school districts receive 50 percent of the employer share for employees initially hired on or before June 30, 1994, and an amount equal to the employer share multiplied by the MV/PI aid ratio for all others. The mechanics of the reimbursement are the same for the employer share of PSERS retirement contributions, except that the aid ratio calculation applies to employees initially hired after June 30, 1995.34
The MV/PI aid ratio was computed for the consolidated district. Using aggregate salary data that showed school district salaries broken down by date of hire, the state reimbursements were determined based on the new aid ratio. Application of the new ratio for a consolidated district reduced the overall reimbursements by $0.1 million for Social Security and Medicare and $0.3 million for PSERS contributions compared to the amounts received by the individual districts.
32
The countywide English language learner concentration was 3.08 percent. A concentration equal to or greater than 6 percent and a MV/PI aid ratio equal to 0.7 or greater was required for the supplement. The countywide charter school concentration was 4.38 percent. A concentration of 14 percent, ADMs greater than 5,000 and a MV/PI aid ratio of 0.8 or greater was required to receive the charter supplement. The FY 2011-12 MV/PI aid ratio applicable to FY 2012-13 basic education funding and supplements was calculated to be .5337 for the consolidated district.
33
See 24 Pa.C.S. §8535 for the statutory provision. See Appendix B for the applicable aid ratios.
34
Independent Fiscal Office
Page 27
Transportation
School districts receive a state subsidy that covers a portion of the costs for transporting students.35 The analysis assumes no changes in the location where public school students would have attended school under consolidation, and it does not include any change in the underlying cost of transportation for such students. The subsidy for the consolidated district was estimated by computing the consolidated district Market Value Aid Ratio (MVAR), substituting that value in the transportation subsidy formula and holding all other formula components constant. Using the consolidated district MVAR, the transportation subsidy would have increased by $0.7 million.
Special Education Funding and Accountability Block Grants
The analysis estimates that special education funding and Accountability Block Grants would have remained unchanged for a consolidated district compared to the sum of the amounts received by the individual districts.Funding levels for special education in FY 2012-13 were roughly the same for each year since FY 2008-09; therefore, the analysis assumes the new district would have received the sum of the amounts received by the individual districts ($30.1 million).
The FY 2012-13 Accountability Block Grant funding for each York County school district was unchanged compared to FY 2010-11 and FY 2011-12.36 The analysis assumes a consolidated district would have received the sum of the amounts received by the individual districts ($3.1 million).
35
See section 2541 of the Public School Code of 1949. See Appendix B for the applicable aid ratios.
36
Page 28 Independent Fiscal Office
Independent Fiscal Office
Page 29
Section 7: Standardization of Salaries for
Instructional Staff
Each school district in York County has a salary schedule for instructional staff. The classifications, number of steps in each classification and the salaries at each step of those schedules vary between districts, sometimes significantly. For example, the FY 2012-13 starting salaries in York County ranged as follows: from $41,957 to $48,250 for a Bachelor’s degree, from $42,253 to $69,775 for a Master’s degree and from $45,012 to $75,379 for a Master’s degree +30.37 Table 7.1 displays the pay range for selected classifications for each district that provided information. The table includes the three classifications that were common to all responding school districts.
Table 7.1
School District Salary Ranges for Selected Classifications (FY 2012-13)
School District
Bachelor’s1 Master’s Master’s+302 Lower Upper Lower Upper Lower Upper
Central York $41,957 $49,553 $43,766 $72,340 $49,553 $78,127 Dallastown Area 47,883 72,624 69,775 78,387 75,379 83,991 Dover Area3 - - - - - -Eastern York 44,196 76,763 44,787 77,332 46,796 79,265 Hanover Public 44,437 68,509 55,775 76,977 58,481 80,091 Northeastern York 43,389 61,700 45,351 75,585 48,374 79,667 Northern York County 40,558 65,707 42,253 68,293 44,133 70,585 Red Lion Area 42,656 67,710 50,959 71,972 56,644 77,654 Spring Grove Area 44,777 57,383 54,714 70,355 58,201 74,132 South Eastern 43,723 66,449 45,181 72,580 45,910 78,179 South Western 47,029 70,268 50,716 76,567 53,716 79,267 Southern York County 47,300 65,750 52,500 77,675 56,500 81,755 West York Area 42,000 52,853 43,560 72,600 45,012 75,932
York City 44,144 61,020 48,640 78,616 51,638 81,914
York Suburban 48,250 60,400 56,950 73,200 63,750 80,000
1
For school districts that have two separate classifications for bachelor’s degrees, the upper end of the scale in this table represents the upper end of the second, or higher, classification.
2
Other salary classifications used by school districts include Master’s+15, Master’s+45 and Master’s+60 or Doctorate. Not every school district uses each classification.
3
The Dover Area School District declined to provide the requested information.
Source: York County school districts.
37