I
N T E R N A T I O N E L L AH
A N D E L S H Ö G S K O L A NHÖGSKOLAN I JÖNKÖPING
T h e I m p ac t o f FD I on
E c o no m i c G ro wt h
The Case of China
Bachelor thesis within Economics
Author: Anna Ek 820412-2926 Tutor: Professor Scott Hacker
J
Ö N K Ö P I N GI
N T E R N A T I O N A LB
U S I N E S SS
C H O O LJönköping University
U t l än d sk a d i re kt i n ve s te r in g ar s
påverkan på ekonomisk tillväxt
En studie av Kina
Kandidat uppsats inom Nationalekonomi Författare: Anna Ek 820412-2926 Handledare: Professor Scott Hacker
Ph. D. James Dzansi Jönköping Juni 2007
Bachelor’s Thesis in Economics
Title: The Impact of FDI on Economic Growth
The Case of China
Author: Anna Ek
Tutor: Professor Scott Hacker
Ph. D. James Dzansi
Date: June 2007
Subject terms: China, Gross Domestic Product, Economic Growth,
Devel-opment
Abstract
The aim of this study is to investigate the impact of foreign direct investment (FDI) on economic growth in China during the period 1994-2003. The theoretical framework shows that FDI has a positive impact on economic growth because it serves as a channel through which new technology is transferred from one country to another and thereby it increases output and GDP in the recipient country. Previous researchers’ work on the subject has also been reviewed to be able to interpret the results.
The research is based on secondary data for 30 different regions in China. The empirical results show a positive but insignificant effect of FDI as a fraction of GDP on the level of GDP when the regression model includes all 30 regions. When the four poorest regions that have almost no inflow FDI are excluded, the regression model continues to show a positive effect of FDI on the level of GDP and in addition, the result is statistically signifi-cant at the 6 % level.
Kandidat uppsats inom Nationalekonomi
Titel: Utländska direktinvesteringars påverkan på ekonomisk
tillväxt
En studie av Kina
Författare: Anna Ek
Handledare: Professor Scott Hacker, Doktorand James Dzansi
Datum: Juni 2007
Ämnesord Kina, Bruttonationalprodukt, ekonomisk tillväxt,
utveck-ling
Sammanfattning
Denna uppsats studerar utländska direkt investeringars påverkan på den ekonomiska till-växten i China under perioden 1994-2003. En teoretisk modell har utvecklats, som visar att utländska direktinvesteringar har en positiv inverkan på ekonomisk tillväxt, då de fungerar som en kanal via vilken ny teknologi överförs till från ett land till ett annat och därmed ökar produktion och BNP i det mottagande landet. Tidigare studier kring ämnet presente-ras också.
Undersökningen är baserad på sekundär data för 30 olika regioner i Kina. De empiriska re-sultaten tyder på en positiv men icke-signifikant effekt av utländska direktinvesteringar som en del av BNP på BNP-nivån, när regressionsmodellen inkluderar alla 30 regioner. När de fyra fattigaste regionerna med ett näst intill obefintligt tillflöde av utlandsinvesteringar är utelämnade, visar regressionsmodellen ett signifikant resultat på 6 procents signifikantsnivå.
Table of contents
1
Introduction...3
1.1 Problem statement ... 3 1.2 Previous research... 4 1.3 Purpose ... 5 1.4 Outline ... 52
FDI and its implications...6
2.1 Definitions of FDI ... 6
2.2 Different types of FDI... 6
2.3 Major sources and destinations of FDI ... 7
3
Theoretical framework ...8
3.1 Growth accounting equation and the Solow residual... 8
3.2 The new growth theory ... 9
3.3 The Romer growth model ... 9
3.4 The link between technology creation and growth... 10
4
Descriptive Statistics ...12
4.1 China’s regions... 12
4.2 Trends of GDP growth in China... 12
4.2.1 Regional disparities in GDP ... 13
4.3 Trends of FDI inflow to China ... 14
4.3.1 Regional disparities in FDI ... 16
5
Empirical result and analysis...18
5.1 Data selection and model specification... 18
5.2 Regression result... 19
5.2.1 Regression model 1 ... 19
5.2.2 Regression model 2 ... 19
5.3 Analysis ... 20
6
Conclusion and suggestions for future research...21
References...22
Figures
Figure 3.1 Production function with constant marginal product of capital…….9
Figure 4.1 GDP growth in China 1995-2003... 13
Figure 4.2 Total FDI inflow 1994-2003…. ... 15
Tables
Table 4.1 GDP per capita 1998-2003... 14Table 4.2 FDI inflow 1998-2003... 17
Table 5.1 Regression result for China with 30 observations... 19
1
Introduction
Ever since the economic reforms and the open door policy of 1978, China has experienced a dramatic industrialization. The Chinese government, heavily influenced by Communist values, recognized the need to open up to international trade and become more of a capi-talistic country. Hence, reduced trade barriers followed with the economic reform, which has made foreign direct investment increase rapidly. The country made a desired commit-ment by entering the World Trade Organization, WTO in 2001. The expected conse-quences were a more rapid development of industries and increasing competition, because of even fewer restrictions on foreign investment.
There are a lot of reasons for writing this thesis about China. The country is today an eco-nomic giant with a growth in real GDP of on average nine percent per year since 1981 and exceeding 10 percent in recent years. If this growth rate persists, the World Bank is expect-ing China to become the largest economy in the world in the near future. China has devel-oped clear policies to enhance an export processing type of FDI and has therefore set up several economic zones for foreign investors (Kelley & Luo, 1999). For China, this be-comes a clear advantage when it be-comes to attracting FDI, and according to the UN Con-ference on Trade and Development, China surpassed the United States as the world’s larg-est recipient of FDI for the first time in 2002 (Economist Intelligence Unit, 2004).
1.1
Problem statement
What determines long-term growth in an economy is the productivity growth, which in turn is dependent on technological progress. In his growth model, Solow (1957) explained growth in output as a result of capital accumulation and technological progress. However, one of the greatest limitations of this model is that it fails to explain how and why techno-logical progress occurs. This gave way to development of the endogenous growth theory, which recognizes technological progress as an endogenous variable and also emphasizes the importance of knowledge accumulation (Todaro & Smith, 2006).
Large companies have realised the need for advanced technology in order to stay competi-tive and increase their productivity. In this process, R&D and human capital play key roles, hence the amount that companies spend on education and research and development has increased rapidly. Separately from the knowledge accumulation that is being generated do-mestically, foreign direct investment transfers new knowledge from abroad. There is a gen-eral consensus that there are many positive effects of FDI, such as increased capital accu-mulation, transfer of advanced technology, skilled labour and superior managerial knowl-edge. These factors can help to stimulate the industries and in the long run, generate pro-ductivity growth in the economy.
Ever since the early start of the economic reforms in China, growth has been a lot faster in the coastal areas of the country. The most rapid growth rates in the 1980’s and 1990’s were seen in the southern part of Guangdong in the Pearl River Delta. This was due to large in-flows of capital and skilled labor from the neighbor Hong Kong (EIU, 2005). Since then, the province of Guangdong has also benefited from investments from Taiwan, a country that has invested over 100 billion US dollars in China since the 1990’s. The north-east provinces have benefited from their rich neighbors Japan and South Korea, and the Yangtze Delta with Shanghai as the main market has experienced a tremendous boom in the past decades.
On the other hand, the interior part of China has not been an active player in this story of success. When investors rushed to explore the coastal areas, the interior was left behind. There was hope that the development in the eastern part of China would give way to simi-lar development in the interior, but what happened was that migrant workers from the in-terior part of China moved to the cities to find work and then sent their income back to their rural homes. Serious attempts to attract foreign and domestic investors into central China started in 1997, and over the latest years both foreign and domestic investors have been increasingly engaged in projects in the central parts of China and to some extent, even in the western parts (EIU, 2005). This is primarily because of increasing costs in the coastal areas and the potential of a less explored consumer market. But even though foreign inves-tors are showing increasing interest for these parts of China, poor infrastructure and pov-erty makes it a slow process.
1.2
Previous research
In previous studies on FDI and its effect on output and growth, many economic research-ers have concluded that there are positive effects of foreign direct investment on economic development. There have been several studies concerning FDI as an engine for growth in East Asia. Kim and Hwang (2000) study the role of FDI in South Korea’s economic growth. They state that a stable inflow of foreign investment could help South Korea to re-cover from the severe financial crisis of the 1990s but that the country still fears that in-creasing FDI will lead to foreign control over the domestic economy. They conclude that FDI and the presence of MNC’s may help a country in crisis to overcome its difficulties and their empirical results show that FDI inflow lowers the odds of a currency crash. Chan (2000) studies the relationship between FDI and economic growth in Taiwan. He focuses on whether movements in FDI can be used to predict movements in economic growth. Chan also studies whether FDI Granger causes economic growth. That is, he is trying to find out, not only if FDI contributes to increased growth, but also if increased economic growth contributes to the inflow of FDI. His conclusion is that on the one hand, foreign investors are attracted by GDP growth and on the other hand, FDI contributes to that growth, not by increased capital accumulation but through a channel of technological ad-vancement.
When doing the research for this thesis, I found a lack of studies concerning China and the impact of FDI on GDP in the various regions of this large country. In addition, the fact that China currently is a very interesting subject from the point of view of international in-vestments, clearly justifies this investigation. The theoretical effect of FDI on growth is discussed by Moosa (2002), who focuses on the host country’s ability to reap the benefits of the investments. He argues that the impact on growth is highly dependent on the macro economic policy operating in the country of interest. He finds that FDI can have a positive influence on growth, if surplus resources can be absorbed or efficiency increased through reallocations. That means, that if FDI succeeds in improving the efficiency of domestic re-sources, by reallocating them from sectors with low productivity to sectors that are highly efficient, then there will be an increase in domestic output. To a large extent, FDI can also improve efficiency of domestic firms through knowledge spillovers. These knowledge spillovers originate from the human capital that is being transferred through FDI. Helpman et al. (1997) stresses the importance of R&D spillovers in models of growth and they em-phasize FDI as a channnel for technology transfer. Therefore, international R&D spill-overs, induced by investment are key factors in the growth process. But even if FDI is im-portant for developing economies in particular, many economists state that the lack of
in-frastructure and insufficient institutional structures still create problems for these countries to reap the benefits associated with FDI.
1.3
Purpose
The objective of this thesis is to investigate whether there is an impact of FDI on the level of GDP in China’s regions during the time period 1994-2003.
1.4
Outline
This thesis is organized as follows. Section 2 defines FDI and looks at different types of FDI as well as its sources and destinations. Section 3 reviews the theoretical framework that is related to the issues of economic growth and the role of FDI in the growth process. Section 4 shows descriptive statistics with diagrams and tables that help to illustrate the re-search problem. Section 5 constitutes the empirical result and analysis. Section 6 concludes and provides alternatives for future research.
2
FDI and its implications
This section is included with the intention to provide the reader with a deeper knowledge of the concept for-eign direct investment, FDI. It explains the meaning of forfor-eign direct investment, FDI, as well as the differ-ent types of investmdiffer-ent that multinational companies engage in and the major sources and destinations of FDI today.
2.1
Definitions of FDI
Foreign direct investment (FDI) is the process where people in one country obtain owner-ship of assets for the purpose of gaining control over the production, distribution and other activities of a firm in a foreign country (Moosa, 2002). The OECDBenchmark Definition of Foreign Direct Investment (OECD, 1996) defines FDI as “the objective of obtaining a lasting interest by a resident entity in one economy (direct investor) in an entity resident in an economy other than that of the investor (direct investment enterprise)”. The lasting interest reflects the continuation of a long-term relationship between the direct investor and the en-terprise and a considerable level of influence on the management of the enen-terprise.
The terms “influence” or “control” and “long-term” are used to make a distinction be-tween FDI and portfolio investment because the latter is a short-term investment where the investor does not seek to control the firm. The influence over management decisions and productivity is also the part that differentiates FDI from other types of international investments. This influence implies for instance, that the investor has an ability to elect members on the board of directors of the foreign firm or subsidiary (Moosa, 2002). The OECD definition will be used in the discussions regarding FDI throughout this thesis.
2.2
Different types of FDI
The agents that engage in FDI are large multinational companies, also called MNCs. From the perspective of the multinational company, or the investor, there are two major types of FDI: horizontal FDI and vertical FDI.
Horizontal FDI is undertaken when the company wants to expand horizontally to produce the same or comparable goods in the host country as in the home country. Product differ-entiation is a central aspect for horizontal FDI to be successful. There are two main mo-tives for a company to engage in horizontal FDI. The first one is that it is more profitable for the multinational company to be at the foreign location, and the second motive is that the company can save a lot on low-cost inputs, such as labor. In addition, horizontal FDI is often undertaken to make substantial use of monopolistic or oligopolistic advantages, espe-cially if there are fewer restrictions in the host country.
Vertical FDI is undertaken when a company seeks to exploit raw materials, or wants to be closer to the consumer by acquiring distribution outlets. The idea is to make the produc-tion process more cost-efficient by reallocating some stages to low-cost locaproduc-tions. By estab-lishing their own network in the host country, it is easier for the multinational companies to market their products (Brakman, Garretsen & van Marrewijk, 2006).
FDI can take the form of green field investment, mergers and acquisitions (M&As) and joint ventures. Greenfield investment is the process whereby the investing company estab-lishes new production and distribution facilities in a foreign country. Because this form cre-ates new employment opportunities and high value added output, the host country is
gen-erally positive to greenfield investments. An acquisition of, or a merger with an already ex-isting company in a foreign country is another form of FDI. M&As are cheaper than greenfield investments and makes it easier for the investor to get quick market access. But M&As can be harmful to the host country because they may only imply a transfer of own-ership that is followed by layoffs and closing of advantageous activities. Moreover, com-pared to greenfield investments, the acquisition of companies in the host country is gener-ally not as welcomed, since the majority of countries prefer to maintain control over do-mestic companies. Joint venture is the third form of FDI and can be seen as a partnership, either with a company in the host country, a government institution or another foreign company. Joint ventures are often formed to share the risk and expertise. Usually, one partner provides the technical skills and access to financial means, while the other partner offers its local knowledge concerning the market as well as laws and regulations (Moosa, 2002). This is of course very valuable to the foreign company and in particular if the in-vestment takes place in a developing country.
2.3
Major sources and destinations of FDI
Not surprisingly, the major sources of FDI are the high-income developed nations. These countries accounted for over 90 percent of outflowing FDI in the years 1987-1992 and for more than 85 percent in the period 1993-1998. The main recipients of FDI also turn out to be the advanced nations, which in the years 1988-1998 received over 70 percent of inflow-ing FDI. But even though it is clear that the developed countries are the main destinations for FDI, an interesting fact is that ten developing countries make up two-thirds of the total FDI inflow to all developing countries. Among these, China received 30.6 percent. From 1988 to 1997, China experienced a fourfold increase of FDI: during the years 1988-1992, the country received 2.9 % of the total FDI in the world, which can be compared to over 12 percent during the years 1993-1997 (Brakman et. al., 2006). The development of the country has boomed and the growth rate is continuously increasing at a rate that economic history has never seen before. This clearly distinguishes China from other developing economies.
3
Theoretical framework
The theoretical framework will take up growth theories that explain what causes economic growth to in-crease, i.e. what factors are important in the growth process of a country. The role of FDI as a growth en-hancer through the transferring of new technology from advanced economies to developing economies will also be a focus of this section.
3.1
Growth accounting equation and the Solow residual
In growth accounting, a specific production function is used to show two sources of growth. Output grows because of increases in inputs as well as increases in productivity, as a result of improved technology and a highly skilled labor force. Thus, the production function presents a quantitative connection between inputs and outputs:
Y = AF ( K, N ), (3.1)
where Y is output, K is capital, N is labor and A is total factor productivity. The higher A is, the more output is produced (Dornbusch, Fischer & Startz, 2004). By assuming constant returns to scale with respect to capital and labor, equation 3.1 above can be transformed into a specific link between input growth and output growth that relates to Robert Solow’s growth accounting framework from 1957. The growth accounting equation is written as:
∆Y/Y = [(1- ) ×∆ N/N] + ( ×∆ K/K) + ∆A/A (3.2) (Growth = labor share × labor growth + capital share × capital growth + total factor productivity growth).
This growth accounting equation is central in economic growth theory. If the proportional growth rates of output, the capital stock and the labor force in the production function are known, the growth-accounting equation can be used to calculate the growth rate of total factor productivity, A. In addition, it can be used to break down the growth of Y into components, to see the contribution to output from the increase in K, the increase in N, and the increase in A, separately. Thus, the growth-accounting equation allows one to de-compose growth into different parts that in turn, can be ascribed to the apparent factors of the growth of the capital stock and of the labor force and also, to a residual factor. That re-sidual factor is called the Solow rere-sidual and represents the part of growth that is not ac-counted for by increases in the factors of production (Barro, 1999). The total factor pro-ductivity growth is the same thing as the Solow residual and is not observable in the same way as changes in inputs and outputs (Dornbusch et.al, 2004). The Solow residual is meas-ured by turning equation 2.2 around:
∆ A/A = ∆ Y/ Y - [(1 - ) ×∆ N/N] – ( ×∆ K/K) (3.3) There are many reasons that changes in total factor productivity can occur. The efficiency of government regulation, the degree of monopoly in the economy, the degree of human capital in the economy and the educational level of the labor force are only a few factors that affect total factor productivity. In China, government regulations are rigorous and complex, which creates barriers for domestic companies and especially for foreign compa-nies entering the Chinese market. Government regulations and laws have long constituted a main barrier for multinationals by holding back efficient production processes. On the other hand, foreign companies have taken the advantage of the cheap and skilled Chinese labor force, which is one of main arguments for moving their businesses to China.
3.2
The new growth theory
The limits of neoclassical theories in explaining the sources of long-term economic growth have resulted in a lot of dissatisfaction with traditional growth theory. Despite the fact that the Solow Growth model identifies technological progress as determinant of economic growth, the model leaves unexplained what determines the technological advancement. The dissatisfaction with neoclassical growth theory led to the development of the endoge-nous growth theory; also known as the new growth theory, which I find is more related to the subject of this thesis. One way to separate new growth theory from neoclassical growth theory, is by identifying that many endogenous growth theories are expressed by the fol-lowing simple equation, Y = AK. This relationship is illustrated in figure 3.1.
Figure 3.1 Production function with constant marginal product of capital
Here, A represents factors that affect technology and K represents physical as well as hu-man capital. The production function assumes a constant marginal product of capital, which is the most important theoretical difference from the neoclassical assumption of di-minishing marginal product of capital. The constant marginal product of capital implies that investments in physical and human capital could create external economies and im-provements in productivity. The outcome of this is continued long-term growth, which was prohibited by traditional growth theory. Moreover, probably the most interesting part of endogenous growth models is their contribution to explaining the international capital flows between developing and developed countries (Todaro & Smith, 2006).
3.3
The Romer growth model
One of the main contributors to endogenous growth theory is Paul Romer. The Romer growth model is particularly relevant for developing economies, because it deals with tech-nological spillovers that are often present in an industrialization process. Romer’s model starts with the assumption that growth processes originate from the level of thefirm or in-dustry. Because each industry has constant returns to scale in production, the model does not violate the assumption of perfect competition. What then distinguishes Romer is that he assumes that the economy-wide capital stock K has a positive effect on output at the in-dustry level, hence, there is a possibility of increasing returns to scale at the economy level. Knowledge is included in each firm’s capital stock, and this knowledge part is seen as a
K
Y=AK Y
to some extent, depend on investment. If one focuses on the factors relating to industriali-zation, the model has the following format:
Y = AK L 1- K (3.4)
For simplicity, symmetry across industries is assumed, implying that each industry has the same level of capital and labor. Thus, the aggregate production function is as follows:
Y = AK + L 1- (3.5)
After some manipulation of this equation, the per capita growth rate of income in the economy can be shown to be:
g – n = n / [1 – - ] (3.6)
with g representing the output growth rate and n representing the population growth rate. In the Solow model, there are constant returns to scale and no spillover effect ( = 0) hence the growth per capita would end up to be zero in the long run. On the contrary, in the Romer model the factors that stimulate growth are put together. Having > 0 results in g – n > 0, so Y / L is increasing.
What is important to emphasize here, is that the new growth rate theory still relies on some neoclassical assumptions, which can make it inappropriate for developing economies. For instance, underlying assumptions are that there is only one sector of production, or that there is symmetry across industries. A critical factor for structural changes to have substan-tial positive effects on growth is the reallocation of labor and capital between different sec-tors, which is not allowed in the model (Todaro & Smith, 2006). In addition, economic growth is in many developing nations hampered by inefficiencies caused by poor infra-structure, insufficient institutional structures and imperfect markets. This is especially the case for the interior of China, which has had a more sluggish rate of growth than the east-ern area, and these very important factors are overlooked by the new growth theory.
3.4
The link between technology creation and growth
The creation of new technologies requires investment, and the majority of advanced economies devote enormous resources to R&D in their struggle to generate new products and make the production processes more efficient. This accumulation of superior technol-ogy generates a higher level of output. Even though the accumulation of physical capital also leads to higher output, there is a substantial difference between technology and other inputs to production. Technology has a non-physical nature, which means that it is nonri-val and that more than one person can use it. Hence, the transferability of technology can be very beneficial, especially if it is transferred from an advanced country to a developing country. If a developing country is inferior due to the lack of technologies, then technology can be transferred from another country without making that country worse off (Weil, 2005).
Weil (2005) models the link between technology creation and growth and assumes that the level of output per worker is higher with a high level of technological progress. Hence, an increase in the fraction of the labor force involved in R&D will increase the growth rate of output. At the same time, he notes that growth will be higher if the cost of new inventions is low. His conclusion is that spending large amounts on R&D will lower output in the short run, but increase output in the long run. This finding of Weil is similar to Solow’s reasoning in his neoclassical growth model, which states that increasing investment will
cause a drop in consumption in the short run, while in the long run, investment will raise output and thus, increase consumption. However, there is an important difference with physical capital investment and R&D spending, according to Weil. The increase in the growth rate of output due to an increase in R&D is permanent, while in the Solow model, an increase in investment implies a higher steady-state level of output, which means that the effect of this investment increase on the growth of output is only temporary.
According to Mansfield and Romeo (1980), the cheapest means of transferring technology is FDI. They base this on the fact that the firms involved in the FDI in the recipient coun-try have lower cost of products and processes, because they do not have to spend money on acquiring new technology. It is already developed somewhere else at a high cost. FDI is thus an important channel through which new technology can be acquired by developing countries like China at the benefit of a low cost. This technology will increase the output of the country through increased efficiency in production and also create a spillover effect, which means that other firms can take advantage of the technological advancement. The conclusion here is that FDI is crucial in the growth of technological progress, which in turn is the main determinant of output growth.
4
Descriptive Statistics
This section aims to show historical variations in GDP and FDI inflow in China using diagrams and ta-bles. The section includes descriptive statistics for the country as a whole, but the focus will be on the regional disparities among the 30 regions, both regarding levels of GDP and FDI inflow.
4.1
China’s regions
China is divided into 22 provinces, five autonomous regions and four municipalities. The different provinces vary widely in geographic size and population size. The province with the largest population is Henan, with approximately 97.1 million people and the least popu-lous, Tibet, has 2.7 million inhabitants. There has been one recent adjustment to bounda-ries. In March 1997, the municipality of Chongqing with a population of 31 million people, was separated from Sichuan, previously the most crowded province. The remaining mu-nicipalities are Beijing, Shanghai and Tianjin. The autonomous regions identify the pre-revolutionary predominance of non-Han ethnic groups in Guangxi, Tibet, Xinjiang, Inner Mongolia and Ningxia. In addition, China has two special Administrative Regions (SARs), which are Hong Kong and Macau. These are independent from the rest of China and they have their own governments, legal systems and quasi-constitutions (EIU, 2005). I would like to emphasize that this thesis does only include data and research regarding the People’s Republic of China, PRC. That means that data for Hong Kong SAR and Macao SAR have been excluded. In addition, the municipality of Chongqing is considered a part of Sichuan throughout this thesis.
4.2
Trends of GDP growth in China
Until just recently, it has been common for economists world-wide to condemn China’s economic performance and it has often been said that the official GDP growth statistics are overstated. But in 2003, many well-known criticizers changed their stand and instead agreed upon the fact that published Chinese growth statistics were likely to be understated. China experienced a long period of sustained growth from the opening up of the economy in 1979 and this extraordinarily consistent rate of GDP growth has persisted over the years 1995-2003 (Reuvid & Yong, 2005).
From the opening up of the Chinese economy after 1978, the economy has had an average growth rate of 9 percent per year, which is an unmatched achievement for any country in history. Income per capita in China was by 2004 approximately five times higher than in 1978. At this time, growth started to become overheated which consequently pushed the government to try to slow growth back to 9 percent (Todaro & Smith, 2006).
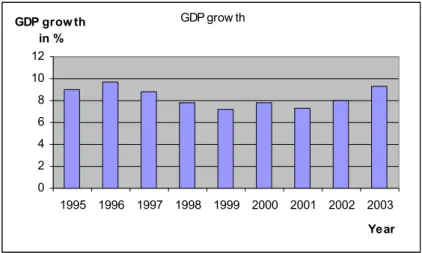
Despite China’s average growth rate around 9 percent, the economy experienced a major decrease in GDP from the middle of the 1990s to the end of the century. As can be seen in figure 4.1, GDP growth in China fell from 9.7 percent in 1996 to 7.2 percent in 1999. Figure 4.1. GDP growth in China 1995 - 2003
GDP grow th 0 2 4 6 8 10 12 1995 1996 1997 1998 1999 2000 2001 2002 2003 Year GDP grow th in %
Source:: Made by the writer from EIU Country Profile : China 1996 - 2005
The Chinese economy suffered from the Asian currency crisis in 1997-1998 and the nega-tive effects on export demand together with reduced domestic consumer spending threat-ened to decrease economic growth below the rate necessary for social stability to be sus-tained. During this time, China tried to protect itself by acting as a good neighbor that was prepared to deploy its resources to maintain regional economic stability. In the years 1999 and 2000 China reached market-opening agreements with both the US and the EU, which clearly removed some major barriers to the country’s entry into the WTO (EIU, 2005). At this time, the Chinese economy was booming and after 2001, GDP has continuously risen as a result of the entry into the WTO and the increase in investments that followed. The growth rate in 2003 reached 9.3 percent.
4.2.1 Regional disparities in GDP
The regional differences in per capita GDP are significant as shown in table 4.1 and reflect the ongoing development in the newly established financial centers in China’s eastearn gions. The years 1998 and 2003 are chosen because it is interesting to see how China re-covered from the financial crisis that occurred in East Asia during the period 1997-1998, by comparing the GDP per capita in the different regions from 1998 to the GDP per capita at the beginning of the new millennium.
Table 4.1. GDP per capita 1998-2003 (US$)
Region GDP per capita 1998
1998 GDP per capita 2003 GDP per capita growth in %ppppppppppppperpercent
Eastern Area 16489 26196 58.87 Beijing 1950 3040 55.90 Tianjin 1688 2925 73.28 Hebei 783 1267 61.81 Inner Mongolia 614 1092 77.85 Liaoning 1128 1794 59.04 Shanghai 3044 4414 45.01 Jiangsu 1211 2033 67.88 Zhejiang 1352 2425 79.36 Fujian 1204 1813 50.58 Shandong 979 1647 68.23 Guangdong 1340 2066 54.18 Guangxi 492 680 38.21 Hainan 704 1000 42.05 Central Area 5158 7788 50.99 Shanxi 566 896 58.30 Jilin 712 1127 58.29 Heilongjiang 896 1403 56.58 Anhui 548 749 36.68 Jiangxi 534 804 50.56 Henan 565 881 55.93 Hubei 758 1087 43.40 Hunan 579 841 45.25 Western Area 4276 6965 62.89 Sichuan 509 758 48.92 Guizhou 278 423 52.16 Yunnan 523 681 30.21 Tibet Shaanxi 437 826 89.02 Shaanxi 464 785 69.18 Gansu 417 605 45.08 Qinghai 529 882 66.73 Ningxia 511 803 69.45 Xinjiang 772 1173 51.94
Source:: Made by the writer from National Bureau of Statistics China 1999-2005.
As expected, the provinces in China’s eastern area have the highest GDP per capita. The differences between the eastern and western area are enourmous. For example, the GDP per capita in Guizhou was only 10 percent of the per capita GDP in Shanghai in 2003. Bei-jing, Shanghai and Guangdong have by far the highest reported GDP per capita in both years. But in contrast, the eastern area does not have the highest growth rate of GDP per capita. In fact, it has the lowest growth rate, whereas the western area has the highest growth rate of per capita GDP. The highest growth rate in GDP per capita in China over the period 1998 to 2003 can be found in the western region Tibet, which historically has been one of the poorest regions in the country. In Tibet, GDP per capita has increased by 89 percent over the five-year period. The often so neglected western regions in China all show very positive growth rates and regions such as Shaanxi and Ningxia both demonstrate remarkable growth rates in per capita GDP.
4.3
Trends of FDI inflow to China
China’s transformation from being a country that attracted practically no foreign invest-ment before 1979 to being the world’s strongest magnet for foreign investors is
extraordi-nary. Ever since Deng Xiaoping’s tour of the southern provinces in 1992, leading to the re-affirmation of the commitment to a market-oriented reform, China has successfully at-tracted FDI. In 2003, China received FDI totaling 442.8 billion yuan, equaling approxi-mately 3.8 percent of GDP. Several companies from the US, the euro area and Japan have entered into China in the past decade and in 2003, FDI into China from these countries constituted about 23 percent of total FDI flowing into China. This was an increase of 127 percent since 1994. The contribution of FDI to China has been mainly to increase produc-tivity, rather than to meet financial needs. China’s domestic savings were almost 47 percent of GDP in 2003 and the capital formation rate was 42 percent (Hon, Poon & Woo, 2005). Thus, FDI does not function as a financial contributor to the balance of payments; its role is rather to improve the productivity of all domestic investment, and thereby contributing to GDP growth (Hon et. al., 2005).
The inflow of FDI from 1994 and onwards has been fairly stable, as can be seen in figure 4.2. However, the Asian financial crisis did cause a drop in FDI beginning in 1997 and con-tinues to affect investments until the start of the millennium. The result can be seen in the figure with a foreign investment reduction from US$44.2 billion in 1997 to US$38.4 in 2000. In 2001, foreign investments start to increase again and in 2002 it reaches another peak at US$49.3 billion. The underlying factor to the increased attraction of FDI in 2001 is most likely China’s entry into the WTO.
Figure 4.2. Total FDI inflow 1994-2003
FDI inflow 0 10000 20000 30000 40000 50000 60000 1994 1995 1996 1997 1998 1999 2000 2001 2002 2003 Year FDI US$ m FDI
Source:: Made by the writer from EIU 1996 - 2005
China’s membership in the WTO helped to reverse the decrease in FDI that occurred in the aftermath of the 1997-1998 Asian financial crisis. The fall in FDI was of great concern to the government because it had played an important part as a driving force behind China’s economic transformation over the 20 preceding years, and in 1994 it accounted for 17.3 percent of total investment in China. During the 1980s and 1990s, generous tax incen-tives and an apparently endless supply of cheap labor provided incenincen-tives for FDI. But these advantages caused less attraction by the end of the 1990s, when investors started to realize the difficulty of running a profitable business in a country with disorganized rules and poor infrastructure (EIU, 2005).
The new membership in the WTO meant an opening up of previously restricted parts of the economy to FDI, which again made foreign investors show interest in the Chinese market. The increase in FDI rose from US$38.4 billion in 2000 to almost US$50 billion in 2002. According to the UN Conference on Trade and Development, China surpassed the United States for the first time in 2002 as the world’s largest recipient of FDI (EIU, 2004). The forecast of Chinese officials is that China will receive over US$100 billion in FDI in every year of the 11th five-year plan from 2006-2010. FDI today is more and more targeted
at selling to the domestic market or acquiring domestic firms, rather than manufacturing for export (EIU, 2004).
4.3.1 Regional disparities in FDI
In the discussion about regional differences and the Chinese regions ability to attract FDI, many economists focus on government FDI–promotion policy as a basic reason for loca-tional disparity in inward FDI flows, while others focus on labor productivity and geo-graphic location. One obviously very important factor in attracting FDI is the financial en-vironment, but to a large extent, market size and factor productivity are also important to foreign investors. Market size signifies the extent that could be sold of a specific output. When looking at the macro level, the number of consumers in the market and the income of those consumers are the primary determinants of market size. Factor productivity signi-fies the degree to which a factor of production adds to production output under average production cost. A good infrastructure and human capital investment are main positive in-dicators of factor productivity at the macro level.
The province with the best proven socioeconomic environment in China is Shanghai. The province has strengthened its power as a magnet for foreign investment and improved the quality of investment by focusing on the development of modern manufacturing and serv-ice industries, as well as industries characterized by high technology. Moreover, Shanghai has a strategic geographic location which makes it an excellent location for business. In contrast, there are eight regions that are developing or underdeveloped by Chinese meas-ures. These are Hainan, Guangxi and Inner Mongolia from the eastern area and Sichuan, Guizhou, Yunnan, Gansu and Xinjiang from the western area. The poor economic devel-opment and low living standards in these regions deeply limits the expansion of their mar-ket size and in addition, restrains foreign investors. Furthermore, the poor conditions of the infrastructure have restricted the socioeconomic development in these regions and lim-ited the inflow of foreign capital. On the other hand, these inferior regions have an enor-mous land area, rich mineral as well as forest resources and a small population, which makes their marginal returns to investment relatively higher than those of the eastern re-gions. Hence, there are many indicators pointing at these regions as the new target loca-tions for MNCs. The signalling effect of prior investments does no longer appear to be a proper factor in determining location (Hon et. al., 2005).
From table 4.2, a number of important characteristics of the distribution of inward FDI flows among the Chinese regions in 1998 and 2003 can be observed. Firstly, FDI can be seen as highly concentrated in the eastern part of China - 87.8 percent in 1998 and 91.2 percent of total FDI inflow in 2003 where the major part goes to Shanghai, Jiangsu, Zheji-ang, Shandong and Guangdong. Secondly, even though aggregate FDI has increased by 18 percent from the years 1998 to 2003, there has been a significant change in the regional dis-tribution of FDI. The table shows that twelve regions have experienced an increase in FDI
inflow, while sixteen regions demonstrate a decrease. This indicates a reallocation of FDI among China’s regions over the five year period.
Table 4.2. FDI inflow 1998-2003 (US$ 10 000)
Region FDI inflow 1998 FDI inflow 2003 Percentage change
Eastern Area 4 142 769 4 829 947 16.59 Beijing 216 800 219 126 1.07 Tianjin 211 361 153 473 -27.39 Hebei 142 868 109 979 -23.02 Inner Mongolia 9082 8854 -2.51 Liaoning 240 624 282 410 17.37 Shanghai 366 774 546 849 49.10 Jiangsu 663 179 1 056 365 59.29 Zhejiang 134 012 498 055 271.65 Fujian 421 211 259 903 -38.30 Shandong 273 100 601 617 120.29 Guangdong 1 303 160 1 009 335 -22.55 Guangxi 88 613 41 856 -52.77 Hainan 71 715 42 125 -41.26 Central Area 439 295 605 918 37.93 Shanxi 24 451 21 361 -12.64 Jilin 40 917 19 059 -53.42 Heilongjiang 52 639 32 180 -38.87 Anhui 27 673 36 720 32.69 Jiangxi 46 496 161 202 246.70 Henan 61 654 53 903 -12.57 Hubei 103 649 179 658 73.33 Hunan 81 816 101 835 24.47 Western Area 94 248 95 467 1.29 Sichuan 37 248 41 231 10.69 Guizhou 4535 4521 -0.31 Yunnan 14 568 8384 -42.45 Tibet Shaanxi - 30 010 - - Shaanxi 30 010 33 190 10.60 Gansu 3864 2342 -39.39 Qinghai - 2522 - Ningxia 1856 1743 -6.09 Xinjiang 2167 1534 -29.21
(Figures for Tibet are missing for the years 1998 and 2003 and for Qinghai for 1998).
Source:: Made by the writer from the National Bureau of Statistics China 1999 – 2005.
Between 1998 and 2003, inward FDI in Zheijiang and Shandong increased by 272 and 120 percent respectively, which are remarkably high numbers. The central part of China shows the highest percentage increase in inward FDI, implying that foreign investors have be-come more interested in this part of the country and have seen its potential. Probably, this is a consequence of the fact that the coastal area has already attracted a lot of companies and investors and is getting crowded. In addition, the competition has increased and prices are rising. So investors are looking at investment opportunities in the central parts, where they are relatively close to suppliers and distributors. One region that has been particularly good at attracting FDI is Jiangxi, which shows an increase in FDI inflow by approximately 247 percent over the period 1998 to 2003. Only two western provinces show an increase in inward FDI, which indicates that these regions still lagged behind the rest of the country quite substantially in 2003. Hopefully, the trend will change and make foreign investors ap-preciate the great opportunities also in this part of China.
5
Empirical result and analysis
In the theoretical framework, I found reasons why FDI can be regarded as a main contributor to output growth and thereby increasing the GDP in an economy. Therefore, I will use econometric analysis to see if there is any empirical result supporting my expectation of a positive effect of FDI on increases in GDP.
5.1
Data selection and model specification
Regression analysis is used to show the empirical findings for this thesis. The econometric model is based on cross-sectional data for the Chinese regions over a time period from 1994 to 2003. The reason that 1994 is chosen as a staring year is that China was still under a planned regime in the pre- 1994 period, characterized by rigorous foreign exchange con-trol regulations. Because of the lack of accurate statistical data after 2003, that is the end year of the analysis. I have divided the time period 1994-2003 into two time periods of five years. The first one includes the years 1994-1998. The reason for the division of the two time periods is that in 1999, the Asian financial crisis was over and most Asian economies had started to recover. I expect to see a positive relationship between the level of GDP and FDI and that the increase in FDI has a significant impact on the increase in GDP. The data is collected from the National Bureau of Statistics China through the China Statistical Yearbook.
In this regression model, the levels of GDP over the period 1999-2003 serves as the de-pendent variable. In order to investigate Granger causality between FDI and GDP, I have used FDI as a share of the GDP level in the period 1994-1998 as the first explanatory able, and the increase in the level of GDP over that period as the second explanatory vari-able. Another reason for using FDI for the period 1994-1998 is that the effect of inward FDI on the level of GDP often cannot be observed during the years that it was actually re-ceived, hence the use of inflow FDI from the first five-year period is more justified.
In addition to FDI, there are many other variables that can explain the increase in a coun-try’s GDP. The disturbance term ut is included with the purpose to adjust for omitted
vari-ables. The model includes data on the levels of GDP and the increase in those levels over the two time periods.
Regression model: GDPt = 1 + 2FDI t-1/GDPt-1 + 3GDPt-1 + ut
The variables are described below:
GDPt = Gross Domestic Product over the years in period t
GDPt-1= Gross Domestic Product over the years in period t-1
FDIt-1 = Foreign Direct Investment and Other Investment over the years in period t-1
t = 1999-2003 t-1= 1994-1998 ut = error term
5.2
Regression result
The econometric models analyses the effect of FDI on the levels of GDP during the pe-riod 1999-2003. The analysis aims to show whether GDP in 1999-2003 was affected by FDI as a share of GDP in the period 1994-1998 after controlling for the increase in levels of GDP over the period 1994 -1998. Data has been collected for 30 regions in China. The first regression model will show the result with all 30 regions included, while the second model excludes the four poorest regions that have no or a very small amount of reported inward FDI. These regions are Tibet, Qinghai, Ningxia and Xinjiang.
5.2.1 Regression model 1
The econometric result for the first regression model, where all 30 regions are included, is presented in table 5.1.
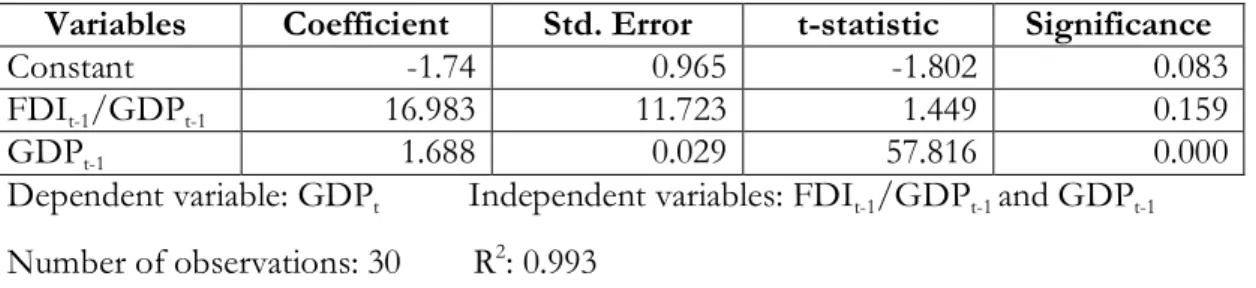
Table 5.1. Regression result for China with 30 observations.
Variables Coefficient Std. Error t-statistic Significance
Constant -1.74 0.965 -1.802 0.083
FDIt-1/GDPt-1 16.983 11.723 1.449 0.159
GDPt-1 1.688 0.029 57.816 0.000
Dependent variable: GDPt Independent variables: FDIt-1/GDPt-1 and GDPt-1
Number of observations: 30 R2: 0.993
When looking at table 5.1, the coefficient of determination, R2, has a very highvalue which
indicates that 99.3 % of the variance in GDPt can be explained by FDIt-1/GDPt-1 and
GDPt-1. However, the good fit is most likely due to a highly linear relationship between GDPt and GDPt-1.
The coefficient estimate for GDPt-1 is significant because the p-value is less than 0.05. The
coefficient estimate indicates that if GDPt-1 increases by one US dollar, GDPt will increase by 1,688 US dollar, ceteris paribus. However, table 5.1 shows that the coefficient estimate for the independent variable of interest, FDIt-1/GDPt-1 is not significant at the 5 %
signifi-cance level when looking at the p-value, since 0.159 > 0.05. Therefore, the result from the first regression model is that the null hypothesis of no linear effect of FDIt-1/GDPt-1 on GDPt cannot be rejected.
5.2.2 Regression model 2
The econometric result for the second regression model, where 26 regions are included is presented in table 5.2.
Table 5.2. Regression result for China with 26 observations
Variables Coefficient Std. Error t-statistic Significance
Constant -2.473 1.160 -2.133 0.044
FDIt-1/GDPt-1 29.792 15.007 1.985 0.059
GDPt-1 1.690 0.035 48.551 0.000
Dependent variable: GDPt Independent variables: FDIt-1/GDPt-1 and GDPt-1
According to table 5.2, R2is still exceptionally high, indicating a very good fit between the
variables. Here 99.2 percent of the variance in GDPt can be explained by FDIt-1/GDPt-1
and GDPt-1, a result almost identical to that of the previous model.
The difference with this result, which is of great importance, is that the coefficient estimate for the independent variable FDIt-1/GDPt-1 is significant at the 10 percent significance level
and even at the 6 percent significance level. According to table 5.2, this time, the p-value is 0.059*. The second independent variable, GDPt-1 remains statistically significant with its
coefficient estimate indicating that as GDPt-1 increases with one dollar, GDPt will increase
by 1.693 dollars, ceteris paribus. The coefficient estimate for FDIt-1/GDPt-1 indicates that a
one dollar increase in FDIt-1/GDPt-1, ceteris parabus, will increase GDPt by 29.792 dollars,
signifying a very positive effect of FDI as a fraction of GDP in 1994-1998 on the level of GDP in the following period, 1999-2003. Therefore, the null hypothesis should be rejected.
5.3
Analysis
When all 30 regions in China are included in the regression model, the results show that we could not reject the null hypothesis that foreign direct investments as a share of GDP dur-ing the years 1994-1998, had no influence on the increase in GDP in the followdur-ing time pe-riod 1999-2003. When including all the regions in China, not only the prosperous ones in the coastal areas, but also the ones with more sluggish growth, this should not be a very surprising result. In fact, some of these regions have almost no inflow of foreign capital. Also, the differences between the regions are enormous. For example, from the descriptive statistics section one can see that Ninqxia’s FDI inflow in both 1998 and 2003 was less than 1 percent of the inflow of FDI in Guangdong. So it is not hard to see why foreign in-vestment has no significant impact on growth in some regions. It is because they have no significant inflow of FDI.
That is why I conducted a second regression model which excludes the regions with ap-proximately no FDI inflow, which are Tibet, Qinghai, Ningxia and Xinjiang. This model shows a significant result for the FDIt-1/GDPt-1 coefficient estimate at the 10 percent
sig-nificance level and even at 6 percent sigsig-nificance. This indicates that the regions with a high level of GDP and also a high growth rate of GDP have a substantial amount of foreign in-vestment coming in, affecting the growth and making it accelerate even more. Further-more, it is not only Shanghai and Guangdong that experience a boom in FDI inflow. Zhei-jiang in the eastern area and Jiangxu in the central area both have percentage increases of more than 200 percent in the five year period 1998-2003. Zheijiang also had one of the highest growth rates among the regions over this time period.
Consequently, on the basis of the second regression model, one can conclude that FDI af-fects GDP in a positive way, as suggested by the theoretical framework. Capital, both physical and human capital that is being transferred to the host country by FDI, conse-quently adds to the GDP of the host country. Naturally, there are several factors that con-tribute to economic growth other than FDI, that are not accounted for in this thesis. But the objective here was to look at the contribution of FDI specifically.
6
Conclusion and suggestions for future research
The purpose of this thesis was to analyse the impact of foreign direct investment on GDP in 30 different regions in China over the time period 1994-2003. Based on the empirical re-sults, it was discovered that FDI has no statistically significant impact on growth in China when including the poorest regions in the western area. The insignificant result is arguably due to the lack of inward FDI in some regions. However, for the majority of the 30 regions that have a larger share of inward FDI, one can conclude that FDI has a positive impact on the level of GDP at the 6 percent significance level.
Although the poor regions in the western areas do not show a significant inflow of foreign capital over the years included in this analysis, it does not mean that they should not be studied with the same interest as the prosperous coastal regions. On the contrary, I find these regions more interesting due to their unexploited resources, both concerning natural resources and human capital. As mentioned previously, FDI is transferring technology and knowledge in the form of human capital and the latter can be difficult to measure. I believe that the coastal areas are already too crowded, competition is too intense and prices sub-stantially higher than in the areas that are yet not so exploited. As stated previously, the at-tempt to attract both domestic and foreign investors into the inland that started in 1997 has in fact increased investor interest in these parts of the country. But it is too early to see the real effect of those attempts at the time of writing this thesis. Obviously, the socioeco-nomic environment in the western parts of China need to improve substantially before for-eign investors will find it profitable to move their businesses there. One should also re-member that it can take some time before investments show any profits.
To conclude, one can say that China’s opening to the world market has benefited the coun-try itself as well as foreign investors. There are still many regulations and laws that restrict investment, but when looking at the speed of adjustment to the world market, China lies way ahead of many of the advanced economies. From being one of the most isolated economies in the world to being the world’s largest recipient of FDI is an incredible achievement. And the story does not end here. The Chinese economy is still booming and attracts ever more investors from abroad. One can only hope that the effects of the con-tinuing growth will be seen in the inland as well.
For further research, I would like to suggest an analysis of how economic growth in China is affected by environmental problems, since pollution and global warming is an important topic in many countries today. In addition, the pollution in China is a major concern to most environmentalists. The environmental problems in China originated from the indus-trialization process, as is the case of any country that experiences such a transformation. This analysis could constitute the country as a whole, or it could involve studying the im-pact in specific regions, but the latter is of course totally dependent on the availability of data. Beyond the global concern, a reason that this subject is worth studying is the fact that many economists fear that the environment is the factor that will cause China’s economic growth to come to a halt in the future.
References
Barro, R. J. (1999) Notes on Growth Accounting. Journal of Economic Growth, Vol. 4, pp. 119-137. Boston, Kluwer Academic Publishers.
Brakman, S., Garretsen, H., and van Marrewijk, C. (2006) An Introduction to Geographical Eco-nomics. Cambridge, Cambridge University Press.
Coe, D. T., Helpman, E., Hoffmaister, A. W. (1997) North-south R&D Spillovers. Eco-nomic Journal, Vol. 107 Issue 440, pp.134-149.
Dornbusch, R., Fischer, S., Startz, R. (2004) Macroeconomics – Ninth Edition. New York, McGraw-Hill Companies Inc.
Economist Intelligence Unit Country Profile: China, Issues 1996 – 2005 Retrieved Febru-ary 15, 2007 from the world wide web:
http://portal.eiu.com.ezproxy.library.uvic.ca/index.asp?layout=displayIssue&publication_i d=140000814
Hon, T-Y., Poon, C-C., Woo, K-Y. (2005) Regional Distribution Of Foreign Direct In-vestment in China. The Chinese Economy, M.E. Sharpe, vol. 38, no.2, March-April 2005, pp. 56-87.
Kelley, L., Luo, Y., (1999), China 2000: Emerging Business Issues. California, Sage Publications Inc.
Krueger, A. O., Takatoshi, I. (2000) The Role of Foreign Direct Investment in East Asian Economic Development. National Bureau of Economic Research – East Asia Seminar on Economics, Vol. 9, Chicago, The University of Chicago Press
Mansfield, E., Romeo, A. (1980). Technology Transfer to Overseas Subsidiaries by U.S. Based Firms. Quarterly Journal of Economics, Vol. 95, Issue 4, pp. 737-750.
Moosa, I. A., (2002), Foreign Direct Investment – Theory, Evidence and Practice. Palgrave, New York. Anthony Rowe Limited.
National Bureau of Statistics China, China Statistical Yearbook (1996) Retrieved March 13, 2007 from the world wide web:
http://www.stats.gov.cn/english/statisticaldata/yearlydata/YB1996e/index1.htm
National Bureau of Statistics China, China Statistical Yearbook (1998) Retrieved March 13, 2007 from the world wide web:
http://www.stats.gov.cn/english/statisticaldata/yearlydata/YB1998e/index1.htm
National Bureau of Statistics China, China Statistical Yearbook (2000) Retrieved March 13, 2007 from the world wide web:
http://www.stats.gov.cn/english/statisticaldata/yearlydata/YB2000e/index1.htm
National Bureau of Statistics China, China Statistical Yearbook (2002) Retrieved March 13, 2007 from the world wide web:
National Bureau of Statistics China, China Statistical Yearbook (2005) Retrieved March 13, 2007 from the world wide web: http://www.stats.gov.cn/tjsj/ndsj/2005/indexeh.htm OECD (1996), OECD Benchmark Definition of Foreign Direct Investment - Third edition. Paris; Organization for Economic Co-operation and Development Retrieved March 3, 2007 from http://www.oecd.org/dataoecd/10/16/2090148.pdf
Reuvid, J., Yong, L. (2005) Doing Business with China – Fifth edition. GMB Publishing Ltd., London.
Smith, S. C., Todaro, M. P. (2006) Economic Development – Ninth edition. Harlow, Pearson Education Ltd.
Appendix I
Regression model 1 Variables Entered/Removed(b) Model Variables Entered Variables Removed Method 1 GDPt1, FDIGDPt1(a ) . Entera All requested variables entered. b Dependent Variable: GDPt Model Summary(b) Model R R Square Adjusted R Square Std. Error of the Estimate 1 ,996(a) ,993 ,992 3,05338 a Predictors: (Constant), GDPt1, FDIGDPt1
b Dependent Variable: GDPt
ANOVA(b)
Model
Sum of
Squares df Mean Square F Sig. Regression 34204,575 2 17102,287 1834,388 ,000(a)
Residual 251,725 27 9,323
1
Total 34456,300 29
a Predictors: (Constant), GDPt1, FDIGDPt1 b Dependent Variable: GDPt
Coefficients(a)
Unstandardized
Coeffi-cients Standardized Coefficients t Sig. Model B Std. Error Beta B Std. Error
(Constant) -1,740 ,965 -1,802 ,083 FDIGDPt1 16,983 11,723 ,025 1,449 ,159 1 GDPt1 1,688 ,029 ,989 57,816 ,000 a Dependent Variable: GDPt Residuals Statistics(a)
Minimum Maximum Mean Std. Deviation N Predicted Value -,0520 129,0851 43,3000 34,34339 30 Residual -10,29982 5,25271 ,00000 2,94621 30 Std. Predicted Value -1,262 2,498 ,000 1,000 30 Std. Residual -3,373 1,720 ,000 ,965 30 a Dependent Variable: GDPt
Regression model 2 Model Summary(b) Model R R Square Adjusted R Square Std. Error of the Estimate 1 ,996(a) ,992 ,991 3,09150 a Predictors: (Constant), GDPt1, FDIGDPt1
b Dependent Variable: GDPt Variables Entered/Removed(b) Model Variables Entered Variables Removed Method 1 GDPt1, FDIGDPt1(a ) . Enter a All requested variables entered.
b Dependent Variable: GDPt
ANOVA(b)
Model Squares Sum of df Mean Square F Sig. Regression 27185,719 2 13592,859 1422,236 ,000(a)
Residual 219,820 23 9,557
1
Total 27405,538 25
a Predictors: (Constant), GDPt1, FDIGDPt1 b Dependent Variable: GDPt
Coefficients(a)
Unstandardized
Coeffi-cients Standardized Coefficients t Sig. Model B Std. Error Beta B Std. Error
(Constant) -2,473 1,160 -2,133 ,044 FDIGDPt1 29,792 15,007 ,040 1,985 ,059 1 GDPt1 1,690 ,035 ,980 48,551 ,000 a Dependent Variable: GDPt Residuals Statistics(a)
Minimum Maximum Mean Std. Deviation N Predicted Value 11,2159 130,4215 49,3077 32,97618 26 Residual -9,78827 5,53812 ,00000 2,96527 26 Std. Predicted Value -1,155 2,460 ,000 1,000 26 Std. Residual -3,166 1,791 ,000 ,959 26 a Dependent Variable: GDPt
FDIGDPt1 0,15 0,10 0,05 0,00 -0,05 GDPt 5,00 0,00 -5,00 -10,00 -15,00
Partial Regression Plot
Dependent Variable: GDPt GDPt1 40,00 20,00 0,00 -20,00 -40,00 GDPt 75,00 50,00 25,00 0,00 -25,00 -50,00
Partial Regression Plot