Research Article
Developing Roadway Safety Models for Winter Weather
Conditions Using a Feature Selection Algorithm
Bryce Hallmark
1and Jing Dong
21HDR, 1917 S 67th Street, Omaha, NE 68106, USA
2Iowa State University, 2711 S Loop Dr, Ames, IA 50010, USA
Correspondence should be addressed to Jing Dong; [email protected]
Received 31 July 2020; Revised 17 November 2020; Accepted 15 December 2020; Published 29 December 2020
Academic Editor: Yajie Zou
Copyright © 2020 Bryce Hallmark and Jing Dong. This is an open access article distributed under the Creative Commons Attribution License, which permits unrestricted use, distribution, and reproduction in any medium, provided the original work is properly cited.
Inclement winter weather such as snow, sleet, and freezing rain significantly impacts roadway safety. To assess the safety implications of winter weather, maintenance operations, and traffic operations, various crash frequency models have been developed. In this study, several datasets, including for weather, snowplow operations, and traffic information, were combined to develop a robust crash frequency model for winter weather conditions. When developing statistical models using such large-scale multivariate datasets, one of the challenges is to determine which explanatory variables should be included in the model. This paper presents a feature selection framework using a machine-learning algorithm known as the Boruta algorithm and exhaustive search to select a list of variables to be included in a negative binomial crash frequency model. This paper’s proposed feature selection framework generates consistent and intuitive results because the feature selection process reduces the complexity of interactions among different variables in the dataset. This enables our crash frequency model to better help agencies identify effective ways to improve roadway safety via winter maintenance operations. For example, increased plowing operations before the start of storms are associated with a decrease in crash rates. Thus, pretreatment operations can play a significant role in mitigating the impact of winter storms.
1. Introduction
Inclement winter weather such as snow, sleet, and freezing rain significantly impacts roadway safety. Every year, over 118,000 people in the United States are injured or killed due to winter-weather-related vehicle crashes [1]. Crash fre-quency models using Bayesian or negative binomial mod-eling [2–4] have been developed to investigate the safety implications of winter weather, maintenance operations, and traffic operations. However, due to inherent correlations among explanatory variables, conflicting results have been reported. For example, Qin et al. [5] used Wisconsin snowstorm and maintenance operation reports to develop a crash frequency model. Their estimated negative binomial model indicated that deploying more deicing material re-duces the number of crashes, while deploying more salting material increases crash rates. This finding exemplifies the
complexity and difficulty of using multiple data sources when analyzing winter maintenance operations.
In this paper, winter weather crashes are aggregated by storm and city in order to model the impact of winter weather and maintenance operations on the expected crash rate for a particular winter event. A feature selection technique, called the Boruta algorithm [6, 7], is used to select the most impactful among highly correlated explanatory variables from a comprehensive dataset containing weather, maintenance operations, and traffic information.
As agencies continue to move towards data-driven de-cision-making, innovative data analytics are valuable for working with large datasets. In particular, when developing statistical models using large-scale multivariate datasets, one of the challenges is to determine which explanatory variables to include in the model. In this study, several datasets are combined to examine the occurrence of winter-weather-Volume 2020, Article ID 8824943, 13 pages
related crashes, including weather (e.g., type, rate and du-ration of precipitation, temperature, and visibility), snow-plow operations (e.g., snow-plow frequency and material spreading rate), and traffic information (e.g., traffic volume). Some variables in these datasets are inherently correlated. For example, snowplow operations usually depend on the severity of winter storms and type of precipitation.
This paper proposes a framework for identifying which of highly correlated explanatory variables should be selected to develop a robust winter-weather-related crash frequency model. In particular, it adopts the Boruta algorithm to calculate the importance of each variable using a random forest wrapper. Based on relative importance scores, a set of variables is selected to be included in the negative binomial model. This feature selection process helps to create a robust crash frequency model for winter-weather-related crashes.
2. Literature Review
Past studies have shown that winter storm events generally increase the crash rate while winter maintenance operations tend to reduce the crash rate. Nixon and Qiu conducted a meta-analysis of studies that quantified the impact of weather on traffic crashes and found that the crash rate increases by 84% and the injury rate increases by 75% with snow conditions. Nixon and Qiu [8], on the other hand, showed an average reduction of 78% in crash rate on freeways and 87% on two-lane undivided highways due to salting. Earlier studies like these are usually based on hourly traffic count and weather data, as well as manually main-tained winter storm records.
However, with the wide adoption of sensing, GPS tracking, and communication technologies in recent years, state agencies are now collecting more detailed and granular data. For example, today most state departments of trans-portation (DOTs) collect traffic volume and speed data using in-pavement or roadside sensors at 20-second to 5-minute aggregation intervals. Many agencies have also deployed cameras, sensors, and GPS tracking devices on snowplow trucks to collect location and operational data at subminute intervals [9, 10]. With these new data sources, researchers are again attempting to assess the effect of winter mainte-nance operations on mobility and safety in order to provide guidance for more effective maintenance operations [11–13]. As researchers begin to face larger and more complex datasets, the ability to identify meaningful relationships from such datasets becomes more important. Machine learning has been commonly applied in the transportation field when attempting to model and predict crashes, but usually with only minimal variable filtering [14–16]. While machine learning for feature selection has been done in other fields, its use in the transportation sector is nearly nonexistent. Feature selection, however, has been used with success when analyzing variables in evacuation behavior modeling and in determining gully erosion factors [17, 18]. In particular, the Boruta algorithm has been shown as an effective method for feature selection. For example, Prasad et al. [19] used the Boruta feature selection algorithm to provide a trimmed list for their extreme learning machine
(ELM) model to study weekly soil moisture. Similarly, to select optimal random forest predictive models for seabed hardness, Li et al. [20] compared five feature selection methods and recommended the averaged variable impor-tance and Boruta algorithms as producing the most accurate predictive models. Various other studies have also found the Boruta method to produce accurate and stable results [6, 7, 21]. Based on the success of such past applications, this paper adopts the Boruta feature selection algorithm to select variables in a winter-weather-related crash frequency model.
3. Data Description
This paper analyzes winter weather events in eight major cities across Iowa. Geographic-based analysis is a commonly used method for aggregating winter weather data [2, 22]. For each city, a list of winter storm events was compiled. All relevant data were then associated with each storm based on the location and time stamp, as shown in Figure 1.
The scope of this study encompassed two winter seasons from November 2016 to May 2017 and from November 2017 to May 2018.
The Iowa DOT operates and maintains all of the In-terstates, US highways, and state highways across Iowa. Only data pertaining to these Iowa DOT maintenance routes were analyzed for this study. A list of compiled variables from across the study’s data sources can be seen in Table 1.
3.1. Roadway Data. The Iowa DOT maintains and provides roadway information via the Roadway Asset Management System (RAMS). The RAMS provides the geometric and operational features of the roadway such as the number of lanes, roadway surface type, and speed limit. In conjunction with the RAMS database, the Iowa DOT provides a Linear Reference System (LRS). An LRS is a mile reference system for each unique route. By selecting any location along the Iowa DOT maintenance routes; therefore, users can link their selected location’s LRS mile marker reference to the RAMS database. Additionally, the LRS provides a means to combine any other data that can be linked to the roadway system, such as crashes and snowplow locations.
Each city contains some Iowa DOT maintenance roadways. Therefore, the current study’s road miles variable is the length of the Iowa DOT roadway network within each city’s boundary (Table 2). The lane miles variable accounts for each Iowa DOT roadway’s number of lanes, thus pro-viding an indicator of the scale of the Iowa DOT’s roadway surface area in each city.
3.2. Traffic Data. The Iowa DOT has over 900 Wavetronix sensors placed throughout the state. These sensors collect traffic speed, occupancy, and volume data that are archived at 5-minute aggregation intervals. Most of these sensors are located in urban areas. Using Wavetronix sensor data in lieu of annual average daily traffic (AADT) provides more ac-curate traffic counts as roadway volumes can vary greatly during winter storm events [23].
Storm start Storm stop
Time Crashes
Maintenance operations
Figure1: Associating multiple data sources related to a winter storm.
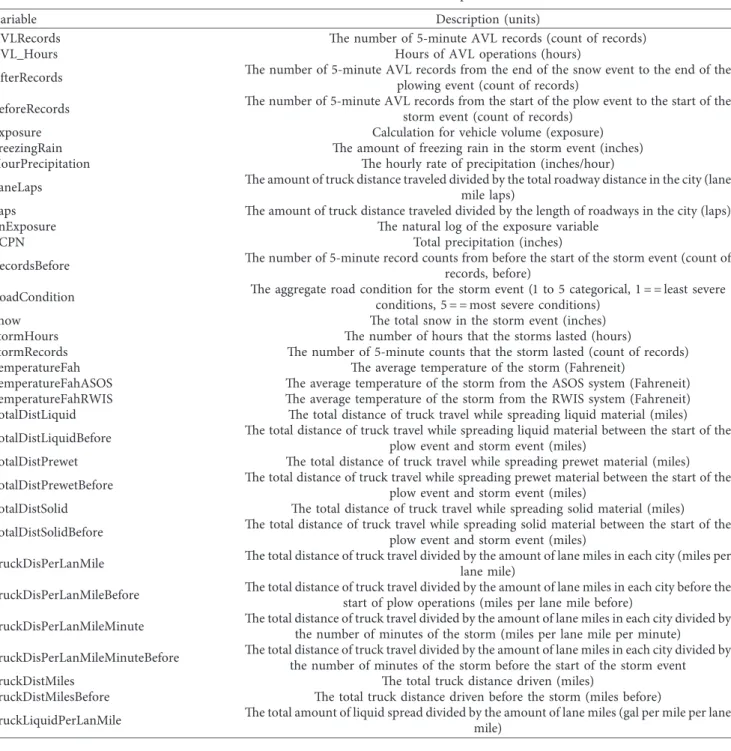
Table1: Combined dataset variable descriptions.
Variable Description (units)
AVLRecords The number of 5-minute AVL records (count of records)
AVL_Hours Hours of AVL operations (hours)
AfterRecords The number of 5-minute AVL records from the end of the snow event to the end of the plowing event (count of records)
BeforeRecords The number of 5-minute AVL records from the start of the plow event to the start of the storm event (count of records)
Exposure Calculation for vehicle volume (exposure) FreezingRain The amount of freezing rain in the storm event (inches) HourPrecipitation The hourly rate of precipitation (inches/hour)
LaneLaps The amount of truck distance traveled divided by the total roadway distance in the city (lanemile laps) Laps The amount of truck distance traveled divided by the length of roadways in the city (laps) LnExposure The natural log of the exposure variable
PCPN Total precipitation (inches)
RecordsBefore The number of 5-minute record counts from before the start of the storm event (count of records, before)
RoadCondition The aggregate road condition for the storm event (1 to 5 categorical, 1conditions, 5� �most severe conditions) � �least severe
Snow The total snow in the storm event (inches)
StormHours The number of hours that the storms lasted (hours)
StormRecords The number of 5-minute counts that the storm lasted (count of records) TemperatureFah The average temperature of the storm (Fahreneit)
TemperatureFahASOS The average temperature of the storm from the ASOS system (Fahreneit) TemperatureFahRWIS The average temperature of the storm from the RWIS system (Fahreneit) TotalDistLiquid The total distance of truck travel while spreading liquid material (miles) TotalDistLiquidBefore The total distance of truck travel while spreading liquid material between the start of the
plow event and storm event (miles)
TotalDistPrewet The total distance of truck travel while spreading prewet material (miles) TotalDistPrewetBefore The total distance of truck travel while spreading prewet material between the start of the
plow event and storm event (miles)
TotalDistSolid The total distance of truck travel while spreading solid material (miles) TotalDistSolidBefore The total distance of truck travel while spreading solid material between the start of the
plow event and storm event (miles)
TruckDisPerLanMile The total distance of truck travel divided by the amount of lane miles in each city (miles per lane mile)
TruckDisPerLanMileBefore The total distance of truck travel divided by the amount of lane miles in each city before thestart of plow operations (miles per lane mile before) TruckDisPerLanMileMinute The total distance of truck travel divided by the amount of lane miles in each city divided by
the number of minutes of the storm (miles per lane mile per minute) TruckDisPerLanMileMinuteBefore The total distance of truck travel divided by the amount of lane miles in each city divided by
the number of minutes of the storm before the start of the storm event TruckDistMiles The total truck distance driven (miles)
TruckDistMilesBefore The total truck distance driven before the storm (miles before)
TruckLiquidPerLanMile The total amount of liquid spread divided by the amount of lane miles (gal per mile per lane mile)
Table1: Continued.
Variable Description (units)
TruckLiquidPerLanMileBefore The total amount of liquid spread divided by the amount of lane miles before the stormevent (gal per lane mile before) TruckLiquidPerLanMileMinute The total amount of liquid spread divided by the amount of lane miles divided by the total
minutes of the storm (gal per lane mile per minute)
TruckLiquidPerLanMileMinuteBefore The total amount of liquid spread divided by the amount of lane miles divided by the total minutes of the storm before (gal per lane mile per minute before)
TruckMaterialLiquid The total amount of liquid spread (gal)
TruckMaterialLiquid.Distance The total amount of liquid spread divided by the distance traveled (gal/mile) TruckMaterialLiquid.DistanceBefore The total amount of liquid spread divided by the distance traveled before the storm event
(gal/mile)
TruckMaterialLiquidBefore The total amount of liquid spread before the storm (gal before)
TruckMaterialLiquidDistance.Distance The total amount of liquid material spread divided by the distance traveled only while spreading occurred (gal/mile, of spreading miles traveled only)
TruckMaterialLiquidDistance.DistanceBefore The total amount of liquid material spread divided by the distance traveled only whilespreading occurred before (gal/mile, of spreading miles before traveled only) TruckMaterialPreLiquid The total amount of preliquid spread (gal)
TruckMaterialPreLiquid.Distance The total amount of preliquid spread divided by the distance traveled (gal/mile) TruckMaterialPreLiquid.DistanceBefore The total amount of preliquid spread divided by the distance traveled before (gal/mile
before)
TruckMaterialSolid The total amount of material solid spread (lbs)
TruckMaterialSolid.Distance The total amount of solid material spread divided by the total truck distance traveled (lbs/ mile)
TruckMaterialSolid.DistanceBefore The total amount of solid material spread divided by the total truck distance traveled before (lbs/mile, before)
TruckMaterialSolidBefore The total amount of solid material spread before the storm (lbs, before) TruckMaterialSolidDistance.Distance The total amount of solid material spread divided by the truck distance that was traveled
only while spreading occurred (lbs/mile, of mile traveled while spreading) TruckMaterialSolidDistance.DistanceBefore
The total amount of solid material spread divided by the truck distance that was traveled only while spreading occurred before the storm (lbs/mile, of mile traveled while spreading,
before)
TruckPreLiquidPerLanMile The total amount of preliquid material spread divided by the length of lane miles (gal/lane mile)
TruckPreLiquidPerLanMileMinute The total amount of preliquid material spread divided by the length of lane miles divided bythe total minutes of the storm (gal/lane mile per minute) TruckSolidPerLanMile The total amount of solid material spread divided by the length of lane miles (lbs/lane mile) TruckSolidPerLanMileBefore The total amount of solid material spread divided by the length of lane miles before the
storm (lbs/lane mile, before)
TruckSolidPerLanMileMinute The total amount of solid material spread divided by the length of lane miles divided by the total minutes of the storm (lbs/lane mile per minute)
TruckSolidPerLanMileMinuteBefore The total amount of solid material spread divided by the length of lane miles divided by thetotal minutes of the prestorm plow operations (lbs/lane mile per minute, before)
Visibility The total visibility (miles)
WindGust The max wind recorded (mph)
WindSpeed The average wind speed (mph)
WindSpeedKnots The average wind speed (knots)
WindSpeedKnotsASOS The average wind speed obtained by the ASOS system (knots) WindSpeedKnotsRWIS The average wind speed obtained by the RWIS system (knots)
WorstFreezingRain The worst intensity of freezing rain (score of 1–3 categorical variables, 1� �least severe, 3� �most severe)
WorstRoadCondition The worst road condition (1 to 5 categorical variables, 1� �least severe conditions, 5� �most severe conditions)
WorstSnow The worst snow intensity recorded (score of 1–3 categorical variables, 1� �least severe, 3� �most severe)
WorstVisibility The lowest visibility recorded (miles)
City The city location of the storm event (Ames, Des Moines, Council Bluffs, Sioux City, Waterloo, Iowa City, Quad cities, Cedar Falls)
The average vehicle count (AVC) represents the average count of vehicles present at each Wavetronix sensor. AVC is calculated as follows:
AVC�(vehicle counts for all sensors)÷number of sensors ÷number of 5−minute intervals of the storm.
(1) In essence, a city’s total count of traffic volume is divided by its number of sensors (see Table 3) and then divided by the number of 5-minute intervals throughout the duration of a storm. Because the sensor data are aggregated over just 5 minutes, this essentially provides the expected count of vehicles at each portion of the roadway for the entirety of the storm.
The resulting average traffic volume based on Wave-tronix sensor counts and the road miles variable together provide an “exposure” count:
Exposure�AVC∗Road Miles. (2)
3.3. Automatic Vehicle Location (AVL) Data. The Iowa DOT has over 900 snowplow trucks spread throughout 101 ga-rages. Each snowplow’s automatic vehicle location (AVL) system records the date and time, longitude and latitude, traveling speed, plow position (up vs. down), and material spreading rates at approximately a 10-second refresh rate. Three types of spreading rates are recorded, namely, solid rate, prewet rate, and liquid rate. Four types of plow wing records are available, namely, front plow, left wing, right wing, and underbelly plow.
A snowplow’s capacity is 12,000 lbs for single-axle trucks and 24,000 lbs for tandem-axle trucks. Its spreading rate is approximately 200 lbs per lane mile for solid material and 60 gallons per lane mile for liquids. Its travel speed when plowing and spreading material is about 30 miles per hour. Its deadheading speed can be as high as the speed limit.
Earlier works have used ratios such as the total material spread normalized per precipitation event to examine the safety implications of snowplow operations [11]. As past works have had difficulties in showing conclusive results, we created an extensive list of ratios as candidate predictors for the impact of maintenance operations on crash rates. Ad-ditionally, our snowplow variables needed to be normalized per geographic region to facilitate appropriate comparison.
This was done by dividing the material spread by the roadway surface area (i.e., lane miles). Again, Table 1 contains our full list of variables.
3.4. Weather Data. This study’s weather data were obtained from the Iowa Environmental Mesonet system, which provides highly granular weather data across Iowa. This Multiradar/Multisensor (MRMS) project combines infor-mation from many sources and radar systems to provide precise weather information for 1-by-1-mile grid areas. The weather variables for each grid area include air temperature, wind speed, hourly and minute-based precipitation, daily snowfall, precipitation type, and so forth. Additionally, we rated the intensity of the precipitation and weather on a scale of 0 to 3, with 3 being the worst. When analyzing the data for winter storm events, such ratings are used to determine the intensity of a given storm.
4. Crash Data
This study’s crash data were obtained from the Iowa DOT crash database. The crash data include information such as the location, time, crash severity, direction of travel, lighting conditions, and weather conditions that potentially con-tributed to the crash. In particular, the following data fields describe what weather conditions may have contributed to each crash as well as what the road surface conditions were like at the time of the crash:
(i) Environmental contributing circumstances (ii) Weather1 (dominant weather condition) (iii) Weather2 (secondary weather condition) (iv) Surface conditions
Since this study focuses on winter weather crashes, a filter was used requiring a winter weather condition present for any of the four weather-related data fields for a crash to be considered as a winter weather crash. After filtering based on weather conditions, there were 5,089 winter-weather-related crashes along the Iowa DOT maintenance routes from 2016 to 2018. When counting only crashes that oc-curred within this study’s geographic analysis regions and that could be linked to the LRS mile reference system, only 1,372 crashes remained.
Table2: Roadway miles breakdown by city.
City Road miles Lane miles
Ames 142 285 Cedar Rapids 199 439 Council Bluffs 153 359 Des Moines 624 1380 Iowa City 227 563 Sioux City 218 517 Davenport 279 597 Waterloo 232 482
Table3: Number of Wavetronix sensors in each city.
City Number of Wavetronix sensors
Ames 82 Cedar Rapids 163 Council Bluffs 151 Des Moines 289 Iowa City 78 Sioux City 92 Davenport 46 Waterloo 61
5. Methodology
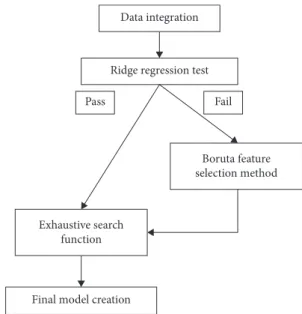
Different from previous safety analyses, this paper presents a model development process based on the feature selection method. Figure 2 summarizes this process. First, data from multiple sources are combined into a single dataset. Next, a ridge regression test is performed to determine the suit-ability of the data for analysis. If the test fails, the Boruta feature selection method is applied to trim the dataset before retesting. Once the data are determined to be suitable, an exhaustive search function is performed to produce a final trimmed list of explanatory variables. At this stage, the user can select the policy relevant variables to be included in the final model.
5.1. Data Integration. As the first step in our methodological framework, data from different sources are integrated based on the spatial and temporal information associated with each record. In particular, a geofence was created for each city to filter its weather, snowplow, crash, and traffic data. Then, the weather data were analyzed to identify a list of winter storm events for each city. In particular, any time period below 41 degrees with precipitation that lasted longer than 30 minutes was considered a winter storm event. Based on this geofence and storm event timing, relevant snowplow and crash data were extracted.
For each winter storm event, the snowplow data were separated into three time periods, that is, before, during, or after the storm. Making this distinction is important be-cause many agencies, including the Iowa DOT, deploy operations before the start of a storm, and many are unable to properly clear their roadways within the timeframe of storms. Using our geofence, therefore, a list of snowplows in operation during each storm was created. For each snowplow, its continuous hours of operation were com-piled. A continuous operation was defined as a snowplow in operation with a time gap of no more than 2 hours. Each snowplow’s start- and end-of-continuous-operation timestamps were then used to distinguish its before-storm, during-storm, and after-storm plow data. Each storm event’s before-storm aggregation thus constituted the time from the beginning of any of its snowplow operations to the start of the storm. Its during-storm aggregation was from the start to the end of the winter storm. Its after-storm aggregation was from the end of the storm to the end of all plow operations.
5.2. Ridge Regression Test. Ridge regression cross-validation is employed to determine dataset suitability for analyses such as exhaustive search. Ridge regression tunes the parameters of a model to minimize the ordinary least squares [24]. It outputs an expected coefficient for each variable via differing model tuning or lambda penalizations. Lambda penaliza-tions tend to tune variables to a model coefficient value of 0. When lambda has been maximized, all possible variables will produce a coefficient of 0. That is, varying lambda between 0 and 1 will produce a model that removes only a portion of the input variables. By imposing lambda penalizations, ridge
regression can provide a best-case tradeoff between bias (i.e., training set accuracy) and predictive variance (i.e., testing set accuracy). Ridge regression successively penalizes different variables’ coefficients down to zero using lambda and compares the performance of its resulting model variants. This process effectively removes unimportant variables from a model as it helps identify the important variables in the dataset as well as the expected model outputs. Tracking expected model outputs as model complexity changes can provide insight into how data interact.
Normally, all variables in a dataset are presented in one ridge regression plot. However, to better show how the variables in our dataset interact, we split our many variables into groups based on their deviance away from lambda and plotted them accordingly in six subfigures (Figure 3). Each curve represents a variable from the dataset. They-axis is the expected coefficient of each respective variable. Moving from left to right along the x-axis, the model becomes more complex as more variables move away from 0.
As more variables interact, it is expected that their es-timated coefficients will vary. Most variables maintain a coefficient either above or below the x-axis, indicating a positive or negative relationship, respectively. Some vari-ables, however, experience drastic and highly erratic be-havior where they start with a positive coefficient and then drop to a negative coefficient as the model becomes more complex or vice versa. For example, the variable “Road-Condition” has a positive coefficient that increases as more variables are added. This is an acceptable change in an es-timated coefficient. On the other hand, the variable “TruckDisPerLanMileMinute” is the total distance of snowplow trucks travel divided by the total lane miles in a given city divided by the number of minutes of a given storm. On the left-hand side, where the model is the least complex, the variable has a positive coefficient. As the model becomes more complex as more variables are added, this coefficient changes from positive to negative. In other words, depending on what other variables are included in the
Data integration
Ridge regression test
Pass Fail
Boruta feature selection method
Exhaustive search function
Final model creation
0 –300 –600 –900 Es tim at e 0 2000 4000 6000 Lambda (Intercept) FreezingRain HourPrecipitation TruckDisPerLanMileMinute TruckDisPerLanMileMinuteBefore TruckLiquidPerLanMileMinute TruckPerLiquidPerLanMileMinute TruckLiquidPerLanMileMinuteBefore (a) Es tim at e 0.5 0.0 –0.5 0 2000 4000 6000 Lambda AfterRecords AVL.Hours AVL_Hours AVLRecords BeforeRecords Exposure LaneLaps Laps LnExposure PCPN (b) Es tim at e 4 3 2 1 0 0 2000 4000 6000 Lambda RecordsBefore RoadCondition Snow StormHours StormRecords TemperatureF ah TemperatureF ahASOS TemperatureF ahRWIS TotalDistLiquid TotalDistLiquidBefore (c) Es tim at e 0 2000 4000 6000 Lambda 0 –1 –2 TotalDistPrewet TotalDistPrewetBefore TotalDistSolid TotalDistSolidBefore TruckDisPerLanMile TruckDisPerLanMileBefore TruckDistMiles TruckDistMilesBefore TruckLiquidPerLanMile TruckLiquidPerLanMileBefore (d) Figure3: Continued.
model, the coefficient of this variable can be positive or negative. This explains why inconsistent results have been observed when analyzing similar datasets in the past. In the ridge regression test, however, having variables that cross over thex-axis constitutes a failure indicating that feature selection is required.
5.3. Boruta Feature Selection. If the ridge regression test fails, the Boruta feature selection method is applied to trim the dataset. The Boruta method creates an importance score for each variable [6, 7]. In particular, a random forest wrapper classification is employed on the variables. In the process, the variables are shuffled, while random shadow variables are created. The shadow variables are meant to identify inef-fective input variables. To do so, each variable, as well as the random shadow variables, is assigned a relative importance score. Any variable that scores worse than the worst shadow variable will prove to be ineffective while variables that score higher than the highest shadow variable will be highly ef-fective variables. These final importance scores are then used to create a set of noncorrelated data points.
The Boruta algorithm enables the development of a hierarchal list of variables ranked in terms of importance. These importance values can then be used to select which
explanatory variables should be included in statistical models. For better visualization, we split our variables into two groups, namely, the AVL variables shown in Figure 4 (and whose ranked IDs are matched in Table 4 to the re-spective variables they represent), and the traffic and weather variables, as shown in Figure 5. Figure 4 displays all the AVL variables with their respective ID numbers with variable 1 on the right moving in descending order to the left to variable 46 on the left.
The blue star variables represent the random shadow variables. Any variable that has a higher importance score resides to the right of these shadow variables and is colored green or yellow. Any variables between the two blue boxes are of negligible importance and are either red or yellow.
When creating statistical models, only one variable from a group of highly correlated variables should be included. Because large datasets are likely to contain many groups of highly correlated variables, manual feature selection is usually inefficient. The Boruta importance scores allow the highest-ranking variable from each correlated group to be selected, in order to create a trimmed list of noncorrelated variables. For example, in Figure 4, the highest-ranking variable was “AVLRecords.” Any variable in the AVL grouping that contained a high correlation with the “AVLRecords” variable (i.e., above 0.70) was therefore
Es tim at e 0 2000 4000 6000 Lambda 0.0 –0.1 –0.2 –0.3 TruckMaterialLiquid TruckMaterialLiquidDistance TruckMaterialLiquidDistanceBefore TruckMaterialLiquidBefore TruckMaterialLiquidDistance.Distance TruckMaterialLiquidDistance.DistanceBefore TruckMaterialPreLiquid TruckMaterialPreLiquidDistance TruckMaterialPreLiquidDistanceBefore TruckMaterialSolid (e) Es tim at e 0 2000 4000 6000 Lambda 2 1 0 –1 –2 –3 TruckPreLiquidDistancePreLanMile TruckSolidPreLanMile TruckSolidPreLanMileBefore TruckSolidPreLanMileMinute TruckSolidPreLanMileMinuteBefore TruckMaterialSolid.Distance TruckMaterialSolid.DistanceBefore TruckMaterialSolidDistance.Distance TruckMaterialSolidDistance.DistanceBefore TruckMaterialSolidBefore (f )
dropped from further consideration. The next variable was then considered until all highly correlated variables had been dropped. The resulting remaining list of variables was neither correlated nor displayed conflicting results from the ridge regression test. That is, as shown in Figure 6, none of these remaining variables display the erratic or unpredicted behavior as seen in Figure 3. Thus, our trimmed dataset listed in Table 5 is appropriate for estimating a negative binomial model. In other words, no matter which set of variables from the trimmed dataset are included in the final model, the results will be robust.
6. Exhaustive Search Function
To determine which of these trimmed variables should be included in our negative binomial model, an exhaustive search function was performed. The exhaustive search function calculates the expected outcome of each model
1 2 3 4 5 6 7 8 9 10 11 12 13 14 15 16 17 18 19 20 21 22 23 24 25 26 27 28 29 30 31 32 33 34 35 36 37 38 39 40 41 42 43 44 45 46
Figure4: The importance scores of AVL variables.
Table4: Boruta ranking of AVl variables.
ID Variable 1 AvlRecords 2 Solid_PLM_Minute 3 Solid.Distance 4 DistMiles 5 Solid_PLM_ 6 Solid 7 TotalDistSolid 8 SolidDistance.Distance 9 Dis_PLM_Minute 10 Solid_PLM_MinuteBefore 11 Laps 12 AfterRecords 13 Dis_PLM_ 14 LaneLaps 15 BeforeRecords 16 RecordsBefore 17 PreLiquid_PLM_MinuteBefore 18 Liquid_PLM_Minute 19 Dis_PLM_MinuteBefore 20 PreLiquid_PLM_ 21 Liquid_PLM_ 22 DistMilesBefore 23 LiquidDistance.Distance 24 TotalDistLiquid 25 Solid.DistanceBefore 26 Liquid 27 Shadow Max 28 PreLiquid.Distance 29 TotalDistPrewet 30 Solid_PLM_Before 31 SolidBefore 32 Liquid.Distance 33 TotalDistSolidBefore 34 TotalDistPrewetBefore Table4: Continued. ID Variable 35 SolidDistance.DistanceBefore 36 Dis_PLM_Before 37 TotalDistSolidBefore 38 PreLiquid 39 LiquidBefore 40 Liquid_PLM_MinuteBefore 41 Liquid.DistanceBefore 42 PreLiquid.DistanceBefore 43 Liquid.DistanceBefore 44 Shadow Mean 45 LiquidDistance.DistanceBefore 46 Shadow Min
based on the input variables and ranks it according to “R-squared” score or another specified criterion. For this analysis, our trimmed list of variables was used as the input for the exhaustive search function.
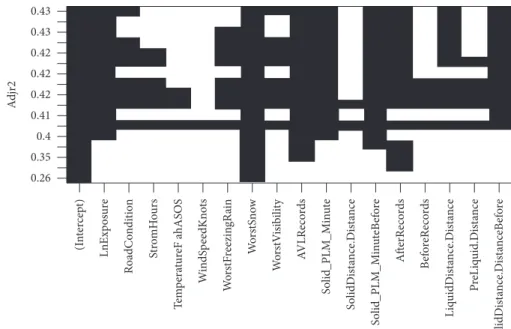
The highest criteria scores, that is, the highest adjusted R-squared scores, are reported in Figure 7. The maximum score is represented at the top of the Figure 7 graph along the y-axis. Thex-axis resides the final set of variables selected from the trimmed dataset, or the variables displayed in Table 5. Each row represents a unique model’s combination of variable inputs, with the solid black cells indicating which variables are included for that specific model. When using the “regsubsets” package, as was used here, the default setting is that only the highest-ranking model for each varying number of input variables is displayed. For example, only 1 model with all 17 variables is displayed, along with only 1 model with 16 variables, and so on. This method shows how model accuracy changes as the input variables themselves change.
It can be seen in Figure 7 that the adjustedR-squared values of the top 7 rows are within 0.03 of each other. In other words, although the variables included in these models may differ, any of the top 7 rows of variables will provide accurate, reliable, and consistent results. This accords with the results from Figure 6 where none of these variables experienced a large swing in its coefficient based on com-plexity. Having multiple reliable model options allows re-searchers to include in their final model whichever set of variables are most policy relevant. Because this method only displays the highest scoring model for each number of variable inputs, there are many existing combinations of variables that will score approximately in the 0.4 range. 6.1. Final Model Creation. Once our final selection of var-iables had been made, a negative binomial model was used to 25 20 15 10 5 0 Imp o rt an ce Sh ado wM in Sh ado wM ax Ci tyI n dex T em p era tur eF ah T em p era tu reF ahR WIS T em p era tur eF ahASOS Wo rs tS n o w W o rs tRoadC o n di tio n W o rs tF re ezin gR ai n R o ad C on d it ion CrashC o un t Sno w V isib ili ty H o u rP re cipit at ion F reesin gR ai n Sh ado wM ea n Wi n d G u st W in d Sp eed W indS p ee dKno tsASOS W indS p ee dKno tsR WIS W in d Sp eedK n o ts W indV isib ili ty M iles L aneM iles PCPN Ci ty .f Ci ty St or m R ec ord s St or m H ou rs Expos u re
Figure5: The importance scores of weather and traffic variables.
10 20 30 40 0 Lambda –15 –5 5 15 C oef ficien ts 10 7 1 88 6 12
Figure6: Ridge regression of trimmed variables.
Table5: List of the trimmed variables.
ID Variable 1 (Intercept) 2 LnExposure 3 RoadCondition 4 StormHours 5 TemperatureFahASOS 6 WindSpeedKnots 7 WorstFreezingRain 8 WorstSnow 9 WorstVisibility 10 AVLRecords 11 Solid_PLM_Minute 12 SolidDistance.Distance 13 Solid_PLM_MinuteBefore 14 AfterRecords 15 BeforeRecords 16 LiquidDistance.Distance 17 PreLiquid.Distance 18 SolidDistance.DistanceBefore
estimate crash frequency [25, 26]. The negative binomial model is written as in equation (1) using a fixed over-dispersion parameter [27]:
Yi ∼ NB μi,α, (3) where Yi is the number of crashes during a winter storm event i,(i� 1, . . ., n), μi stands for the mean crash fre-quency, and αis the overdispersion parameter.
It is assumed thatμiis a function of explanatory variables such that
μi�exp β0+β1xi1 +β2xi2+ · · · + βkxik +βik+1Ln Average Exposurei ,
(4)
where xij represents the jth variable in event i.
β0,β1, . . ., βk+1 is a vector of regression parameters. As
mentioned earlier, since the number of crashes is count data, to make it comparable across different events, the Ln(Exposurei)variable was devised as the offset variable in our negative binomial model.
7. Results and Discussion
Our final negative binomial model, presented in Table 6, includes variables from the top row of Figure 7. The “Pr (>|t|)” column provides a visual indicator of each variable’s significance (i.e., “P value” below 0.05). Noted that “Liq-uidDistance.Distance” and “SolidDistance.DistanceBefore” variables were dropped in the final model. As seen from the R-squared score, no significant difference in performance was observed. Because of the selection process and valida-tion, such adjustments based on researchers’ judgement will not impact model integrity as seen in Table 5 and Figure 6. As expected, with “LnExposure” (i.e., vehicle count) and “Worst Snow,” the higher the number, meaning more traffic
or worse weather, the higher the expected crash frequency. The “AVLRecords” and “AfterRecords” variables signify that the more time snowplows are operating during and after a storm event, the higher the crash rate. This is probably because storms only mildly impacting roadway conditions do not require as much plowing effort as storms that severely impact roadway conditions. Note that the “RoadCondition” variable is not significant in the estimated model. This is because the limited number of Road Weather Information System (RWIS) sensors across the study area resulting in inadequate measurements of road weather conditions. Therefore, frequent snowplow operations can be considered as indicative of rapid degradation of roadway conditions.
The “Solid_PLM_Minute” variable represents the total amount of solid material spread divided by the total lane miles per minute of the storm event, i.e., how much material was spread on the roadway surface every minute during the storm. This variable has a positive coefficient, indicating that
S o lid_PLM_M in u teB ef o re S o lidDist an ce .Dist an ceB ef o re P reL iq uid .Dist an ce S o lid_PLM_M in u te S o lidDist an ce .Dist an ce L iq u idDist an ce .Dist an ce W indS p ee dKno ts T em p era tur eF ahASOS W o rs tF re ezin gR ai n B efore R ec ord s AfterR ec o rds A VLReco rds Wo rs tS n o w Wo rs tV is ib il it y R o ad C on d it ion St rom H ou rs Ln Ex po su re (I n ter cep t) 0.26 0.35 0.4 0.41 0.42 0.42 0.42 0.43 0.43 A d jr2
Figure7: AdjustedR2exhaustive search output.
Table6: Crash frequency model.
Coefficients Estimate Std. Error P value Pr (>|t|) (Intercept) −17.58 4.36 −4.03 0.00 ∗∗∗ LnExposure 1.42 0.60 2.35 0.02 ∗ RoadCondition 0.59 0.68 0.87 0.39 WorstSnow 5.38 1.33 4.05 0.00 ∗∗∗ WorstVisibility 0.21 0.15 1.36 0.18 AVLRecords 0.04 0.01 4.85 0.00 ∗∗∗ Solid_PLM_Minute 21.87 9.07 2.41 0.02 ∗ Solid_PLM_MinuteBefore −11.90 3.81 −3.12 0.00 ∗∗ AfterRecords 0.03 0.01 1.96 0.05 · R-squared 0.4359 F-statistic 18.35 on 8 and 190 DF Significance codes: 0 “∗∗∗”; 0.001 “∗∗”; 0.01 “∗”; 0.05 “·”.
the more solid material spread per lane mile per minute during snow events leads to a higher crash rate. This variable essentially represents the intensity of material spreading during a storm. In ideal conditions, agencies could plan for storm events and have the roadways treated with deicing material before the start of storms to limit degradation in roadway conditions. However, when storms are more severe, or they are flash storms that appear before proper pre-treatment operations can take place, agencies might have to spread more materials during the storm, leading to a higher rate of spreading once the storm has begun. This may explain why a higher spreading rate per minute is associated with a higher crash rate.
The final variable, “Solid_PLM_MinuteBefore” repre-sents the solid material spread per lane mile per minute before the storm starts. This variable has a negative coeffi-cient, meaning that the more solid material spread before the start of the storm, the lower the crash rate. This suggests that proper planning can inhibit the degradation of conditions on the roadway. In turn, this will lower the amount of material needed during the storm event. In addition, past research has shown that a higher proportion of crashes occur at the beginning of a storm event [5]. Therefore, by miti-gating the adverse conditions at the beginning of the storm event, a greater impact on the crash rate reduction can be achieved.
8. Conclusion
When working with large datasets including variables with complex interactions, agencies and researchers must find ways to perform effective analysis while also being able to present the results in a way that can be easily understood. This paper presents a framework for selecting variables from a complex and highly correlated dataset to develop a sta-tistical model describing crash frequency in winter weather conditions. In particular, a machine-learning algorithm, known as the Boruta algorithm and exhaustive search are used to select a list of variables to be included in the final negative binomial crash frequency model. This method provides consistent and intuitive results because the process reduces the complexity of interactions amongst different variables in the dataset.
By following this process, the current paper developed a crash frequency model for winter-weather-related crashes. This model can help agencies identify effective ways to improve roadway safety via winter maintenance operations. For example, by increasing the plowing operations before the start of storms, a decrease in crash rates is observed. Previous works have shown that the beginning of a winter storm carries the highest proportion of crash events com-pared to any other point during the event [5, 13]. Thus, pretreatment operations could have a significant role in mitigating the impact of winter storms.
Data Availability
The data used in this research are available through Iowa DOT Open Data https://data.iowadot.gov/.
Conflicts of Interest
The authors declare that there are no conflicts of interest regarding the publication of this paper.
Acknowledgments
This research was funded by the Traffic Safety Improvement Program (TSIP) of Iowa Department of Transportation.
References
[1] Federal Highway Administration (FHWA), Road Weather
Management Program, Federal Highway Administration
(FHWA), Montgomery, AL, USA, 2020, https://ops.fhwa.dot. gov/weather/weather_events/snow_ice.htm.
[2] T. Usman, L. Fu, and L. F. Miranda-Moreno, “Quantifying safety benefit of winter road maintenance: accident frequency modeling,” Accident Analysis & Prevention, vol. 42, no. 6, pp. 1878–1887, 2010.
[3] Z. Hans, N. Hawkins, K. Gkritza, and M. Shaheed, “Nlenanya, inya. “Safety and mobility impacts of winter weather—phase
3,””Intrans Project Reports, vol. 82, 2014.
[4] Federal Highway Administration, Signalized Intersections
Informations Guide, Federal Highway Administration,
Montgomery, AL, USA, 2013, https://safety.fhwa.dot.gov/ intersection/conventional/signalized/fhwasa13027/, Second edition.
[5] X. Qin, D. A. Noyce, C. Lee, and J. R. Kinar, “Snowstorm event-based crash analysis,”Transportation Research Record:
Journal of the Transportation Research Board, vol. 1948, no. 1,
pp. 135–141, 2006.
[6] M. B. Kursa and W. R. Rudnicki, “Feature selection with the boruta package,”Journal of Statistical Software, vol. 36, no. 11, 2010.
[7] M. B. Kursa, A. Jankowski, and W. R. Rudnicki, “Boruta—a system for feature selection,” Fundamenta Informaticae, vol. 101, no. 4, pp. 271–285, 2010.
[8] W. A. Nixon and L. Qiu, “Effects of adverse weather on traffic crashes: systematic review and meta-analysis,” inProceedings
of the TRB 87th Annual Meeting 2008, Washington, DC, USA,
2008.
[9] A. S. Potter, M. R. Gallagher, and C. W. Bayer,Synthesis on GPS/AVL Equipment Used for Winter Maintenance (No. CR
14-01), Department of Transportation Clear Roads Pooled
Fund, Saint Paul, MN, USA, 2016.
[10] W. Schneider, M. Crow, W. A. Holik et al.,Evaluation of the GPS/AVL Systems for Snow and Ice Operations Resource
Management (No. FHWA/OH-2017-31), Department of
Transportation Office of Statewide Planning and Research, Columbus, OH, USA, 2017.
[11] Z. Hans, N. Hawkins, P. Savolainen, and E. Rista,Operational Data to Assess Mobility and Crash Experience during Winter
Conditions, Center for Weather Impacts on Mobility and
Safety, Cary, NC, USA, 2018.
[12] C. Chen and X. Shi, Modeling the Macroscopic Effects of Winter Maintenance Operations on Traffic Mobility on
Washington Highways, Center for Advanced Multimodal
Mobility Solutions and Education, Charlotte, NC, USA, 2019. [13] B. Hallmark and J. Dong, “Examining the effects of winter road maintenance operations on traffic safety through visual analytics,” in Proceedings of the 23rd International IEEE
Conference on Intelligent Transportation Systems (ITSC),
[14] S. Mafi, Y. AbdelRazig, and R. Doczy, “Machine learning methods to analyze injury severity of drivers from different age and gender groups,” Transportation Research Record:
Journal of the Transportation Research Board, vol. 2672,
no. 38, pp. 171–183, 2018.
[15] O. A. Osman, M. Hajij, P. R. Bakhit, and S. Ishak, “Prediction of near-crashes from observed vehicle kinematics using machine learning,”Transportation Research Record: Journal of
the Transportation Research Board, vol. 2673, no. 12,
pp. 463–473, 2019.
[16] A. Theofilatos, C. Chen, and C. Antoniou, “Comparing machine learning and deep learning methods for real-time crash prediction,”Transportation Research Record: Journal of
the Transportation Research Board, vol. 2673, no. 8,
pp. 169–178, 2019.
[17] M. Amiri, H. R. Pourghasemi, G. A. Ghanbarian, and S. F. Afzali, “Assessment of the importance of gully erosion effective factors using boruta algorithm and its spatial modeling and mapping using three machine learning algo-rithms,”Geoderma, vol. 340, pp. 55–69, 2019.
[18] S. Demiroluk, M. A. Yazici, K. Ozbay, and J. A. Carnegie, “Feature selection for ranking of most influential variables for evacuation behavior modeling across disasters,” Trans-portation Research Record: Journal of the TransTrans-portation
Re-search Board, vol. 2599, no. 1, pp. 24–32, 2016.
[19] R. Prasad, R. C. Deo, Y. Li, and T. Maraseni, “Weekly soil moisture forecasting with multivariate sequential, ensemble empirical mode decomposition and boruta-random forest hybridizer algorithm approach,”Catena, vol. 177, pp. 149– 166, 2019.
[20] J. Li, M. Tran, and J. Siwabessy, “Selecting optimal random forest predictive models: a case study on predicting the spatial distribution of seabed hardness,” PLoS One, vol. 11, no. 2, Article ID e0149089, 2016.
[21] M. Christ, “Distributed and parallel time series feature ex-traction for industrial big data applications,” inProceedings of
the ACML Workshop on Learning on Big Data, Hong Kong,
China, 2016.
[22] B. Hallmark, “Analyzing winter weather impact on safety using snowplow automatic vehicle location,” 2019.
[23] M. Agarwal, T. H. Maze, and R. Souleyrette, Impact of Weather on Urban Freeway Traffic Flow Characteristics and
Facility Capacity, Center for Transportation Research and
Education, Ames, IA, USA, 2005.
[24] K. Kim, “Ridge Regression for Better Usage: Medium, Towards Data Science,” January 2019, https://towardsdatascience.com/ ridge-regression-for-better-usage-2f19b3a202db.
[25] D. Lord and F. Mannering, “The statistical analysis of crashfrequency data: a review and assessment of methodo-logical alternatives,”Transportation Research Part A: Policy
and Practice, vol. 44, no. 5, pp. 291–305, 2010.
[26] A. Goswamy, S. Hallmark, and T. Litteral, Impact of Destination Lighting and Other Factors on Driver’s Injury Severity of Nighttime Crashes at Rural Stop-Controlled
Cross-Intersections Using Proportional Odds Model, Transportation
Research Board, Washington, DC, USA, 2018.
[27] X. Guo, L. Wu, Y. Zou, and L. Fawcett, “Comparative analysis of empirical bayes and bayesian hierarchical models in hot-spot identification,”Transportation Research Record: Journal
of the Transportation Research Board, vol. 2673, no. 7,